West Long Branch, NJ – Bernie Sanders has taken the lead in New Hampshire’s presidential primary, while Pete Buttigieg and Joe Biden currently jockey for second place. Elizabeth Warren and Amy Klobuchar round out the top five in the final Monmouth University Poll of the 2020 Granite State primary. The Iowa caucuses have not helped narrow the field, but the outcome there could eventually have an impact among voters looking for the best candidate to take on President Donald Trump in November. Based on the poll results, this could help Buttigieg and hurt Biden. Sanders, on the other hand, seems to have a firm grip on voters who prioritize issues over electability.
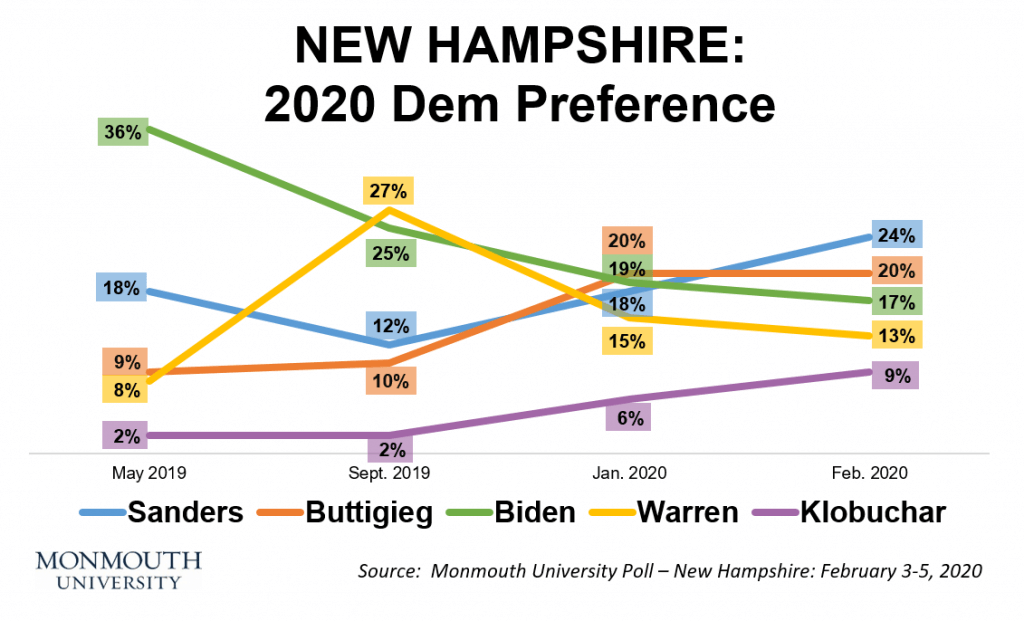
Among registered New Hampshire Democrats and unaffiliated voters who are likely to participate in the February 2020 Democratic primary, the race currently stands at 24% for Sanders, 20% for Buttigieg, 17% for Biden, 13% for Warren, and 9% for Klobuchar. Others registering support include Tulsi Gabbard (4%), Andrew Yang (4%), and Tom Steyer (3%). Michael Bennet and Deval Patrick earn 1% or less. Another 5% of likely primary voters remain undecided and do not lean toward any candidate choice at this time. [Note: Mike Bloomberg will not appear on the New Hampshire ballot and is not included in this poll.]
There have been some clear trends in support since the fall. Sanders has experienced steady growth (from 12% in September and 18% in January). Buttigieg is holding steady from last month (20%) but up from the fall (10%). Two former polling leaders have seen their support slip – Biden from 25% in September and 19% in January, and Warren from 27% in September and 15% in January. Klobuchar’s support has crept up from 2% in September and 6% in January.
Sanders gets his strongest support from voters under 50 years old (34%), self-described liberals (31%), and voters without a college degree (30%). He is also polling better among men (32%) than women (17%). Buttigieg is drawing more support from women (24%) than men (14%) while Biden draws similar support among both men (17%) and women (16%).
“Many voters in New Hampshire remain open to switching their support. The muddle out of Iowa hasn’t narrowed the field, but there are some hints in the poll that Buttigieg could be helped and Biden hurt as the caucus results start to sink in,” said Patrick Murray, director of the independent Monmouth University Polling Institute.
Only half (49%) of New Hampshire primary voters are firmly set on their candidate choice. The poll finds that 78% of primary voters say the Iowa caucus results didn’t change their thinking about which candidate to back. Another 15% said Iowa made them take a second look at their candidate choice, but only 3% report actually changing their vote intention because of it. About 1 in 4 (24%) say they feel more confident about their candidate choice because of the Iowa results and just 8% say they are less confident. Biden is the only candidate with a significant number of supporters who are now less confident in their choice (20%). Buttigieg is, by far, the candidate whose supporters are likely to say the Iowa outcome makes them feel more confident about their choice (56%).
“Confidence is contagious and voters want to go with a winner. This race remains fluid because voters are looking for the strongest candidate to take on Donald Trump. One question to ask is whether Biden supporters will start to have second thoughts. This might not happen until the final days, because the Iowa results were still trickling in as we wrapped up the poll,” said Murray.
A majority of New Hampshire primary voters (55%) say that beating Trump is a more important factor in their vote than any policy issue they are concerned with. Another 29% say beating Trump is about as important as their top policy concern and just 15% say electability is less important than policy issues. Supporters of Biden (75%) and Klobuchar (67%) are the most likely to say that beating Trump surpasses any policy considerations, while Sanders backers (38%) are the least likely to feel this way. Supporters of Buttigieg (59%) and Warren (60%) are on par with overall voter sentiment on this factor, while backers of candidates who are not polling in the top five (40%) are more like Sanders supporters in being less likely to prioritize Trump’s defeat as a more important factor in their candidate choice.
“Sanders voters hone in on his policy platform as the decisive factor in their support. Biden voters are focused almost exclusively on beating Trump. Buttigieg seems to have an appeal for both types of voters. This may help him in the final days of this contest, especially if New Hampshire Democrats perceive the field to be narrowing,” said Murray.
With the campaign still in flux, Monmouth examined the race under a number of different scenarios. Likely Democrats were asked how they would vote if the field was winnowed down. In a race restricted to the top five polling candidates, hypothetical support stands at 27% Sanders, 22% Buttigieg, 17% Biden, 13% Warren, and 13% Klobuchar. Take Klobuchar out of this picture and the race tightens to 28% Sanders, 28% Buttigieg, 19% Biden, and 16% Warren.
Monmouth analysts also ran a variety of likely voter models on the full list of candidates in addition to the benchmark results reported in this release. A model that increases the share of low propensity voters shows Sanders in front with 25%, Buttigieg at 19%, Biden at 16%, Warren at 12%, Klobuchar at 8%, Yang at 5%, and Gabbard and Steyer at 4% each. A model that gives more weight to traditional primary voters shows Sanders with 22%, Buttigieg at 21%, Biden at 18%, Warren at 15%, Klobuchar at 10%, Gabbard at 3%, and Steyer and Yang at 2% each.
“Sanders maintains his lead in all our models. The potential for change in this race seems to be as much about persuading voters to switch horses as it is about absolute turnout,” said Murray.
The Monmouth University Poll also asked Democratic primary voters if the Trump impeachment trial impacted their candidate choice. Fully 91% say that it didn’t change their thinking at all, while just 7% say it made them take a second look at their candidate choice (although only 1% report actually changing their vote intention because of it). Overall, 19% say that the impeachment trial made them feel more confident in their choice and just 3% feel less confident. There are no significant differences in this opinion based on which candidate voters support.
The Monmouth University Poll was conducted by telephone from February 3 to 5, 2020 with 503 New Hampshire voters who are likely to vote in the Democratic presidential primary on February 11, 2020, out of 777 registered voters that were contacted for the poll. [Note: 130 of the 503 likely voter interviewers were conducted before the first results from the Iowa caucuses were released.] The question results in this release have a margin of error of +/- 4.4 percentage points. The poll was conducted by the Monmouth University Polling Institute in West Long Branch, NJ.
QUESTIONS AND RESULTS
(* Some columns may not add to 100% due to rounding.)
1. If the Democratic primary election for president was today, would you vote for [NAMES WERE ROTATED]? [If UNDECIDED: If you had to vote for one of these candidates at this moment, who do you lean toward?]
| TREND: (with leaners) | Feb. 2020 | Jan. 2020 | Sept. 2019 | May 2019 |
| Bernie Sanders | 24% | 18% | 12% | 18% |
| Pete Buttigieg | 20% | 20% | 10% | 9% |
| Joe Biden | 17% | 19% | 25% | 36% |
| Elizabeth Warren | 13% | 15% | 27% | 8% |
| Amy Klobuchar | 9% | 6% | 2% | 2% |
| Tulsi Gabbard | 4% | 4% | 2% | <1% |
| Andrew Yang | 4% | 3% | 2% | 1% |
| Tom Steyer | 3% | 4% | 2% | n/a |
| Michael Bennet | 1% | 2% | 0% | 0% |
| Deval Patrick | <1% | <1% | n/a | n/a |
| (VOL) Other | 1% | 1%* | 8%* | 13%* |
| (VOL) No one | 0% | 0% | 1% | <1% |
| (VOL) Undecided | 5% | 7% | 9% | 11% |
| (n) | (503) | (404) | (401) | (376) |
* Includes candidates who have since dropped out.
2. Are you firmly decided on your candidate choice or are you open to the possibility of voting for a different candidate on primary day? [If OPEN: Would you rate the possibility of supporting a different candidate as high, moderate, or low?]
| Feb. 2020 | ||
| Firmly decided | 49% | |
| Open to different candidate … | high possibility | 11% |
| moderate possibility | 25% | |
| low possibility | 10% | |
| (VOL) Don’t know | 1% | |
| No first choice (from Q1) | 5% | |
| (n) | (503) | |
3. If the Democratic nomination came down to the following five candidates by the New Hampshire primary, who would you vote for? [NAMES WERE ROTATED]
| Feb. 2020 | |
| Bernie Sanders | 27% |
| Pete Buttigieg | 22% |
| Joe Biden | 17% |
| Elizabeth Warren | 13% |
| Amy Klobuchar | 13% |
| (VOL) None of these/won’t vote | 3% |
| (VOL) Undecided | 4% |
| (n) | (503) |
4. And if the Democratic nomination came down to just these four candidates by the New Hampshire primary, who would you vote for? [NAMES WERE ROTATED]
| Feb. 2020 | Jan. 2020 | |
| Pete Buttigieg | 28% | 23% |
| Bernie Sanders | 28% | 21% |
| Joe Biden | 19% | 24% |
| Elizabeth Warren | 16% | 18% |
| (VOL) None of these/won’t vote | 3% | 5% |
| (VOL) Undecided | 5% | 8% |
| (n) | (503) | (404) |
5. When thinking about who you are supporting in the Democratic primary, how much of a factor is beating Donald Trump next November – is it more important than any policy issue you are concerned with, about as important as your top policy concern, or less important than your top policy concern?
| Feb. 2020 | |
| More important | 55% |
| About as important | 29% |
| Less important | 15% |
| (VOL) Don’t know | 1% |
| (n) | (503) |
[NOTE: QUESTION 6 ONLY ASKED ON 2/4 AND 2/5; n=373, m.o.e= +/-5.1%]
6. Did the results of the Iowa caucuses make you take a second look at any of the candidates, or did this not really change your thinking about the primary? [If TOOK A SECOND LOOK: Did you actually change who you would support, move from undecided to a candidate, or did it not change your choice in the end?]
| Feb. 2020 | ||
| Took a second look, and… | changed support | 3% |
| moved from undecided | 2% | |
| did not change choice | 10% | |
| Not really change thinking | 78% | |
| (VOL) Don’t know | 8% | |
| (n) | (373) | |
[NOTE: QUESTION 7 ONLY ASKED ON 2/4 AND 2/5; n=373, m.o.e= +/-5.1%]
7. Did the results of the Iowa caucuses help you feel more confident or less confident about the candidate you are supporting, or did the Iowa results have no impact either way?
| Feb. 2020 | |
| More confident | 24% |
| Less confident | 8% |
| No impact | 62% |
| (VOL) Don’t know | 6% |
| (n) | (373) |
8. Did the impeachment trial of Donald Trump make you take a second look at any of the candidates, or did this not really change your thinking about the primary? [If TOOK A SECOND LOOK: Did you actually change who you would support, move from undecided to a candidate, or did it not change your choice in the end?]
| Feb. 2020 | ||
| Took a second look, and… | changed support | 1% |
| moved from undecided | 0% | |
| did not change choice | 6% | |
| Not really change thinking | 91% | |
| (VOL) Don’t know | 1% | |
| (n) | (503) | |
9. Did the Trump impeachment trial help you feel more confident or less confident about the candidate you are supporting, or did the impeachment trial have no impact either way?
| Feb. 2020 | |
| More confident | 19% |
| Less confident | 3% |
| No impact | 77% |
| (VOL) Don’t know | 1% |
| (n) | (503) |
METHODOLOGY
The Monmouth University Poll was sponsored and conducted by the Monmouth University Polling Institute from February 3 to 5, 2020 with a statewide random sample of 777 New Hampshire voters drawn from a list of registered voters who participated in a primary or general election in the past two election cycles, or have registered to vote since 2018. This includes 377 contacted by a live interviewer on a landline telephone and 400 contacted by a live interviewer on a cell phone, in English. Results are based on 503 voters who are likely to vote in the Democratic presidential primary on February 11, 2020. Monmouth is responsible for all aspects of the survey design, data weighting and analysis. The full sample is weighted for party registration, age, gender, race, and education based on state voter registration list information and U.S. Census information (CPS 2018 supplement). Data collection support provided by Braun Research (field) and Aristotle (voter sample). For results based on the sample of likely Democratic primary voters, one can say with 95% confidence that the error attributable to sampling has a maximum margin of plus or minus 4.4 percentage points (unadjusted for sample design). Sampling error can be larger for sub-groups (see table below). In addition to sampling error, one should bear in mind that question wording and practical difficulties in conducting surveys can introduce error or bias into the findings of opinion polls.
| DEMOGRAPHICS (weighted) |
| Party Registration |
| 56% Democrat |
| 44% None |
| Self-Reported Party |
| 54% Democrat |
| 46% Other, independent |
| 46% Male |
| 54% Female |
| 17% 18-34 |
| 20% 35-49 |
| 38% 50-64 |
| 25% 65+ |
| 94% White, non-Hispanic |
| 6% Other race, Hispanic |
| 46% No degree |
| 54% 4 year degree |
Click on pdf file link below for full methodology and crosstabs by key demographic groups.