West Long Branch, NJ – A smaller field and an increase in the number of independents who plan to vote in New Hampshire’s Republican primary have boosted Nikki Haley’s standing there. However, the former South Carolina Governor and U.N. Ambassador continues to trail former President Donald Trump by a wide margin in the Monmouth (“Mon-muth”) University-Washington Post Poll. Trump holds a clear issue advantage over his nearest competitors on immigration, the economy, and foreign policy. The poll also finds the current primary is less of a hands-on affair than it was in 2016, with fewer than 1 in 4 voters being personally contacted by a campaign.
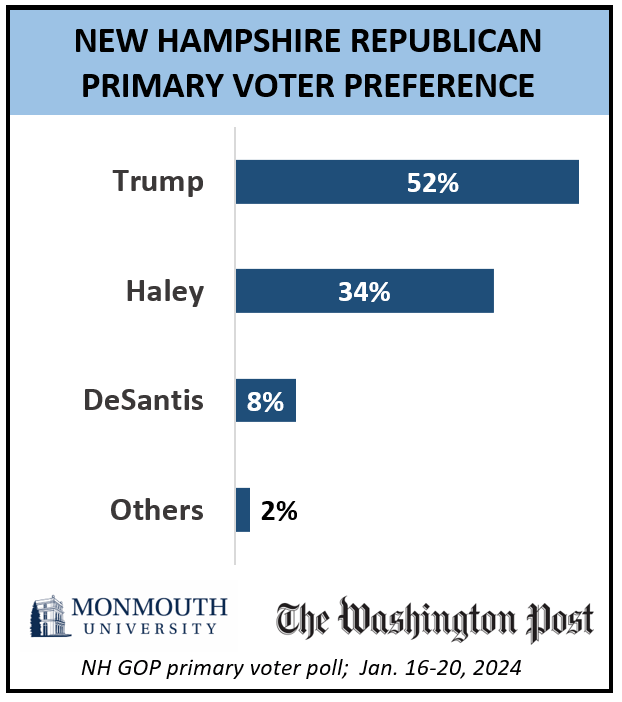
When asked for whom they would vote in Tuesday’s Republican presidential primary, 52% of potential voters choose Trump and 34% pick Haley. While Haley’s support has increased by 16 points since November (18%), Trump’s dominance has not wavered. In fact, his backing has also improved from the fall (up 6 points from 46%). Florida Governor Ron DeSantis (8%) trails far behind the leaders with a support level that is basically unchanged from November (7%). [The poll was conducted before DeSantis dropped out on Sunday. DeSantis supporters in the poll were twice as likely to name Trump than Haley as their second choice.]
Trump’s coalition remains the same as in the fall. He receives backing from large majorities of voters who describe themselves as MAGA supporters (82%) or very conservative (78%), as well as white evangelicals (69%) and those without a college degree (60%). Haley has increased her share of the college graduate vote (43%, up from 29% in November), but it has not come at Trump’s expense (39%, up from 32%).
The poll also suggests there could be a measurable influx of Democratic-leaning independents who will participate in Tuesday’s primary. The number of registered independents who plan to take a Republican ballot (63%) has increased since November (52%), and more than a third of this group say they voted for Democrat Joe Biden in the 2020 general election. This gives Haley an advantage among independent voters, but not an overwhelming one. Among all registered independents in the potential GOP primary electorate, Haley’s support stands at 48% while Trump gets 38%.
“Even with a bump in the number of Democratic leaners turning out in the Republican primary, Haley is not able to catch the front-runner. Trump’s base continues to be more committed and more motivated than other primary voters,” said Patrick Murray, director of the independent Monmouth University Polling Institute.
More Trump supporters (69%) than Haley backers (55%) say they are extremely motivated to vote in the primary. Trump continues to earn favorable ratings from a majority of potential New Hampshire Republican primary voters (59%, identical to November), while positive ratings for both Haley (46%, from 56%) and DeSantis (41%, from 47%) have slipped since the fall. Gov. Chris Sununu’s endorsement of Haley seems to have had minimal impact, with 83% saying it has no influence on their candidate choice. The remainder are split between the governor’s backing making them more likely (10%) or less likely (6%) to vote for Haley.
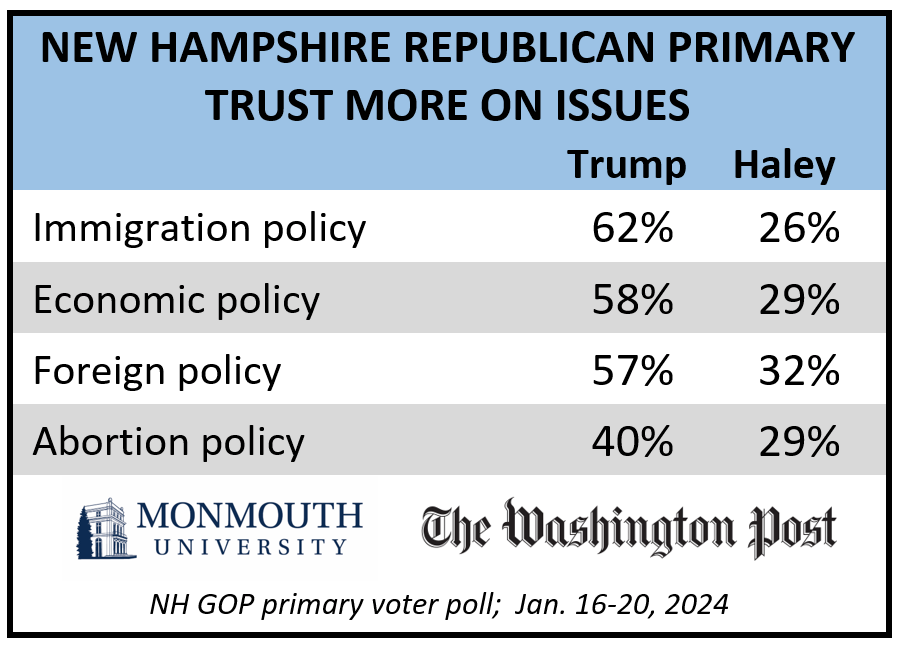
New Hampshire Republican potential primary voters tend to trust Trump over Haley across a broad range of issues. The former president’s strongest area is immigration policy – 62% trust him more to handle this issue compared with 26% who trust Haley more. Trump also has a strong advantage on economic policy – 58%, to 29% for Haley – and foreign policy – 57%, to 32% for Haley. Voters are somewhat more divided on who they trust more to handle abortion policy – 40% say Trump, 29% say Haley, and 22% trust both equally.
The poll also finds that few voters have been personally contacted by a campaign asking for their support. Just 23% of the potential primary electorate has received this type of outreach. This includes 15% who say they have been contacted by Haley’s campaign, 9% who have been contacted on behalf of Trump, and 8% who have been asked to vote for DeSantis. Eight years ago, a Monmouth University Poll taken right before the 2016 New Hampshire primary found more than twice as many Republican voters (49%) reported receiving a campaign contact then (including 19% who were contacted on behalf of Trump’s campaign).
“There seems to be less voter engagement and more of an air of inevitability around this year’s nomination contest than there was in 2016,” said Murray.
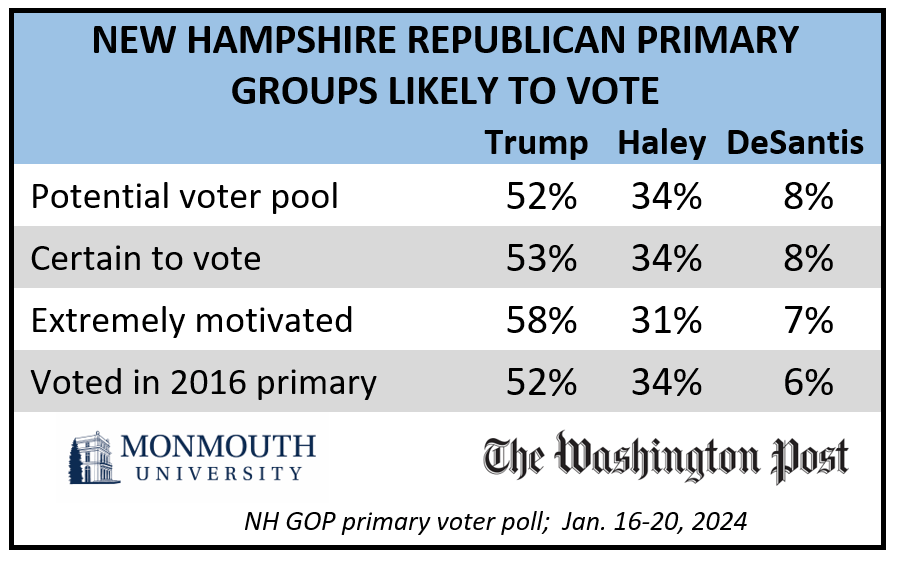
It should be noted that the analysis in this poll report does not include a modeled “likely voter” projection. The results presented here represent the pool of potential Republican primary voters, i.e., those who indicate having at least some chance of voting on Tuesday. The vast majority of this group, though, say they are absolutely certain to vote (or have already voted). Trump holds 53% support among this “certain” group to 34% for Haley. Among voters who are extremely motivated to vote, Trump’s share climbs to 58% with Haley at 31%. Looking only at voters who participated in the 2016 primary – a contest Trump won with just over one-third of the vote in a crowded field – fully 52% are backing Trump now, with Haley at 34%.
“Perceptions of competitiveness are usually a driving factor in turnout. Consistent primary voters will always come out. For other voters, though, a sense of inevitability means we could see lower turnout than usual for New Hampshire. Who does that help? The motivation needle seems to point toward Trump,” said Murray.
The Monmouth University-Washington Post Poll was conducted by telephone and online from January 16 to 20, 2024 with 712 potential Republican presidential primary voters in New Hampshire. The question results in this release have a margin of error of +/- 4.2 percentage points for this sample. The poll was conducted jointly by the Monmouth University Polling Institute and the Washington Post.
QUESTIONS AND RESULTS
(* Some columns may not add to 100% due to rounding.)
1.How closely are you following the race for the 2024 Republican presidential nomination?
| Trend: | Jan. 2024 | Nov. 2023 |
|---|---|---|
| Very closely | 65% | 52% |
| Somewhat closely | 27% | 34% |
| Not too closely | 6% | 10% |
| Not at all closely | 2% | 4% |
| (VOL) Don’t know | 0% | 0% |
| (n) | (712) | (606) |
2.How likely are you to vote in New Hampshire’s primary for president next week – have you already voted by absentee ballot, are you absolutely certain to vote, will you probably vote, are the chances 50-50, or less than that?
| Trend: | Jan. 2024 | Nov. 2023 |
|---|---|---|
| Already voted | 3% | n/a |
| Absolutely certain to vote | 84% | 88% |
| Will probably vote | 9% | 9% |
| Chances are 50-50 | 3% | 3% |
| Less than that | n/a | n/a |
| (n) | (712) | (606) |
3.[Will/Did] you vote in the Republican or Democratic primary?
| Response: | Jan. 2024 |
|---|---|
| Republican | 100% |
| Democratic | 0% |
| (n) | (712) |
4.How motivated are you to vote in the Republican presidential primary?
| Trend: | Jan. 2024 | Nov. 2023 |
|---|---|---|
| Extremely motivated | 61% | 63% |
| Very motivated | 25% | 23% |
| Somewhat motivated | 11% | 12% |
| Not motivated | 2% | 2% |
| (n) | (712) | (606) |
5.I’m going to read you the names of candidates running for president in the Republican Party. Please tell me if your general impression of each is favorable or unfavorable, or if you don’t really have an opinion. If you have not heard of the person, just let me know. First, [READ NAME]. [NAMES WERE ROTATED]
| Trend: | Favorable | Unfavorable | No opinion | Not heard of | (VOL) No answer | (n) |
|---|---|---|---|---|---|---|
| Former President Donald Trump | 59% | 36% | 3% | 0% | 3% | (712) |
| — November 2023 | 59% | 36% | 4% | 0% | 1% | (606) |
| Florida Governor Ron DeSantis | 41% | 42% | 12% | 0% | 5% | (712) |
| — November 2023 | 47% | 40% | 11% | 0% | 2% | (606) |
| Former South Carolina Governor and U.N. Ambassador Nikki Haley | 46% | 40% | 10% | 1% | 4% | (712) |
| — November 2023 | 56% | 31% | 8% | 2% | 2% | (606) |
6. If the Republican primary for president was held today, would you vote for Donald Trump, Ron DeSantis, Nikki Haley, or someone else? [NAMES WERE ROTATED] [If ALREADY VOTED: In the Republican primary for president, did you vote for…?”]
| Trend: | Jan. 2023 | Nov. 2023 |
|---|---|---|
| Donald Trump | 52% | 46% |
| Nikki Haley | 34% | 18% |
| Ron DeSantis | 8% | 7% |
| Other-Chris Christie | 1% | 11% |
| Other-Someone else | 1% | 0% |
| Vivek Ramaswamy | n/a | 8% |
| Tim Scott | n/a | 3% |
| Doug Burgum | n/a | 2% |
| Asa Hutchinson | n/a | 1% |
| (VOL) Don’t know | 5% | 4% |
| (n) | (712) | (606) |
7.Are you definitely supporting [READ NAME FROM Q6] to be the Republican Party’s nominee, or would you consider supporting another candidate? [CHOICES WERE ROTATED]
| Trend: | Jan. 2023 | Nov. 2023 |
|---|---|---|
| Already voted (from Q2) | 3% | n/a |
| Definitely supporting | 72% | 59% |
| Would consider another candidate | 16% | 33% |
| (VOL) Don’t know | 4% | 3% |
| No first choice (from Q6) | 5% | 4% |
| (n) | (712) | (606) |
8.Who would be your second choice? [If “DEFINITELY SUPPORTING” FIRST CHOICE, ASK:] If [NAME FROM Q6] decides to drop out of the race before the New Hampshire primary, who would be your second choice?
| Trend: | Jan. 2023 | Nov. 2023 |
|---|---|---|
| Donald Trump | 8% | 8% |
| Ron DeSantis | 34% | 20% |
| Nikki Haley | 9% | 17% |
| Someone else | 16% | 2% |
| (VOL) No one | 13% | 9% |
| Other* | n/a | 34% |
| (VOL) Would not vote | 4% | 1% |
| (VOL) Don’t know | 8% | 4% |
| No first choice (from Q6) | 5% | 4% |
| Already voted (from Q2) | 3% | n/a |
| (n) | (712) | (606) |
9.How would you feel if [READ NAME] became the Republican nominee – enthusiastic, satisfied, dissatisfied, or upset? [NAMES WERE ROTATED]
Donald Trump
| Trend: | Jan. 2024 | Nov. 2023 | Jan. 2016* |
|---|---|---|---|
| Enthusiastic | 40% | 41% | 26% |
| Satisfied | 24% | 21% | 30% |
| Dissatisfied | 12% | 14% | 17% |
| Upset | 24% | 23% | 25% |
| (VOL) Don’t know | 1% | 2% | 2% |
| (n) | (712) | (606) | (414) |
Nikki Haley
| Trend: | Jan. 2024 | Nov. 2023 |
|---|---|---|
| Enthusiastic | 17% | 20% |
| Satisfied | 36% | 40% |
| Dissatisfied | 25% | 21% |
| Upset | 19% | 14% |
| (VOL) Don’t know | 3% | 5% |
| (n) | (712) | (606) |
Ron DeSantis
| Trend: | Jan. 2024 | Nov. 2023 |
|---|---|---|
| Enthusiastic | 12% | 16% |
| Satisfied | 41% | 39% |
| Dissatisfied | 28% | 25% |
| Upset | 15% | 17% |
| (VOL) Don’t know | 5% | 3% |
| (n) | (712) | (606) |
10.Did anyone contact you personally to ask you to vote for a particular candidate, or not?
| Trend: | Jan. 2024 | Feb. 2016* |
|---|---|---|
| Yes | 23% | 49% |
| No | 76% | 51% |
| (VOL) Don’t know | 1% | 0% |
| (n) | (712) | (508) |
10A.For which candidate or candidates were you asked to vote? [LIST WAS NOT READ] [Multiple responses were accepted.]
| Response: | Jan. 2024 |
|---|---|
| Donald Trump | 9% |
| Ron DeSantis | 8% |
| Nikki Haley | 15% |
| Vivek Ramaswamy | 5% |
| Asa Hutchinson | 1% |
| Chris Christie | 2% |
| Tim Scott | 0% |
| Joe Biden | 0% |
| Robert F. Kennedy Jr. | 0% |
| Dean Phillips | 1% |
| Other | 0% |
| (VOL) Don’t know | 3% |
| Was not contacted (from Q10) | 77% |
| (n) | (712) |
[Q11 AND Q12 WERE ROTATED.]
11.Who do you trust more to handle [READ ITEM] policy – Donald Trump or Nikki Haley, or do you trust both equally on this issue? [ITEMS WERE ROTATED]
| Response: | Trump | Haley | Both equally | (VOL) Don’t know | (n) |
|---|---|---|---|---|---|
| Immigration policy | 62% | 26% | 9% | 3% | (712) |
| Economic policy | 58% | 29% | 11% | 2% | (712) |
| Foreign policy | 57% | 32% | 10% | 2% | (712) |
| Abortion policy | 40% | 29% | 22% | 8% | (712) |
12.Who do you trust more to handle [READ ITEM] policy – Donald Trump or Ron DeSantis, or do you trust both equally on this issue? [ITEMS WERE ROTATED]
| Response: | Trump | DeSantis | Both equally | (VOL) Don’t know | (n) |
|---|---|---|---|---|---|
| Immigration policy | 47% | 13% | 30% | 10% | (712) |
| Economic policy | 52% | 15% | 24% | 10% | (712) |
| Foreign policy | 54% | 17% | 20% | 10% | (712) |
| Abortion policy | 36% | 11% | 35% | 17% | (712) |
[No question 13]
14.Do you think abortion should be: legal in all cases, legal in most cases, illegal in most cases, or illegal in all cases? [CHOICES WERE READ IN REVERSE ORDER FOR A RANDOM HALF SAMPLE]
| Trend: | Jan. 2024 | Nov. 2023 |
|---|---|---|
| Legal in all cases | 17% | 14% |
| Legal in most cases | 39% | 41% |
| Illegal in most cases | 29% | 32% |
| Illegal in all cases | 7% | 8% |
| (VOL) Don’t know | 7% | 5% |
| (n) | (712) | (606) |
15.How concerned, if at all, are you that the Republican Party is focusing too much on abortion – very, somewhat, not too, not at all?
| Response: | Jan. 2024 |
|---|---|
| Very concerned | 26% |
| Somewhat concerned | 27% |
| Not too concerned | 23% |
| Not at all concerned | 19% |
| (VOL) Don’t know | 4% |
| (n) | (712) |
16.Do you believe Joe Biden won the 2020 election fair and square, or do you believe that he only won it due to voter fraud?
| Trend: | Jan. 2024 | Nov. 2023 |
|---|---|---|
| Fair and square | 42% | 38% |
| Due to voter fraud | 51% | 55% |
| (VOL) Don’t know | 7% | 6% |
| (n) | (712) | (606) |
17.In his response to the 2020 presidential election, do you think Donald Trump committed a crime, did something wrong but not criminal, or did nothing wrong? [CHOICES WERE READ IN REVERSE ORDER FOR A RANDOM HALF SAMPLE]
| Trend: | Jan. 2024 | Nov. 2023 |
|---|---|---|
| Committed a crime | 26% | 22% |
| Wrong but not criminal | 27% | 29% |
| Did nothing wrong | 45% | 45% |
| (VOL) Don’t know | 3% | 3% |
| (n) | (712) | (606) |
18.Do you approve or disapprove of the way Chris Sununu is handling his job as governor of New Hampshire? [Do you approve/disapprove strongly or somewhat?]
| Trend: | Jan. 2024 | Nov. 2023 |
|---|---|---|
| Approve strongly | 38% | 44% |
| Approve somewhat | 36% | 37% |
| Disapprove somewhat | 13% | 10% |
| Disapprove strongly | 11% | 7% |
| (VOL) Don’t know | 2% | 2% |
| (n) | (712) | (606) |
19.Does Governor Sununu’s endorsement of Nikki Haley have any influence on your vote in the presidential primary, or not? [If YES:] Does Sununu’s endorsement make you more likely or less likely to vote for Haley? [CHOICES WERE ROTATED]
| Response: | Jan. 2024 |
|---|---|
| Yes, more likely | 10% |
| Yes, less likely | 6% |
| No influence | 83% |
| (VOL) Don’t know | 1% |
| (n) | (712) |
20.Did you happen to vote in the Republican primary in 2016 when Donald Trump ran against John Kasich, Ted Cruz, Jeb Bush, Marco Rubio, Chris Christie, Carly Fiorina, and Ben Carson, or did you skip that primary? [If YES:] Which candidate did you vote for in the 2016 primary? [Vote choice is reported only for voters validated as participating in the 2016 primary.]
| Response: | Jan. 2024 |
|---|---|
| Donald Trump | 31% |
| John Kasich | 4% |
| Ted Cruz | 1% |
| Jeb Bush | 2% |
| Marco Rubio | 1% |
| Chris Christie | 2% |
| Carly Fiorina | 1% |
| Ben Carson | 2% |
| (VOL) Someone else | 1% |
| (VOL) Don’t know | 4% |
| Do not recall voting | 4% |
| Not voted per registration list | 46% |
| (n) | (712) |
21.Did you happen to vote in the 2020 general election between Donald Trump and Joe Biden, or did you skip that election? [If YES:] Who did you vote for? [Vote choice is reported only for voters validated as participating in the 2020 election.]
| Response: | Jan. 2024 |
|---|---|
| Donald Trump | 63% |
| Joe Biden | 21% |
| (VOL) Someone else | 1% |
| (VOL) Don’t know | 1% |
| Do not recall voting | 1% |
| Not voted per registration list | 12% |
| (n) | (712) |
METHODOLOGY
The Monmouth University-Washington Post Poll was conducted from January 16 to 20, 2024, among a probability-based sample of 939 New Hampshire voters who are either registered with the Republican Party or are undeclared. The poll was conducted in English, and included 289 live landline telephone interviews, 311 live cell phone interviews, and 339 online surveys via a cell phone text invitation. Interviewing services were provided by Braun Research using telephone numbers randomly selected from a list of voters obtained from Aristotle. The full sample is weighted for region, age, gender and race based on the voter list and education based on US Census information (CPS and ACS one-year surveys). Results released from this poll are based on a sub-set of 712 voters who indicated they have a 50-50 chance or better of voting in the 2024 Republican presidential primary. For this sample, one can say with 95% confidence that the error attributable to sampling has a maximum margin of plus or minus 4.2 percentage points adjusted for sample design effects (1.30). Sampling error can be larger for sub-groups (see table below). In addition to sampling error, one should bear in mind that question wording and practical difficulties in conducting surveys can introduce error or bias into the findings of opinion polls. The Monmouth University Polling Institute and the Washington Post jointly sponsored and conducted this poll, and are responsible for all aspects of the questionnaire and sample design as well as weighting and data analysis.
Potential primary voter demographics (weighted)
Party registration (voter list): 53% Republican,47% independent
Party ID (self-reported): 35% strong Rep., 42% soft or lean Rep., 23% Ind. or Dem.
Ideology: 25% very conservative, 38% somewhat conservative, 37% moderate, liberal
Sex: 55% male, 45% female
Race: 93% White, 1% Black, 4% Hispanic, 2% Asian/other
Age: 13% 18-34, 19% 35-49, 35% 50-64, 33% 65+
Education: 29% high school or less, 29% some college, 25% 4-year degree, 17% advanced degree
Income: 23% <$50K, 31% $50 to <$100K, 46% $100K+
Trump 2016 primary share (county): 32% above average, 36% average (35-36%), 33% below average
White evangelical: 18% yes, 82% no
MAGA supporter: 49% yes, 51% no
Click on pdf file link below for full methodology and crosstabs by key demographic groups.