West Long Branch, NJ – Follow-up interviews with Democratic primary voters by the Monmouth University Poll illustrates contrasting stability and volatility in the presidential nomination contest. Overall, one-third of these voters switched horses before the campaign ended. Bernie Sanders had the most loyal base but attracted very few converts. On the other hand, Joe Biden was able to broaden his appeal as the campaign progressed. Still, about 1 in 10 primary voters are not particularly pleased with who won the contest. Some of these voters will bite their lips and vote for Biden in the end, while a small handful will support Donald Trump or a third-party candidate. The study also finds a high degree of party enthusiasm around the prospect of Biden choosing a woman of color as his running mate.
During the 2020 presidential primary campaign, Monmouth conducted more than 14,000 interviews with likely Democratic primary voters. A total of 2,240 of these voters participated in a post-primary interview conducted online in early June. Most of these voters participated in the first two contests in Iowa and New Hampshire. This report presents key findings from the research from this specific sample. More information can be found in the methodology statement at the end of this release.
Voter volatility in the primaries
Most Democratic voters stuck to their guns between the first time Monmouth interviewed them and their actual nomination vote, but follow-up interviews found a significant amount of fluidity. While Biden held a nominal lead in national preference polls throughout 2019, a large number of candidates remained marginally viable into the early contests. The panel study found that 32% of participants ultimately switched their support from the candidate they said they were backing in their pre-election interview with Monmouth.
Biden and Sanders stand out, though, for maintaining high levels of consistent support. Among those who supported Biden in Monmouth’s pre-election polls, 66% stayed with him in their actual vote. Another 22% of Biden’s initial supporters reported voting for a different candidate in the end and 9% said they chose not to vote in the primary at all. Among those who initially supported Sanders in Monmouth’s polling, 68% stuck with him in the end, while 22% voted for another candidate and 8% did not vote. Pete Buttigieg also had similarly high consistency in his support (65% of initial supporters stayed with him, 28% voted for another candidate, and 6% did not vote). Voter loyalty was slightly less firm among pre-election supporters of Elizabeth Warren (58% voted for her, 33% switched, 8% did not vote) and Amy Klobuchar (57% voted for her, 36% switched, 5% did not vote).
Another way to look at voter fluidity is by examining the composition of each candidates’ bloc in the final vote. Sanders ended up attracting the least crossover vote among Democratic primary voters polled by Monmouth. Just 26% of his actual voters had initially supported another candidate before backing him in the end. By contrast, late-stage converts made up a larger one-third of the final tally for Biden (34%), Buttigieg (34%), and Warren (33%), and accounted for nearly half (46%) of Klobuchar’s actual vote in the end according to the Democrats polled by Monmouth.
“Bernie Sanders probably had the most loyal base in the entire field, but he also attracted the fewest converts. This is a major reason why he quickly lost ground once other contenders dropped out of the race,” said Patrick Murray, director of the independent Monmouth University Polling Institute.
| Democratic Primary Voters Who Switched Horses | ||||||
| Initial preference… | Biden | Sanders | Warren | Buttigieg | Klobuchar | Other |
| Actual vote… | ||||||
| Biden | — | 31% | 22% | 42% | 53% | 37% |
| Sanders | 6% | — | 26% | 9% | 4% | 6% |
| Warren | 14% | 20% | — | 11% | 17% | 13% |
| Buttigieg | 31% | 18% | 26% | — | 21% | 19% |
| Klobuchar | 32% | 15% | 19% | 34% | — | 20% |
| Bloomberg | 6% | 4% | 1% | 0% | 3% | 1% |
| Steyer | 6% | 2% | 6% | 4% | 1% | 1% |
| Yang | 2% | 4% | 1% | 0% | 1% | 1% |
| Gabbard | 2% | 5% | 0% | 0% | 1% | 1% |
| Source: Monmouth University Poll panel of Democratic primary voters, June 2020 | ||||||
Among Democratic voters who switched their support in these early contests, Biden, Klobuchar, and Buttigieg ended up being the main beneficiaries. In fact, far more Sanders voters who defected ended up in the Biden camp (31%) than Biden defectors eventually voted for Sanders (6%). Warren supporters were the only voters where a sizable number of switchers actually went over to Sanders (26%).
“While Biden certainly had key demographic blocs comprising his base, he did pick up support from all corners of the Democratic electorate as the campaign rolled along. There were a number of defined ‘lanes’ in this race but the boundaries between them were a little bit blurry,” said Murray.
Satisfaction with outcome and November implications
One concern among Democratic leaders during the topsy-turvy primary battle was whether Biden could coalesce the party once he secured the nomination. Most party voters interviewed by Monmouth are satisfied with the outcome, but only one-third (33%) describe themselves as “enthusiastic” – including only a bare majority (55%) of Biden’s own voters. Moreover, 1 in 10 (11%) Democratic voters say they would actually like to see the party delegates choose another nominee at the national convention. Sanders voters (36%) are among those most likely to want the primary results overturned. In fact, 17% of Sanders voters disapprove of their candidate’s decision to endorse Biden, while 68% approve and 15% say it doesn’t matter to them or are not sure. A much smaller but still measurable number of voters for Buttigieg (9%), Klobuchar (9%), and Warren (6%) also say they would like to see another nominee chosen in Milwaukee.
Still, when Monmouth asked its panel of voters about November, 93% said they will support Biden. Just 3% will vote for Trump and 2% will vote for a third-party candidate, while another 2% will not vote at all or are unsure what they will do. Just 4% of Sanders voters say they will support Trump while 81% will cast their ballot for Biden. A sizable 11% intend to vote for a third-party candidate, though, while 5% will sit out November or are unsure what they will do.
“It’s not clear what to make of these numbers. Nearly all the Democrats we interviewed are behind Biden for November, but losing up to 15 percent of Sanders supporters, even to a third-party candidate, could be problematic if the race is extremely tight. The question is, will these voters really go that route when the time comes,” said Murray. He added, “The poll is not able to make a direct comparison to 2016, although it seems reasonable to assume that disaffection among Sanders voters is lower now than it was four years ago.”
Aside from Sanders voters, Biden has near universal support among Democrats who backed other candidates in the primary field – with two noted exceptions. Voters who supported Andrew Yang in Monmouth’s pre-election polls are a little less likely than other Democrats to say they will vote for Biden in November (74%) and a little more likely to support Trump (13%) or another candidate (13%). However, this level of attrition pales in comparison to the massive lack of support earned by the Democratic ticket among Tulsi Gabbard supporters. Fully 51% of these voters say they are backing Trump in November. Just 28% will support Biden and 13% will vote for a third-party candidate. The Gabbard bloc’s contrary voting preferences extend down the ballot. Nearly half (46%) say they will cast a Republican vote in their U.S. House districts. Even among other potentially disaffected Democratic primary voters, less than 1 in 10 say they will support the GOP candidate for Congress (9% for Yang supporters and 4% for Sanders supporters).
“This isn’t a case of sour grapes. A large chunk of Gabbard’s support was effectively Republican to begin with. Biden, or indeed any other nominee, would never have a chance with them,” said Murray.
A woman of color on ticket
Six in ten (59%) Democratic primary voters in Monmouth’s panel believe having a woman of color as Biden’s running mate would increase the ticket’s chances of victory. Just 5% say such a pick would make a Democratic win less likely, 16% say it would make no difference and 20% are not sure.
“Voters are not the best strategists, but the nominee has to be attentive to his base. And a lot of Democratic voters think having a woman of color on the ticket would be a home run,” said Murray.
Specifically, 63% say they would be very satisfied if Biden chose a black woman as the party’s nominee for vice president. Half (50%) would feel very satisfied about a Latina pick, 45% for an Asian woman, 40% for a white woman, and 38% for a Muslim woman. Interestingly, Warren voters tend to be the most enthusiastic about any of these picks, but even more so for a woman of color (77% very satisfied with a black woman, 67% Latina, 60% Asian, 55% Muslim) than for a white woman (47%). On the other hand, among the 1 in 10 Democrats who are dissatisfied with Biden at the top of the ticket, fewer than half say having a woman with any of these characteristics would make them feel very satisfied.
“Selecting a woman of color is more about cementing core Democratic support Biden already has than it is about winning over remaining stragglers from the primaries. But what it means for Democrats who don’t vote in primaries as well as for independents is another question entirely,” said Murray.
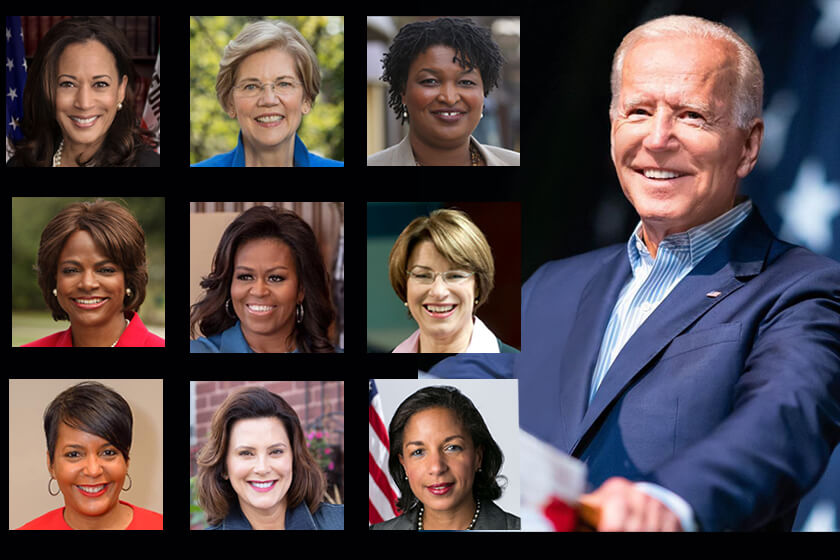
When asked to name their preferred choice for Biden’s running mate – knowing the candidate already narrowed it down to a woman – the panel participants gravitate toward one of the women who ran in the presidential contest. The leading favorites are Kamala Harris (28%), Warren (13%) and Klobuchar (12%). Another 1% name Gabbard and a single voter even mentioned Marianne Williamson.
Among non-presidential candidates, former Georgia legislator and gubernatorial candidate Stacey Abrams (10%) and Florida Congresswoman Val Demings (7%) should be top contenders according to Democratic primary voters. Other women named by panel participants include former First Lady Michelle Obama (3%), former National Security Adviser Susan Rice (2%), Atlanta Mayor Keisha Lance Bottoms (2%), and Michigan Governor Gretchen Whitmer (2%). Two percent name another woman of color and 2% name another white woman.
Overall, a majority of voters name a woman of color as their preferred choice for Biden’s running mate. Harris is a top pick regardless of who voters supported in the primaries and caucuses. She is named by 33% of Biden voters and 33% of Buttigieg voters, as well as 28% of Warren voters (compared to 38% who would pick Warren herself) and 27% of Klobuchar voters (compared to 29% who would pick Klobuchar herself). Among Sanders voters, 22% name Warren as their top choice for vice president, 18% name Harris, and 11% name Abrams. Also, among those voters who had earlier supported Harris before she dropped out of the race, 68% name their initial presidential choice as their top contender for the number two spot. Harris is even the top pick of former Mike Bloomberg supporters (33%). The only group she does not make a strong showing with are former supporters of Gabbard and Yang. Many of these voters give no answer or in fact name a man (13% of Yang supporters and 10% of Gabbard supporters), even though Biden has made it clear this is not a possibility.
QUESTIONS REFERENCED IN THIS RELEASE
If the election for President was today, who would you vote for?
- Donald Trump the Republican
- Joe Biden the Democrat
- Another candidate
- Will not vote for president
- Not sure
If the election for U.S. House of Representatives was held today, who would you vote for in your Congressional district?
- Republican candidate
- Democratic candidate
- Other candidate
- Will not vote for Congress
- Not sure
Did you vote in your state’s Democratic presidential primary or caucus earlier this year?
- Yes
- No
- Do not recall
Regardless of who you might support in the presidential race now, who did you actually vote for in your state’s primary or caucus?
- Joe Biden
- Bernie Sanders
- Elizabeth Warren
- Pete Buttigieg
- Amy Klobuchar
- Mike Bloomberg
- Tom Steyer
- Andrew Yang
- Tulsi Gabbard
- Other candidate: _____________
- Do not recall
What best describes your feelings about Joe Biden as the likely Democratic nominee?
- Enthusiastic
- Satisfied
- Dissatisfied
- Upset
- Neutral, not sure
Do you approve or disapprove of Bernie Sanders’s decision to endorse Joe Biden?
- Approve
- Disapprove
- Neither, don’t care either way
- Not sure
Do you think the Democratic Party should stick with Joe Biden as the nominee, or should the delegates at the convention be able to choose a different nominee?
- Stick with Biden
- Choose another nominee
- Not sure
Joe Biden announced he will select a woman as his running mate. All other things being equal, how would you feel if he chose someone from any of the following backgrounds?
A. Black woman / B. Latina woman / C. Asian woman / D. White woman / E. Muslim woman
- Very satisfied
- Somewhat satisfied
- Not satisfied
- Does not matter
- Not sure
All other things being equal, how would having a woman of color affect the Democratic ticket’s chances for victory in November?
- Would be more likely to win
- Would be less likely to win
- No impact either way
- Not sure
Who would be your top pick for Biden’s running mate? ___________________________
METHODOLOGY
The Monmouth University Poll was sponsored and conducted by the Monmouth University Polling Institute. The results described in this release are based on 2,240 online interviews, conducted June 1-9, 2020, with voters who previously participated in state-specific Democratic presidential nomination polls either by telephone or online from April 2019 through March 2020. Monmouth sent panel invitations to 6,923 voters for whom it had valid email addresses, resulting in a 32% response rate. Information about the methodology for each of the individual primary or caucus polls can be found on Monmouth’s website. This panel sample represents a cross-section of Democratic primary voters and caucusgoers, but it is not a probability sample of the entire Democratic primary electorate this year. There is no margin of error calculated for this sample because results cannot be statistically projected onto a larger population. The main value of the study is in the measurement of individual-level change based on pre-election candidate support. Three-quarters of the panel sample come from three states that held contests early in the nomination process and is skewed more heavily toward voters who are older, college-educated, and white.
| STATE | DEMOGRAPHICS (unweighted) | |
| 31% Iowa | Party Self-Report | 13% 18-49 |
| 26% New Hampshire | 1% Republican | 32% 50-64 |
| 17% South Carolina | 67% Democrat | 55% 65+ |
| 11% Virginia | 32% Neither | |
| 6% California | 90% White, non-Latino | |
| 5% Nevada | 19% Very liberal | 6% Black |
| 4% Michigan | 41% Somewhat liberal | 2% Latino |
| 1% Arizona | 36% Moderate | 1% Asian |
| 4% Conservative | 1% Other | |
| 51% Male | 26% No college degree | |
| 49% Female | 74% 4-year college degree | |
Click on pdf file link below for full methodology and crosstabs by key demographic groups.