West Long Branch, NJ – Trump voters in New Hampshire are more motivated and more committed when compared with those who back other Republican candidates for president. A Monmouth (“Mon-muth”) University-Washington Post Poll of potential GOP primary voters in the state shows support for the party’s nomination is almost evenly divided between former President Donald Trump and the rest of the field, but with much different levels of enthusiasm. Despite New Hampshire’s reputation for providing an up close and personal test for aspiring presidents, fewer than 1 in 5 voters have had an opportunity to meet any of the current candidates.
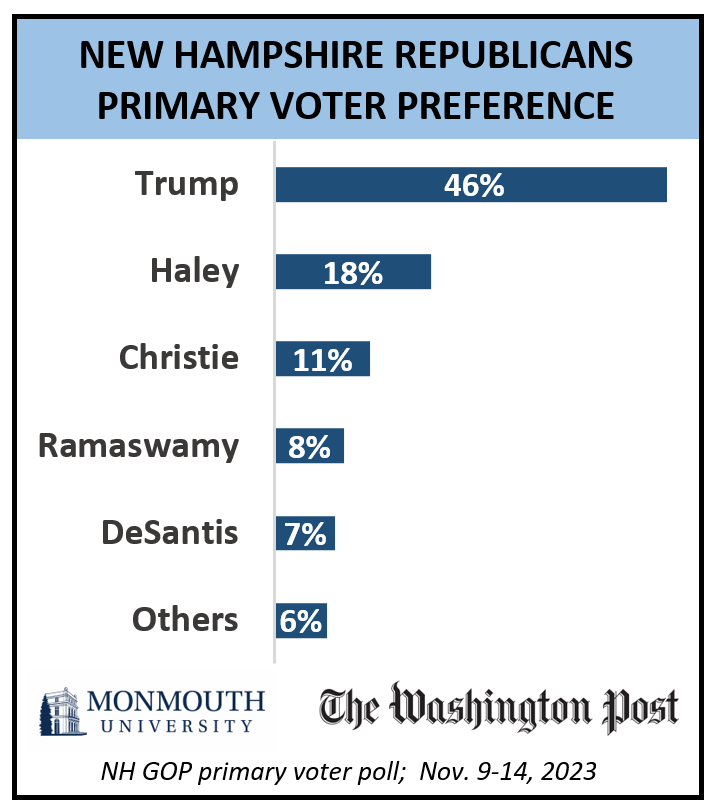
When asked who they would vote for in the January Republican presidential primary, 46% of potential voters choose Trump. The rest of the field trails far behind, including Nikki Haley (18%), Chris Christie (11%), Vivek Ramaswamy (8%), and Ron DeSantis (7%). Among potential GOP primary voters without a college degree, 57% back Trump, while college graduates split their support between Trump (32%) and Haley (29%). The differences in vote choice by gender and age are not statistically significant.
Trump voters (78%) are much more likely than other candidates’ supporters (51%) to say they are extremely motivated to vote in the primary. They are also less likely to consider a second choice (18%, compared with 51% of other voters) according to the poll conducted jointly by Monmouth University and the Washington Post.
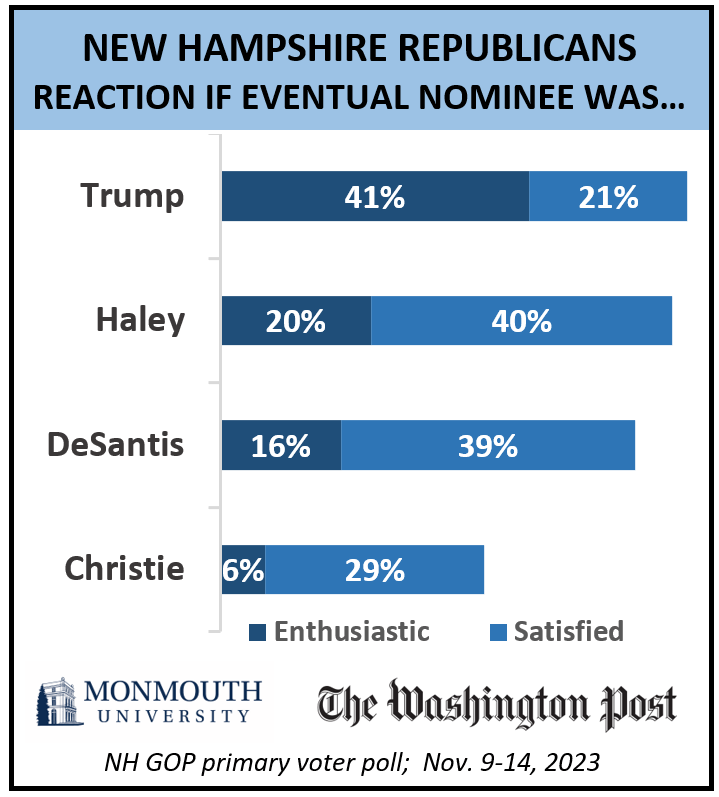
Trump (59% favorable and 36% unfavorable) and Haley (56% favorable and 31% unfavorable) receive similar personal ratings from the potential primary electorate. About 6 in 10 voters would essentially be okay with either one as the party’s eventual nominee. However, there is more outright enthusiasm for the idea of Trump (41%) as the Republican standard-bearer, than there is for Haley (20%). In a poll taken by Monmouth University shortly before the 2016 New Hampshire primary, just 26% of GOP primary voters were enthusiastic about the prospect of Trump becoming the party’s nominee, while another 30% said they would be satisfied with that outcome. At the other end of the spectrum, 23% of potential 2024 primary voters would be upset if Trump became the Republican nominee, which is nearly identical to the number who said the same back in 2016 (25%). Among supporters of other candidates in the current poll, just 27% would feel enthusiastic or satisfied with Trump as the nominee, while 68% say the same about the idea of Haley as the party’s pick. Still, only 29% of this group would actually be enthusiastic about Haley. By comparison, fully 80% of intended Trump voters express enthusiasm about their candidate winning the nomination.
“The enthusiasm gap between Trump supporters and other New Hampshire primary voters is better described as a chasm. Even though Haley is well-regarded, she just doesn’t spark the kind of emotional connection that helps the former president maintain his base’s loyalty,” said Patrick Murray, director of the independent Monmouth University Polling Institute.
A little over half of New Hampshire Republican primary voters would be either enthusiastic (16%) or satisfied (39%) if DeSantis became the nominee, while just over one-third feel the same about Christie (6% enthusiastic and 29% satisfied). This marks a significant drop for Christie since his first run in 2016, when a majority (56%) were at least satisfied with the idea of him becoming the Republican nominee and only 15% said they would be upset (compared with 32% now). DeSantis has a personal rating of 47% favorable and 40% unfavorable among the state’s GOP primary electorate while Christie has a net negative rating of just 29% favorable and 60% unfavorable.
The poll also finds that Trump voters are concerned about a wider range of issues than other voters. Large majorities of Trump voters see the following as extremely important: illegal immigration (80%), the Justice Department being used for political purposes (72%), inflation (71%), government debt (65%), government invasion of privacy (63%), crime (63%), parents’ rights (62%), and gun rights (59%). Supporters of other candidates are less likely to see any of these issues as critical, with only inflation (46%), and illegal immigration (41%) registering as extremely important with more than 4 in 10 of these voters. Across the board, New Hampshire primary voters are much less likely to see the Israel-Gaza war (32%) and abortion (27%) as extremely important regardless of who they are supporting in the presidential primary.
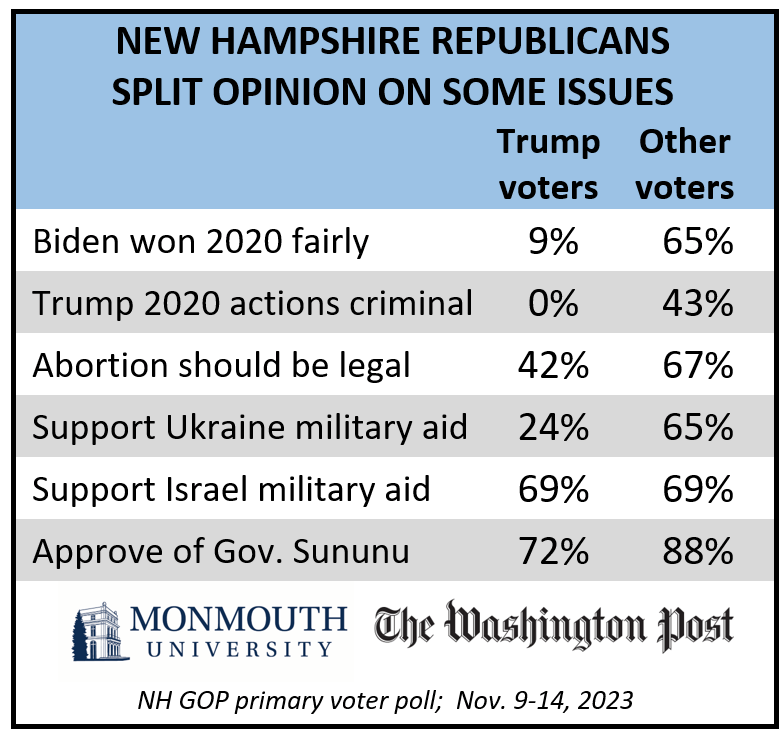
There are substantial differences between Trump supporters and those who back other candidates when it comes to a range of concerns. Trump voters (42%) are much less likely than supporters of other candidates (67%) to say abortion should be legal in most or all cases. Trump backers (24%) are also less likely than other primary voters (65%) to support providing more military aid to Ukraine, although there is no difference in doing the same for Israel (69% for each group).
Looking back at the 2020 election, very few Trump voters say that Biden won fairly (9%, compared with 65% of other candidates’ backers) and they are also much less likely to say Trump engaged in criminal activity in his response to that election (0% compared with 43% among other voters). Overall, 22% of potential New Hampshire Republican primary voters say Trump actually committed a crime, while 29% say he did something wrong although not criminal, and 45% said he did nothing wrong.
In other poll findings, 17% of New Hampshire Republican primary voters have met one of the candidates running for president in either party. In comparison, a poll conducted by Monmouth a month before the 2016 primary put that number at 41%, although it had been a much lower 15% the prior July.
“The meet-and-greet portion of the campaign will pick up steam in the next few weeks, although it seems unlikely to be as much of a hands-on experience as we saw in 2016,” said Murray.
The current poll also finds that about half of the potential Republican primary electorate gets information from Fox News, with Trump voters (62%) being more likely than other candidates’ supporters (40%) to do this at least sometimes. Newsmax is a lesser used news source, but is still more likely to be used by Trump supporters (41%) than other voters (16%). Just over 1 in 4 New Hampshire GOP primary voters rely on social media sites for news, although there is not much difference between Trump backers (28%) and other voters (31%) in the use of this source.
The Monmouth University-Washington Post Poll was conducted by telephone and online from November 9 to 14, 2023 with 606 potential Republican presidential primary voters in New Hampshire. The question results in this release have a margin of error of +/- 4.5 percentage points for this sample. The poll was conducted jointly by the Monmouth University Polling Institute and the Washington Post.
QUESTIONS AND RESULTS
(* Some columns may not add to 100% due to rounding.)
1.How closely are you following the race for the 2024 Republican presidential nomination?
| Response: | Nov. 2023 |
|---|---|
| Very closely | 52% |
| Somewhat closely | 34% |
| Not too closely | 10% |
| Not at all closely | 4% |
| (VOL) Don’t know | 0% |
| (n) | (606) |
2.How likely are you to vote in New Hampshire’s primary for president in January – are you absolutely certain to vote, will you probably vote, are the chances 50-50, or less than that?
| Response: | Nov. 2023 |
|---|---|
| Absolutely certain to vote | 88% |
| Will probably vote | 9% |
| Chances are 50-50 | 3% |
| Less than that | n/a |
| (n) | (606) |
3.How motivated are you to vote in the Republican presidential primary?
| Response: | Nov. 2023 |
|---|---|
| Extremely motivated | 63% |
| Very motivated | 23% |
| Somewhat motivated | 12% |
| Not motivated | 2% |
| (n) | (606) |
4.I’m going to read you the names of candidates running for president in the Republican Party. Please tell me if your general impression of each is favorable or unfavorable, or if you don’t really have an opinion. If you have not heard of the person, just let me know. First, [READ NAME]. [NAMES WERE ROTATED]
| Response: | Favorable | Unfavorable | No opinion | Not heard of | (VOL) No answer | (n) |
|---|---|---|---|---|---|---|
| Former President Donald Trump | 59% | 36% | 4% | 0% | 1% | (606) |
| Florida Governor Ron DeSantis | 47% | 40% | 11% | 0% | 2% | (606) |
| Former South Carolina Governor and U.N. Ambassador Nikki Haley | 56% | 31% | 8% | 2% | 2% | (606) |
| Business entrepreneur Vivek Ramaswamy | 40% | 40% | 14% | 4% | 2% | (606) |
| South Carolina Senator Tim Scott | 47% | 24% | 22% | 5% | 2% | (606) |
| Former Arkansas Governor Asa Hutchinson | 11% | 38% | 31% | 18% | 2% | (606) |
| Former New Jersey Governor Chris Christie | 29% | 60% | 7% | 1% | 2% | (606) |
| North Dakota Governor Doug Burgum | 23% | 25% | 30% | 19% | 3% | (606) |
5.If the Republican primary for president was held today, for which one of the following candidates would you cast your vote? [NAMES WERE ROTATED]
| Response: | Nov. 2023 |
|---|---|
| Donald Trump | 46% |
| Ron DeSantis | 7% |
| Nikki Haley | 18% |
| Vivek Ramaswamy | 8% |
| Tim Scott* | 3% |
| Asa Hutchinson | 1% |
| Chris Christie | 11% |
| Doug Burgum | 2% |
| (VOL) Someone else | 0% |
| (VOL) Don’t know | 4% |
| (n) | (606) |
6.Are you definitely supporting [READ NAME FROM Q5] to be the Republican Party’s nominee, or would you consider supporting another candidate? [CHOICES WERE ROTATED]
| Response: | Nov. 2023 |
|---|---|
| Definitely supporting | 59% |
| Would consider another candidate | 33% |
| (VOL) Don’t know | 3% |
| No first choice (from Q5) | 4% |
| (n) | (606) |
7.Who would be your second choice? [If “DEFINITELY SUPPORTING” FIRST CHOICE, ASK:] If [NAME FROM Q5] decides to drop out of the race before the New Hampshire primary, who would be your second choice?
| Response: | Nov. 2023 |
|---|---|
| Donald Trump | 8% |
| Ron DeSantis | 20% |
| Nikki Haley | 17% |
| Vivek Ramaswamy | 11% |
| Tim Scott* | 8% |
| Asa Hutchinson | 3% |
| Chris Christie | 9% |
| Doug Burgum | 3% |
| (VOL) No one | 9% |
| (VOL) Someone else | 2% |
| (VOL) Would not vote | 1% |
| (VOL) Don’t know | 4% |
| No first choice (from Q5) | 4% |
| (n) | (606) |
8.How would you feel if [READ NAME] became the Republican nominee – enthusiastic, satisfied, dissatisfied, or upset? [NAMES WERE ROTATED]
Donald Trump
| Comparison: | Nov. 2023 | Jan. 2016* |
|---|---|---|
| Enthusiastic | 41% | 26% |
| Satisfied | 21% | 30% |
| Dissatisfied | 14% | 17% |
| Upset | 23% | 25% |
| (VOL) Don’t know | 2% | 2% |
| (n) | (606) | (414) |
Nikki Haley
| Response: | Nov. 2023 |
|---|---|
| Enthusiastic | 20% |
| Satisfied | 40% |
| Dissatisfied | 21% |
| Upset | 14% |
| (VOL) Don’t know | 5% |
| (n) | (606) |
Ron DeSantis
| Response: | Nov. 2023 |
|---|---|
| Enthusiastic | 16% |
| Satisfied | 39% |
| Dissatisfied | 25% |
| Upset | 17% |
| (VOL) Don’t know | 3% |
| (n) | (606) |
Chris Christie
| Comparison: | Nov. 2023 | Jan. 2016* |
|---|---|---|
| Enthusiastic | 6% | 9% |
| Satisfied | 29% | 47% |
| Dissatisfied | 29% | 27% |
| Upset | 32% | 15% |
| (VOL) Don’t know | 4% | 2% |
| (n) | (606) | (414) |
9.. Have you had the opportunity to meet or see any of the Republican or Democratic candidates for president in person this year, or not?
| Comparison: | Nov. 2023 | Jan.. 2016* | July 2015* |
|---|---|---|---|
| Yes | 17% | 41% | 15% |
| No | 83% | 59% | 85% |
| (VOL) Don’t know | 1% | n/a | n/a |
| (n) | (606) | (414) | (467) |
9A.Which ones? [LIST WAS NOT READ] [Multiple responses were accepted.]
| Response: | Nov. 2023 |
|---|---|
| Donald Trump | 6% |
| Ron DeSantis | 3% |
| Nikki Haley | 5% |
| Vivek Ramaswamy | 6% |
| Tim Scott | 1% |
| Asa Hutchinson | 1% |
| Chris Christie | 3% |
| Doug Burgum | 1% |
| Mike Pence | 1% |
| Will Hurd | 0% |
| Robert F. Kennedy Jr. (I) | 1% |
| Marianne Williamson (D) | 0% |
| (VOL) Don’t know | 1% |
| Not met any candidates (from Q9) | 83% |
| (n) | (606) |
10.How satisfied are you with the Republican leaders in Congress – are you very satisfied, somewhat satisfied, somewhat dissatisfied, or very dissatisfied?
| Comparison: | Nov. 2023 | Sept. 2015* |
|---|---|---|
| Very satisfied | 5% | 2% |
| Somewhat satisfied | 31% | 31% |
| Somewhat dissatisfied | 29% | 33% |
| Very dissatisfied | 34% | 33% |
| (VOL) Don’t know | 2% | 1% |
| (n) | (606) | (415) |
11.I am going to read you a number of issues facing the country. For each one, please tell me if you feel it is extremely important, very important, just somewhat important, or not important? First, [READ ITEM]… [ITEMS WERE ROTATED]
| Response: | Extremely important | Very important | Just somewhat important | Not important | (VOL) Don’t know | (n) |
|---|---|---|---|---|---|---|
| Inflation and rising prices | 58% | 29% | 12% | 1% | 0% | (606) |
| Government debt | 50% | 31% | 15% | 3% | 1% | (606) |
| Illegal immigration | 59% | 22% | 13% | 5% | 0% | (606) |
| Crime | 44% | 33% | 19% | 3% | 1% | (606) |
| Abortion | 27% | 23% | 29% | 20% | 1% | (606) |
| Gun rights | 44% | 26% | 19% | 10% | 1% | (606) |
| The Justice Department being used for political purposes | 53% | 22% | 11% | 12% | 2% | (606) |
| Government invasion of privacy | 47% | 27% | 17% | 7% | 1% | (606) |
| Parents’ rights | 44% | 29% | 17% | 8% | 2% | (606) |
| The Israel-Gaza war | 32% | 35% | 23% | 9% | 1% | (606) |
12.And which of the following issues is the most important facing the country? [RESPONDENT WAS SHOWN ISSUES IN Q11 SELECTED AS “Extremely Important”.]
| Response: | Nov. 2023 |
|---|---|
| Inflation and rising prices | 20% |
| Government debt | 6% |
| Illegal immigration | 25% |
| Crime | 1% |
| Abortion | 7% |
| Gun rights | 4% |
| The Justice Department being used for political purposes | 10% |
| Government invasion of privacy | 3% |
| Parents’ rights | 2% |
| The Israel-Gaza war | 3% |
| No issues extremely important [from Q11] | 16% |
| (VOL) Don’t know | 4% |
| (n) | (606) |
13.Do you think abortion should be: legal in all cases, legal in most cases, illegal in most cases, or illegal in all cases? [CHOICES WERE READ IN REVERSE ORDER FOR A RANDOM HALF SAMPLE]
| Response: | Nov. 2023 |
|---|---|
| Legal in all cases | 14% |
| Legal in most cases | 41% |
| Illegal in most cases | 32% |
| Illegal in all cases | 8% |
| (VOL) Don’t know | 5% |
| (n) | (606) |
[QUESTIONS 14 & 15 WERE ROTATED]
14.Would you support or oppose the U.S. providing additional arms and military supplies to support Ukraine in its war with Russia?
| Response: | Nov. 2023 |
|---|---|
| Support | 46% |
| Oppose | 51% |
| (VOL) Don’t know | 3% |
| (n) | (606) |
15.Would you support or oppose the U.S. providing additional arms and military supplies to support Israel in its war with Hamas?
| Response: | Nov. 2023 |
|---|---|
| Support | 69% |
| Oppose | 28% |
| (VOL) Don’t know | 3% |
| (n) | (606) |
16.Do you believe Joe Biden won the 2020 election fair and square, or do you believe that he only won it due to voter fraud?
| Response: | Nov. 2023 |
|---|---|
| Fair and square | 38% |
| Due to voter fraud | 55% |
| (VOL) Don’t know | 6% |
| (n) | (606) |
17.In his response to the 2020 presidential election, do you think Donald Trump committed a crime, did something wrong but not criminal, or did nothing wrong? [CHOICES WERE READ IN REVERSE ORDER FOR A RANDOM HALF SAMPLE]
| Response: | Nov. 2023 |
|---|---|
| Committed a crime | 22% |
| Did something wrong but not criminal | 29% |
| Did nothing wrong | 45% |
| (VOL) Don’t know | 3% |
| (n) | (606) |
18.Do you approve or disapprove of the way Chris Sununu is handling his job as governor of New Hampshire? [Do you approve/disapprove strongly or somewhat?]
| Response: | Nov. 2023 |
|---|---|
| Approve strongly | 44% |
| Approve somewhat | 37% |
| Disapprove somewhat | 10% |
| Disapprove strongly | 7% |
| (VOL) Don’t know | 2% |
| (n) | (606) |
19.Would you be [more likely] or [less likely] to vote for a Republican presidential primary candidate who has been endorsed by Governor Sununu, or would that make no difference in your vote? [FIRST TWO CHOICES ROTATED]
| Response: | Nov. 2023 |
|---|---|
| More likely | 14% |
| Less likely | 5% |
| No difference | 80% |
| (VOL) Don’t know | 0% |
| (n) | (606) |
20.How frequently do you get news or information from [READ ITEM] – often, sometimes, rarely, or never? [ITEMS WERE ROTATED]
Fox News
| Response: | Nov. 2023 |
|---|---|
| Often | 26% |
| Sometimes | 25% |
| Rarely | 19% |
| Never | 29% |
| (VOL) Don’t know | 0% |
| (n) | (606) |
Newsmax
| Response: | Nov. 2023 |
|---|---|
| Often | 12% |
| Sometimes | 15% |
| Rarely | 15% |
| Never | 55% |
| (VOL) Don’t know | 2% |
| (n) | (606) |
Joe Rogan’s podcast
| Response: | Nov. 2023 |
|---|---|
| Often | 5% |
| Sometimes | 15% |
| Rarely | 16% |
| Never | 63% |
| (VOL) Don’t know | 1% |
| (n) | (606) |
A social media site such as Facebook or Reddit
| Response: | Nov. 2023 |
|---|---|
| Often | 13% |
| Sometimes | 16% |
| Rarely | 18% |
| Never | 52% |
| (VOL) Don’t know | 1% |
| (n) | (606) |
METHODOLOGY
The Monmouth University-Washington Post Poll was conducted from November 9 to 14, 2023, among a probability-based sample of 841 New Hampshire voters who are either registered with the Republican Party or are undeclared. The poll was conducted in English, and included 254 live landline telephone interviews, 241 live cell phone interviews, and 346 online surveys via a cell phone text invitation. Interviewing services were provided by Braun Research using telephone numbers randomly selected from a list of voters obtained from Aristotle. The full sample is weighted for region, age, gender and race based on the voter list and education based on US Census information (CPS and ACS one-year surveys). Results released from this poll are based on a sub-set of 606 voters who indicated they have a 50-50 chance or better of voting in the 2024 Republican presidential primary. For this sample, one can say with 95% confidence that the error attributable to sampling has a maximum margin of plus or minus 4.5 percentage points adjusted for sample design effects (1.29). Sampling error can be larger for sub-groups (see table below). In addition to sampling error, one should bear in mind that question wording and practical difficulties in conducting surveys can introduce error or bias into the findings of opinion polls. The Monmouth University Polling Institute and the Washington Post jointly sponsored and conducted this poll, and are responsible for all aspects of the questionnaire and sample design as well as weighting and data analysis.
Potential primary voter demographics (weighted)
Party ID (self-reported): 37% strong Rep., 46% soft or lean Rep., 17% Ind. or Dem.
Ideology: 32% very conservative, 38% somewhat conservative, 31% moderate, liberal
Sex: 55% male, 45% female
Race: 94% White, 1% Black, 2% Hispanic, 2% Asian/Other
Age: 12% 18-34, 20% 35-49, 34% 50-64, 34% 65+
Education: 27% high school or less, 31% some college, 24% 4-year degree, 17% advanced degree
Voted in 2016 GOP primary: 55% yes, 45% no
Income: 23% <$50K, 34% $50 to <$100K, 43% $100K+
Trump 2016 primary share (county): 34% above average, 33% average (35-36%), 33% below average
Evangelical: 22% yes, 78% no
MAGA supporter: 49% yes, 51% no
Click on pdf file link below for full methodology and crosstabs by key demographic groups.