
West Long Branch, NJ – Voter support for incumbent Gov. Brian Kemp has increased over the past month, while support levels for challenger Stacey Abrams have remained static. The Monmouth (“Mon-muth”) University Poll finds that only 4 in 10 Georgia voters see Kemp as a strong supporter of former President Donald Trump, whereas nearly twice as many see Abrams as a strong supporter of President Joe Biden. Kemp’s apparent distancing from Trump does not hurt him at all with Trump’s base while it helps him somewhat with the former president’s detractors.
More than half of Georgia’s potential electorate will either definitely (44%) or probably (11%) vote to reelect Kemp in November. His definite support number increased by 10 points since September. Just over 4 in 10 voters will definitely (35%) or probably (8%) back Abrams, which is basically unchanged from last month. Half of the voters polled have definitely ruled out voting for Abrams (50%) compared with only one-third who say the same about Kemp (35%). Kemp has a net positive personal rating of 59% favorable to 39% unfavorable, while Abrams holds a split rating of 47% favorable to 50% unfavorable.
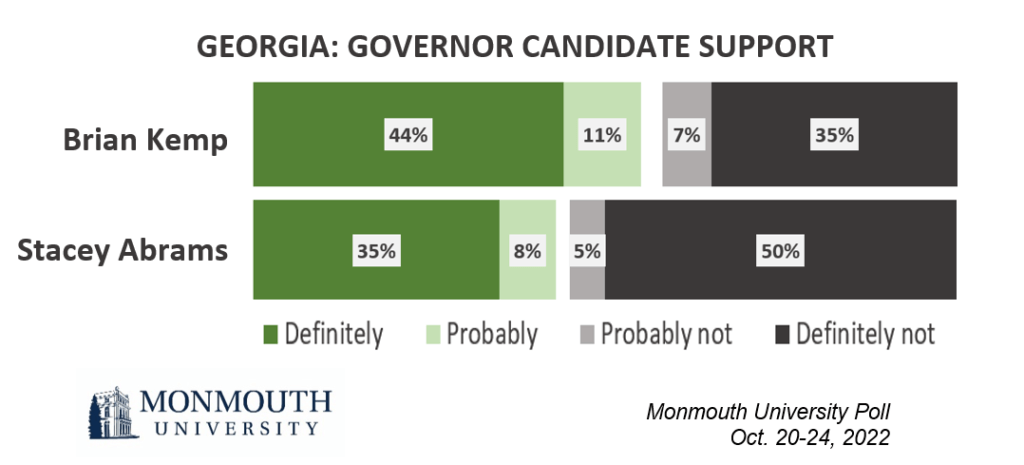
“Kemp’s support has clearly solidified in the past month while Abrams has been in a holding pattern,” said Patrick Murray, director of the independent Monmouth University Polling Institute.
The poll finds that 77% of Georgia voters say Abrams is a strong supporter of President Biden, but only 39% see Kemp as a strong supporter of former President Trump. This is a sharp contrast with views of the two candidates in the U.S. Senate contest, where both are seen as strong supporters of their respective party’s putative leaders (77% for Walker and 82% for Warnock).
Last month, Kemp had weaker support among the Republican base than he does now – 73% definite in September compared with 86% in October. By comparison, Abrams’ definite Democratic support is an identical 83% in both polls. Among voters who hold a favorable opinion of Trump in the current poll, there is no difference in support levels for Kemp regardless of whether they see him as a strong supporter of the former president (81% definite and 15% probable) or not (81% definite and 14% probable). Furthermore, among voters with an unfavorable opinion of Trump, Kemp does better among those who seem him as distanced from the former president (25% definite and 9% probable) than those who see him as a strong Trump supporter (7% definite and 5% probable).
“I said last month, that some election conspiracists may be nursing a grudge against Kemp for not stepping in to overturn the 2020 result, but they were likely to come home in the end. That looks to be the case with the added bonus that Kemp distancing himself from Trump is a plus among some independent voters,” said Murray.
Overall, 60% of voters say Kemp’s political views are in line with most Georgia residents. Less than half (44%) say the same about Abrams. Voters choose jobs, the economy and cost of living (43%) from a list of seven policy areas as the top issue on their minds in the race for governor. Kemp (53%) has a clear advantage over Abrams (35%) on being more trusted to handle this issue. The incumbent also holds a similar issue edge on dealing with crime (52% to 34% for Abrams). The only issue among seven asked about in the poll where Abrams has a nominal lead is abortion (46% to 40% for Kemp).
The poll does not attempt to predict turnout, but past voter history metrics and self-reported motivation give a picture of a range of possible outcomes. Among voters who participated in the first matchup between these two candidates in 2018 – which was decided by just over one percentage point – more than half definitely (44%) or probably (10%) support Kemp while fewer definitely (37%) or probably (7%) support Abrams. Support levels among “extremely motivated” voters in the current electorate show a similar advantage for Kemp (49% definite and 6% probable) over Abrams (39% definite and 5% probable).
One in 4 potential voters have already cast their ballots in this election. These voters back Abrams (52%) over Kemp (46%) by a narrow margin. This contrasts with Monmouth’s U.S. Senate poll released yesterday, where Democrat Raphael Warnock (61%) had a large advantage over Republican Herschel Walker (34%) in the early vote. Other voters who intend to vote during Georgia’s early voting period are evenly divided between Kemp (38% definite and 13% probable) and Abrams (37% definite and 12% probable). The Republican, though, has a clear edge among those who plan to vote on Election Day – 51% definite and 17% probable compared with just 21% definite and 9% probable for Abrams. Taken together, 8% of the electorate is comprised of crossover Warnock-Kemp voters, while only 1% support a split Walker-Abrams ticket.
The poll also finds that most voters express at least some confidence the Georgia election will be conducted fairly and accurately this year – 35% very confident and 40% somewhat confident. Democrats (41%) are more likely than Republicans (30%) to feel very confident about this.
The Monmouth University Poll was conducted by telephone from October 20 to 24, 2022 with 615 Georgia registered voters. The question results in this release have a margin of error of +/- 5.0 percentage points for the full sample. The poll was conducted by the Monmouth University Polling Institute in West Long Branch, NJ.
QUESTIONS AND RESULTS
(* Some columns may not add to 100% due to rounding.)
[Q1-11 previously released.]
12/13.I am going to read you a list of candidates running for Governor in Georgia this year. For each one, please tell me if you have definitely heard of them, not sure if you’ve heard of them, or if you’ve definitely not heard of them?
[If DEFINITELY HEARD OF:] For each of the following, please tell me if you have a very favorable, somewhat favorable, somewhat unfavorable, or very unfavorable opinion of them. [NAMES WERE ROTATED]
| TREND: | Very favorable | Somewhat favorable | Somewhat unfavorable | Very unfavorable | Heard of, no opinion (VOL) | Not sure if heard of | Definitely not heard of | (n) |
| Brian Kemp, the Republican | 36% | 23% | 14% | 25% | 1% | 0% | 1% | (615) |
| — Sept. 2022 | 28% | 26% | 15% | 27% | 2% | 1% | 1% | (601) |
| Stacey Abrams, the Democrat | 33% | 14% | 6% | 44% | 2% | 0% | 1% | (615) |
| — Sept. 2022 | 33% | 15% | 7% | 41% | 3% | 1% | 1% | (601) |
| Shane Hazel, the Libertarian | 1% | 8% | 6% | 4% | 5% | 7% | 69% | (615) |
| — Sept. 2022 | 1% | 3% | 2% | 2% | 4% | 11% | 77% | (601) |
[QUESTIONS 14 & 15 WERE ROTATED]
14.How likely are you to vote for Brian Kemp in the election for governor – will you definitely vote for him, probably vote for him, probably not vote for him, or definitely not vote for him?
| TREND: | Oct. 2022 | Sept. 2022 |
| Definitely (or already voted for him) | 44% | 34% |
| Probably | 11% | 15% |
| Probably not | 7% | 10% |
| Definitely not (or already voted for someone else) | 35% | 37% |
| (VOL) Don’t know | 3% | 4% |
| (n) | (615) | (601) |
15.How likely are you to vote for Stacey Abrams in the election for governor – will you definitely vote for her, probably vote for her, probably not vote for her, or definitely not vote for her?
| TREND: | Oct. 2022 | Sept. 2022 |
| Definitely (or already voted for her) | 35% | 33% |
| Probably | 8% | 12% |
| Probably not | 5% | 6% |
| Definitely not (or already voted for someone else) | 50% | 46% |
| (VOL) Don’t know | 2% | 3% |
| (n) | (615) | (601) |
16.How likely are you to vote for Shane Hazel in the election for governor – will you definitely vote for him, probably vote for him, probably not vote for him, or definitely not vote for him?
| TREND: | Oct. 2022 |
| Definitely (or already voted for him) | 0% |
| Probably | 5% |
| Probably not | 24% |
| Definitely not (or already voted for someone else) | 65% |
| (VOL) Don’t know | 6% |
| (n) | (615) |
17.Who do you trust more on [READ ITEM] – Brian Kemp, Stacey Abrams, both equally, or neither one? [ITEMS WERE ROTATED] [NAMES WERE ROTATED]
| TREND: | Brian Kemp | Stacey Abrams | Both equally | Neither one | (VOL) Don’t know | (n) |
| Education | 45% | 41% | 6% | 6% | 1% | (615) |
| Gun control | 49% | 40% | 2% | 7% | 2% | (615) |
| Abortion | 40% | 46% | 3% | 9% | 3% | (615) |
| Jobs, the economy and cost of living | 53% | 35% | 6% | 6% | 1% | (615) |
| Health care | 44% | 42% | 4% | 8% | 2% | (615) |
| Crime | 52% | 34% | 6% | 8% | 1% | (615) |
| Elections and voting processes | 46% | 40% | 5% | 8% | 1% | (615) |
18.And which of the issues I just mentioned is most important to you in determining your vote for governor?
| Oct. 2022 | |
| Education | 8% |
| Gun control | 11% |
| Abortion | 14% |
| Jobs, the economy and cost of living | 43% |
| Health care | 5% |
| Crime | 8% |
| Elections and voting processes | 9% |
| (VOL) Don’t know | 2% |
| (n) | (615) |
[QUESTIONS 19 & 20 WERE ROTATED]
19.Are Brian Kemp’s political views in line or out of step with most residents of Georgia?
| Oct. 2022 | |
| In line | 60% |
| Out of step | 32% |
| (VOL) Don’t know | 8% |
| (n) | (615) |
20.Are Stacey Abram’s political views in line or out of step with most residents of Georgia?
| Oct. 2022 | |
| In line | 44% |
| Out of step | 50% |
| (VOL) Don’t know | 6% |
| (n) | (615) |
[QUESTIONS 21 & 22 WERE ROTATED]
21.Would you describe Brian Kemp as a strong supporter of Donald Trump, or not particularly a strong supporter?
| Oct. 2022 | |
| Strong supporter | 39% |
| Not strong | 53% |
| (VOL) Don’t know | 8% |
| (n) | (615) |
22.Would you describe Stacey Abrams as a strong supporter of Joe Biden, or not particularly a strong supporter?
| Oct. 2022 | |
| Strong supporter | 77% |
| Not strong | 16% |
| (VOL) Don’t know | 6% |
| (n) | (615) |
[Q23-26 previously released.]
27.Overall, how confident are you that the election in Georgia will be conducted fairly and accurately – very confident, somewhat confident, not too confident, or not at all confident?
| Oct. 2022 | |
| Very confident | 35% |
| Somewhat confident | 40% |
| Not too confident | 17% |
| Not at all confident | 8% |
| (VOL) Don’t know | 1% |
| (n) | (615) |
[Q28 previously released.]
METHODOLOGY
The Monmouth University Poll was sponsored and conducted by the Monmouth University Polling Institute from October 20 to 24, 2022 with a probability-based random sample of 615 Georgia voters drawn from a list of active registered voters who participated in at least one general election since 2016 or have newly registered since the 2020 election. This includes 151 contacted by a live interviewer on a landline telephone and 464 contacted by a live interviewer on a cell phone, in English. Monmouth is responsible for all aspects of the survey design, data weighting and analysis. The full sample is weighted for party registration, age, gender, race, education, and region based on state voter registration list information and U.S. Census information (CPS 2018 supplement). Data collection support provided by Braun Research (field) and Aristotle (voter sample). For results based on this sample, one can say with 95% confidence that the error attributable to sampling has a maximum margin of plus or minus 5.0 percentage points (adjusted for sample design effects). Sampling error can be larger for sub-groups (see table below). In addition to sampling error, one should bear in mind that question wording and practical difficulties in conducting surveys can introduce error or bias into the findings of opinion polls.
| DEMOGRAPHICS (weighted) |
| REGISTERED VOTERS |
| Party Inferred (primary history) |
| 47% Republican |
| 16% Other/none |
| 36% Democrat |
| Self-Reported Party |
| 36% Republican |
| 38% Independent |
| 27% Democrat |
| 46% Male |
| 54% Female |
| 24% 18-34 |
| 24% 35-49 |
| 27% 50-64 |
| 25% 65+ |
| 62% White, non-Hispanic |
| 30% Black |
| 4% Hispanic |
| 4% Asian/other |
| 66% No degree |
| 34% 4 year degree |
Click on pdf file link below for full methodology and crosstabs by key demographic groups.