West Long Branch, NJ – The race for Georgia governor is close, with incumbent Gov. Brian Kemp claiming slightly more voter support overall. Challenger Stacey Abrams has stronger support among her base, but she also has a lower ceiling of potential support from persuadable voters. The Monmouth (“Mon-muth”) University Poll finds just over one-third of the state’s electorate believe that the 2020 presidential election was stolen. These voters overwhelmingly back Kemp over Abrams.
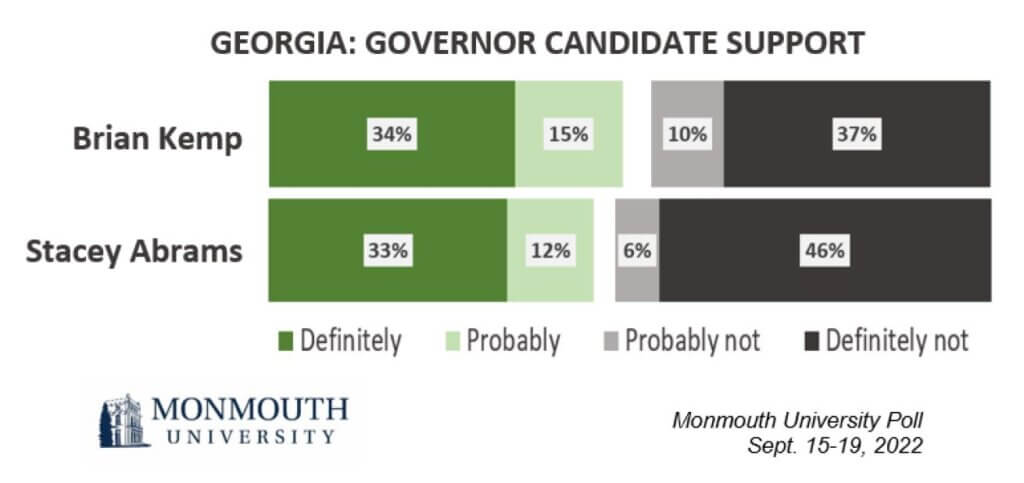
About half of the potential electorate say they will either definitely (34%) or probably (15%) vote to reelect Kemp in November. A slightly smaller number will definitely (33%) or probably (12%) back Abrams. However, more Georgia voters have definitely ruled out voting for Abrams (46%) than say the same about Kemp (37%). Among white voters, 65% have definitely ruled out Abrams. Among Black voters, 69% have definitely ruled out Kemp.
“Abrams has a much narrower path to victory since her potential support appears to be capped at a lower level than Kemp,” said Patrick Murray, director of the independent Monmouth University Polling Institute.
Kemp has a net positive personal rating of 54% favorable to 42% unfavorable, while Abrams holds a split rating of 48% favorable to 48% unfavorable. About 1 in 5 voters do not have a clearly favorable opinion of one candidate over the other. Among this “up for grabs” group, Abrams actually performs slightly stronger than Kemp – 40% say they will definitely or probably vote for the challenger while 32% say the same about the incumbent.
Abrams also has slightly stronger support among her partisan base – 83% of Democrats will definitely vote for her – than Kemp has among his base – 73% of Republicans say they will definitely back him. This could be related to the role Kemp played in the 2020 presidential election. Just over one-third (35%) of Georgia voters erroneously believe that Joe Biden’s 2020 victory over Donald Trump was due only to voter fraud. Among these voters, 67% say they will definitely back Kemp and 23% will probably vote for him in this year’s election for governor. Only 4% of this group have definitely ruled out supporting Kemp, but 87% say they definitely will not vote for Abrams in November.
“Some election conspiracists may still hold a grudge against Kemp for not stepping in to overturn the 2020 result, but it’s unlikely to cost him much support. They may not be enthusiastic, but they’ll still vote for him over Abrams,” said Murray.
Looking ahead to 2024, just under half (45%) of Georgia voters are likely to back Trump at this stage while a little more than a third (37%) are ready to support Biden. Conversely, 44% have definitely ruled out a vote for Trump while a majority (51%) say the same about Biden.
Recent U.S. Supreme Court cases on abortion and guns have thrown these issues into the spotlight in state races. Currently, 51% of Georgia voters say that the state’s current abortion laws are too strict. Just 12% say they are not strict enough and 25% say they are about right. Another 11% have no opinion. The public is divided on Georgia’s gun ownership laws, with 46% saying they are about right and 44% saying they are not strict enough. Just 5% say they are too strict and 5% have no opinion on the state’s current gun laws.
“Among the issues facing the country, only 14% of Georgia voters name abortion and just 3% mention guns as a top concern. These are hot button issues that motivate Democrats, but that number may not be large enough to help Abrams in this race,” said Murray.
The Monmouth University Poll was conducted by telephone from September 15 to 19, 2022 with 601 Georgia registered voters. The question results in this release have a margin of error of +/- 4.0 percentage points. The poll was conducted by the Monmouth University Polling Institute in West Long Branch, NJ.
QUESTIONS AND RESULTS
(* Some columns may not add to 100% due to rounding.)
[Q1-10 previously released.]
11/12.I am going to read you a list of candidates running for Governor in Georgia this year. For each one, please tell me if you have definitely heard of them, not sure if you’ve heard of them, or if you’ve definitely not heard of them?
[If DEFINITELY HEARD OF:] For each of the following, please tell me if you have a very favorable, somewhat favorable, somewhat unfavorable, or very unfavorable opinion of them. [NAMES WERE ROTATED]
| Very favorable | Somewhat favorable | Somewhat unfavorable | Very unfavorable | Heard of, no opinion (VOL) | Not sure if heard of | Definitely not heard of | (n) | |
| Brian Kemp, the Republican | 28% | 26% | 15% | 27% | 2% | 1% | 1% | (601) |
| Stacey Abrams, the Democrat | 33% | 15% | 7% | 41% | 3% | 1% | 1% | (601) |
| Shane Hazel, the Libertarian | 1% | 3% | 2% | 2% | 4% | 11% | 77% | (601) |
[QUESTIONS 13 & 14 WERE ROTATED]
13.How likely are you to vote for Brian Kemp in the election for governor – will you definitely vote for him, probably vote for him, probably not vote for him, or definitely not vote for him?
| Sept. 2022 | |
| Definitely | 34% |
| Probably | 15% |
| Probably not | 10% |
| Definitely not | 37% |
| (VOL) Don’t know | 4% |
| (n) | (601) |
14.How likely are you to vote for Stacey Abrams in the election for governor – will you definitely vote for her, probably vote for her, probably not vote for her, or definitely not vote for her?
| Sept. 2022 | |
| Definitely | 33% |
| Probably | 12% |
| Probably not | 6% |
| Definitely not | 46% |
| (VOL) Don’t know | 3% |
| (n) | (601) |
15.Do you feel Georgia’s current abortion laws are too strict, not strict enough, or about right?
| Sept. 2022 | |
| Too strict | 51% |
| Not strict enough | 12% |
| About right | 25% |
| (VOL) Don’t know | 11% |
| (n) | (601) |
16.Do you feel Georgia’s current gun ownership laws are too strict, not strict enough, or about right?
| Sept. 2022 | |
| Too strict | 5% |
| Not strict enough | 44% |
| About right | 46% |
| (VOL) Don’t know | 5% |
| (n) | (601) |
[Q17-24 previously released.]
25.Looking back at the 2020 presidential election, do you believe Joe Biden won the 2020 election fair and square, or do you believe that he only won it due to voter fraud?
| Sept. 2022 | |
| Fair and square | 57% |
| Due to voter fraud | 35% |
| (VOL) Don’t know | 8% |
| (n) | (601) |
[QUESTIONS 26 & 27 WERE ROTATED]
26.If Joe Biden runs for president in 2024, would you definitely vote for him, probably vote for him, probably not vote for him, or definitely not vote for him?
| Sept. 2022 | |
| Definitely | 16% |
| Probably | 21% |
| Probably not | 9% |
| Definitely not | 51% |
| (VOL) Don’t know | 3% |
| (n) | (601) |
27.If Donald Trump runs for president in 2024, would you definitely vote for him, probably vote for him, probably not vote for him, or definitely not vote for him?
| Sept. 2022 | |
| Definitely | 26% |
| Probably | 19% |
| Probably not | 8% |
| Definitely not | 44% |
| (VOL) Don’t know | 4% |
| (n) | (601) |
METHODOLOGY
The Monmouth University Poll was sponsored and conducted by the Monmouth University Polling Institute from September 15 to 19, 2022 with a probability-based random sample of 601 Georgia voters drawn from a list of active registered voters who participated in at least one general election since 2016 or have newly registered since the 2020 election. This includes 146 contacted by a live interviewer on a landline telephone and 455 contacted by a live interviewer on a cell phone, in English. Monmouth is responsible for all aspects of the survey design, data weighting and analysis. The full sample is weighted for inferred partisanship based on primary voting history, age, gender, race, education, and region based on state voter registration list information and U.S. Census information (CPS 2018 supplement). Data collection support provided by Braun Research (field) and Aristotle (voter sample). For results based on this sample, one can say with 95% confidence that the error attributable to sampling has a maximum margin of plus or minus 4.0 percentage points (unadjusted for sample design). Sampling error can be larger for sub-groups (see table below). In addition to sampling error, one should bear in mind that question wording and practical difficulties in conducting surveys can introduce error or bias into the findings of opinion polls.
| DEMOGRAPHICS (weighted) |
| REGISTERED VOTERS |
| Party Inferred (primary history) |
| 47% Republican |
| 16% Other/none |
| 37% Democrat |
| Self-Reported Party |
| 34% Republican |
| 36% Independent |
| 30% Democrat |
| 46% Male |
| 54% Female |
| 24% 18-34 |
| 24% 35-49 |
| 27% 50-64 |
| 25% 65+ |
| 62% White, non-Hispanic |
| 30% Black |
| 5% Hispanic |
| 3% Asian/other |
| 66% No degree |
| 34% 4 year degree |
Click on pdf file link below for full methodology and crosstabs by key demographic groups.