
West Long Branch, NJ – Incumbent Sen. Raphael Warnock is viewed more favorably than challenger Herschel Walker, but poor voter opinion of the Democratic Party in Georgia is keeping the race for U.S. Senate close. The Monmouth (“Mon-muth”) University Poll also finds neither candidate has an overwhelming edge on handling the issues that are most important to Georgia voters.
Warnock has a net positive rating of 48% favorable to 44% unfavorable, while Walker has a net negative personal rating of 42% favorable to 48% unfavorable. The two candidates have comparable levels of support in their election contest, although the Democrat has slightly stronger backing. Less than half of Georgia voters say they will either definitely (32%) or probably (13%) vote for Warnock in November and a slightly smaller number will either definitely (26%) or probably (15%) vote for Walker. At the other end of the spectrum, 42% say they will definitely not vote for Warnock and 43% say the same for Walker.
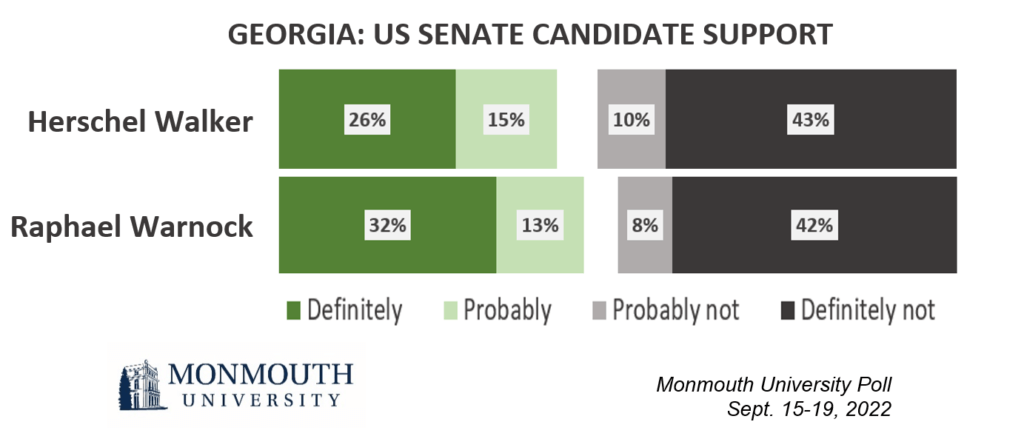
“More voters have definitely ruled out a candidate than are certain to back either Warnock or Walker. That means a sizable group of voters will end up casting ballots for someone they are not sold on, that is if they turn out to vote at all,” said Patrick Murray, director of the independent Monmouth University Polling Institute.
The top issues facing the country according to Georgia voters are the economy (25%) and inflation (36%, plus another 6% who mention gas prices specifically). Other noted concerns include illegal immigration (17%) and abortion (14%). Voter opinion is equally divided on who can better handle the all-important issue of jobs, the economy and cost of living (39% choose Warnock and 37% pick Walker) as well as immigration (37% Warnock and 36% Walker). Warnock has a slight advantage over Walker on being trusted more on defending values (43% to 36%) and the issue of abortion (39% to 30%). Walker has the edge over Warnock when it comes to gun control (40% to 36%).
When asked which set of issues are a bigger factor in their U.S. Senate choice, 56% of Georgia voters point to concerns about the economy and cost of living while 33% are more focused on fundamental rights and the democratic process. Republicans prioritize the economy (74%, to 16% for rights) while Democrats give a nominal preference to fundamental rights (51%) over economic concerns (35%).
There is not a large difference in the motivation levels among the two candidates’ supporters. At least 7 in 10 definite voters for Warnock (76%) and Walker (70%) say they are extremely motivated to vote in this year’s election. Among probable supporters, just under half are extremely motivated (46% for Warnock voters and 49% for Walker voters). Looking at motivation by issue priority, those who are focused on rights and democratic processes (72%) are more likely to be extremely motivated than those who prioritize economic concerns (54%).
“The two candidates are evenly matched when it comes to key economic issues, but Warnock has a slight edge on democracy concerns. The economy may be a higher priority for most Georgia voters, but this group tends to be less motivated to go to the polls than other voters. This is one reason why Warnock is holding on against Walker despite the drag caused by a weak Democratic brand in Georgia,” said Murray.
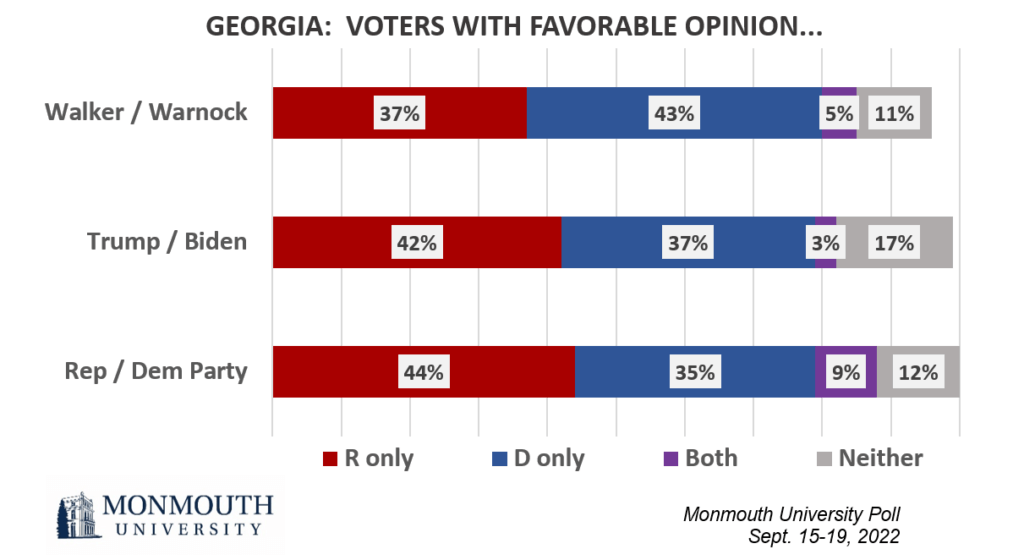
The image of the Democratic Party (44% favorable and 55% unfavorable) is notably more negative in the state than opinion of the Republican Party (53% favorable and 47% unfavorable). Also, former President Donald Trump (45% favorable and 54% unfavorable) has a nominally better rating than current President Joe Biden (41% favorable and 59% unfavorable). When asked about their preference for which party should control Congress, Georgia voters choose the Republicans (50%) over the Democrats (40%).
The poll does not attempt to predict turnout, but past voter history metrics suggest this race could be tight under a range of scenarios. Among voters who participated in the 2020 presidential election, just over 4 in 10 definitely (32%) or probably (13%) support Warnock and a similar number definitely (26%) or probably (15%) support Walker. The race is also close among those who voted in the 2018 midterm election, with Warnock (36% definite and 11% probable) and Walker (29% definite and 15% probable) running about even.
The Monmouth University Poll was conducted by telephone from September 15 to 19, 2022 with 601 Georgia registered voters. The question results in this release have a margin of error of +/- 4.0 percentage points. The poll was conducted by the Monmouth University Polling Institute in West Long Branch, NJ.
QUESTIONS AND RESULTS
(* Some columns may not add to 100% due to rounding.)
1.Would you say things in the country are going in the right direction, or have they gotten off on the wrong track?
| Sept. 2022 | |
| Right direction | 18% |
| Wrong track | 71% |
| (VOL) Depends | 6% |
| (VOL) Don’t know | 5% |
| (n) | (601) |
2.In your opinion, what are the most important one or two issues facing the country right now? [LIST WAS NOT READ] [Note: Results add to more than 100% because multiple responses were accepted.]
| Sept. 2022 | |
| Economy (general) | 25% |
| Inflation, increasing prices | 36% |
| Gas prices specifically | 6% |
| Health care, health insurance | 7% |
| Abortion | 14% |
| Education, schools | 6% |
| Crime, violence | 6% |
| Gun control, 2nd Amendment | 3% |
| Race, equity | 5% |
| Illegal immigration | 17% |
| Terrorism, national security | 5% |
| Environment, climate change | 4% |
| Covid, pandemic | 3% |
| Democracy, voting, elections | 6% |
| Joe Biden | 6% |
| Donald Trump | 1% |
| Divided country, extremism | 8% |
| Taxes, spending, big government | 6% |
| Poverty, food security | 6% |
| Morality, values | 4% |
| Rights, liberties | 5% |
| Other | 4% |
| Nothing/no answer | 1% |
| (n) | (601) |
3.Would you rather see the Republicans or the Democrats in control of Congress, or doesn’t this matter to you? [CHOICES WERE ROTATED] [If DOES NOT MATTER: If you had to lean one way or the other would you pick the Republicans or the Democrats?]
| Sept. 2022 | |
| Republicans | 39% |
| Not matter, but lean Rep | 11% |
| Democrats | 33% |
| Not matter, but lean Dem | 7% |
| Does not matter, no lean | 8% |
| (VOL) Don’t know | 2% |
| (n) | (601) |
4.Is it very important, somewhat important, or only a little important to have [Republicans/Democrats] in control of Congress? [CHOICE READ FROM Q3]
| Sept. 2022 | |
| Very important | 60% |
| Somewhat important | 20% |
| Only a little important | 9% |
| (VOL) Don’t know / Does not matter who controls Congress (from Q3) | 10% |
| (n) | (601) |
5/6.I am going to read you a list of candidates running for U.S. Senate in Georgia this year. For each one, please tell me if you have definitely heard of them, not sure if you’ve heard of them, or if you’ve definitely not heard of them?
[If DEFINITELY HEARD OF:] For each of the following, please tell me if you have a very favorable, somewhat favorable, somewhat unfavorable, or very unfavorable opinion of them. [NAMES WERE ROTATED]
| Very favorable | Somewhat favorable | Somewhat unfavorable | Very unfavorable | Heard of, no opinion (VOL) | Not sure if heard of | Definitely not heard of | (n) | |
| Herschel Walker, the Republican | 22% | 20% | 13% | 35% | 6% | 1% | 4% | (601) |
| Raphael Warnock, the Democrat | 32% | 16% | 10% | 34% | 5% | 0% | 3% | (601) |
| Chase Oliver, the Libertarian | 1% | 4% | 2% | 1% | 2% | 10% | 78% | (601) |
[QUESTIONS 7 & 8 WERE ROTATED]
7.How likely are you to vote for Herschel Walker in the election for U.S. Senate – will you definitely vote for him, probably vote for him, probably not vote for him, or definitely not vote for him?
| Sept. 2022 | |
| Definitely | 26% |
| Probably | 15% |
| Probably not | 10% |
| Definitely not | 43% |
| (VOL) Don’t know | 6% |
| (n) | (601) |
8.How likely are you to vote for Raphael Warnock in the election for U.S. Senate – will you definitely vote for him, probably vote for him, probably not vote for him, or definitely not vote for him?
| Sept. 2022 | |
| Definitely | 32% |
| Probably | 13% |
| Probably not | 8% |
| Definitely not | 42% |
| (VOL) Don’t know | 5% |
| (n) | (601) |
9.Which is more important to you in deciding who to support for Senate this year – concerns about fundamental rights and the democratic process OR concerns about the economy and cost of living? [CHOICES WERE ROTATED]
| Sept. 2022 | |
| Concerns about fundamental rights and the democratic process | 33% |
| Concerns about the economy and cost of living | 56% |
| (VOL) Both equally | 9% |
| (VOL) Don’t know | 3% |
| (n) | (601) |
10.Who do you trust more on [READ ITEM] – Herschel Walker, Raphael Warnock, both equally, or neither one? [ITEMS WERE ROTATED] [NAMES WERE ROTATED]
| Herschel Walker | Raphael Warnock | Both equally | Neither one | (VOL) Don’t know | (n) | |
| Immigration | 36% | 37% | 4% | 18% | 4% | (601) |
| Gun control | 40% | 36% | 3% | 16% | 5% | (601) |
| Abortion | 30% | 39% | 2% | 22% | 7% | (601) |
| Jobs, the economy and cost of living | 37% | 39% | 4% | 17% | 2% | (601) |
| Defending your values | 36% | 43% | 3% | 17% | 2% | (601) |
[Q11-16 held for future release.]
[QUESTIONS 17 & 18 WERE ROTATED]
17.Is your general impression of the Republican Party very favorable, somewhat favorable, somewhat unfavorable, or very unfavorable?
| Sept. 2022 | |
| Very favorable | 17% |
| Somewhat favorable | 36% |
| Somewhat unfavorable | 16% |
| Very unfavorable | 31% |
| (VOL) Don’t know | 1% |
| (n) | (601) |
18.Is your general impression of the Democratic Party very favorable, somewhat favorable, somewhat unfavorable, or very unfavorable?
| Sept. 2022 | |
| Very favorable | 16% |
| Somewhat favorable | 28% |
| Somewhat unfavorable | 16% |
| Very unfavorable | 39% |
| (VOL) Don’t know | 1% |
| (n) | (601) |
[QUESTIONS 19 & 20 WERE ROTATED]
19.Is your general impression of Donald Trump very favorable, somewhat favorable, somewhat unfavorable, or very unfavorable?
| Sept. 2022 | |
| Very favorable | 22% |
| Somewhat favorable | 23% |
| Somewhat unfavorable | 11% |
| Very unfavorable | 43% |
| (VOL) Don’t know | 1% |
| (n) | (601) |
20.Is your general impression of Joe Biden very favorable, somewhat favorable, somewhat unfavorable, or very unfavorable?
| Sept. 2022 | |
| Very favorable | 16% |
| Somewhat favorable | 25% |
| Somewhat unfavorable | 12% |
| Very unfavorable | 47% |
| (VOL) Don’t know | 2% |
| (n) | (601) |
21.Thinking about Joe Biden’s presidency so far, would you say he is doing a lot better than you thought he would, a little better than you thought, a lot worse than you thought, a little worse than you thought, or has he accomplished about what you thought he would?
| Sept. 2022 | |
| Lot better | 6% |
| Little better | 11% |
| Lot worse | 39% |
| Little worse | 12% |
| About what you thought | 30% |
| (VOL) Don’t know | 3% |
| (n) | (601) |
22.How motivated are you to vote in this year’s election – extremely motivated, very motivated, somewhat motivated, or not motivated?
| Sept. 2022 | |
| Extremely motivated | 61% |
| Very motivated | 20% |
| Somewhat motivated | 13% |
| Not motivated | 6% |
| (VOL) Don’t know | 0% |
| (n) | (601) |
23.Compared to past elections for U.S. Senate and Congress, are you more enthusiastic than usual, less enthusiastic, or about the same as past elections?
| Sept. 2022 | |
| More enthusiastic | 34% |
| Less enthusiastic | 12% |
| About the same | 53% |
| (VOL) Don’t know | 2% |
| (n) | (601) |
24.Do you feel optimistic or pessimistic about the outcome of the upcoming midterm elections? [Is that very or somewhat optimistic/pessimistic?]
| Sept. 2022 | |
| Very optimistic | 26% |
| Somewhat optimistic | 42% |
| Somewhat pessimistic | 19% |
| Very pessimistic | 7% |
| (VOL) Don’t know | 6% |
| (n) | (601) |
[Q25-27 held for future release.]
METHODOLOGY
The Monmouth University Poll was sponsored and conducted by the Monmouth University Polling Institute from September 15 to 19, 2022 with a probability-based random sample of 601 Georgia voters drawn from a list of active registered voters who participated in at least one general election since 2016 or have newly registered since the 2020 election. This includes 146 contacted by a live interviewer on a landline telephone and 455 contacted by a live interviewer on a cell phone, in English. Monmouth is responsible for all aspects of the survey design, data weighting and analysis. The full sample is weighted for inferred partisanship based on primary voting history, age, gender, race, education, and region based on state voter registration list information and U.S. Census information (CPS 2018 supplement). Data collection support provided by Braun Research (field) and Aristotle (voter sample). For results based on this sample, one can say with 95% confidence that the error attributable to sampling has a maximum margin of plus or minus 4.0 percentage points (unadjusted for sample design). Sampling error can be larger for sub-groups (see table below). In addition to sampling error, one should bear in mind that question wording and practical difficulties in conducting surveys can introduce error or bias into the findings of opinion polls.
| DEMOGRAPHICS (weighted) |
| REGISTERED VOTERS |
| Party Inferred (primary history) |
| 47% Republican |
| 16% Other/none |
| 37% Democrat |
| Self-Reported Party |
| 34% Republican |
| 36% Independent |
| 30% Democrat |
| 46% Male |
| 54% Female |
| 24% 18-34 |
| 24% 35-49 |
| 27% 50-64 |
| 25% 65+ |
| 62% White, non-Hispanic |
| 30% Black |
| 5% Hispanic |
| 3% Asian/other |
| 66% No degree |
| 34% 4 year degree |
Click on pdf file link below for full methodology and crosstabs by key demographic groups. |