West Long Branch, NJ – Both Nikki Haley and Donald Trump have gained support among South Carolina Republican primary voters since the presidential nomination contest became a two-person race. However, the state’s former governor continues to trail the former president by a wide margin in the Monmouth (“Mon-muth”) University-Washington Post Poll. On the question of electability, more voters see Trump rather than Haley as a definite winner in November. Very few Trump backers say a possible conviction for his 2020 election actions would change their minds about supporting him.
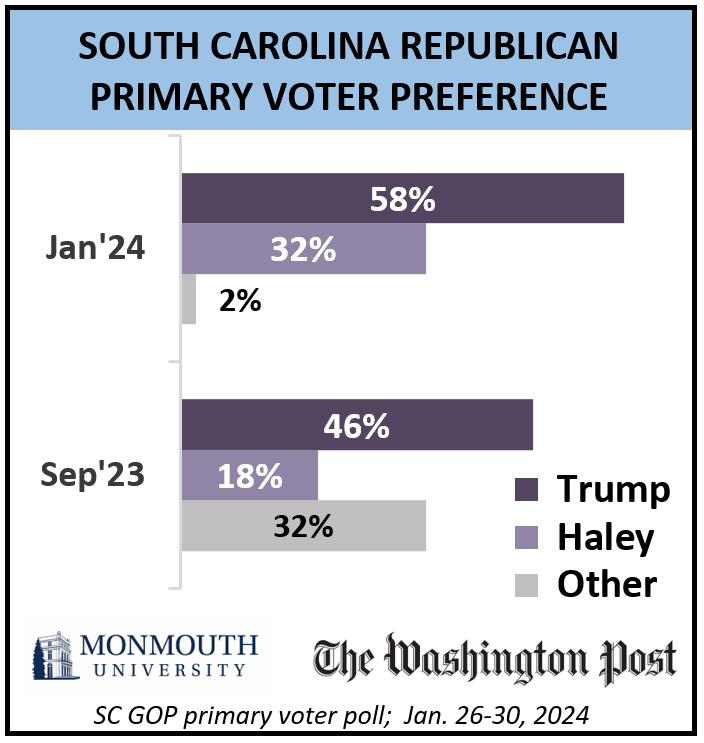
A majority (58%) of potential Republican primary voters currently support Trump (up from 46% in September) while 32% support Haley (up from 18% in the fall). Trump commands majority support among both men (62%) and women (54%) and all age groups (62% among those ages 18 to 49, 58% among those ages 50 to 64, and 57% of those age 65 and older). He has especially high levels of support among white evangelicals (69%) and voters without a college degree (68%). Trump splits the vote with Haley among voters who are not white evangelical (46% to 42% for Haley) and college graduates (44% to 46% for Haley).
Trump’s legal problems are not much of a concern among South Carolina’s Republican primary voters. Fully 3 in 5 (60%) say the GOP should keep Trump on the ticket if he wins the nomination but is convicted of a crime related to the 2020 election. A similar 62% say they would still cast a general election ballot for Trump in that situation while just 17% would vote for incumbent President Joe Biden. Among current Trump supporters in the state’s primary, 88% feel he should stay on the ticket even if convicted, with 90% saying they would still vote for him over Biden in November.
As it stands now, 7 in 10 voters believe Trump would definitely (42%) or probably (29%) beat Biden in November. There is less confidence in Haley’s prospects if she were to become the nominee, with just 21% saying she would definitely beat Biden and 42% saying she probably would. On the other hand, Haley supporters (32%) are less confident in Trump’s chances of beating Biden in November than Trump supporters (54%) are about Haley’s prospects.
“Trump’s electability is a concern for some primary voters. It’s just that this group is nowhere near large enough to put Haley in striking distance of the front-runner,” said Patrick Murray, director of the independent Monmouth University Polling Institute.
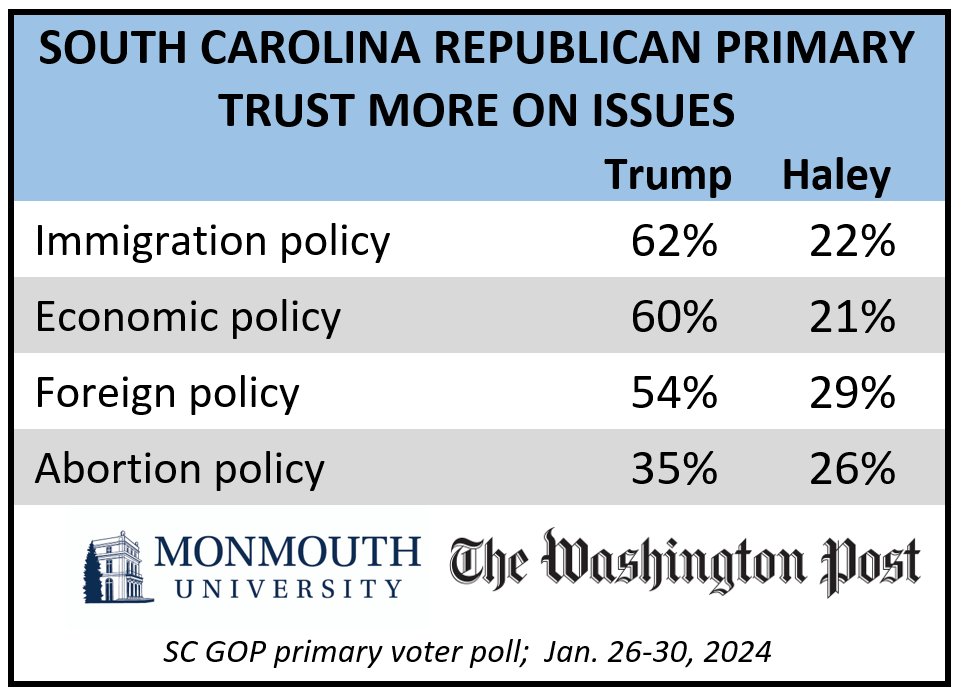
Potential Republican primary voters trust Trump over Haley across a broad range of issues. The former president has a clear advantage on immigration policy – 62% trust him more to handle this issue compared with 22% who trust Haley more – economic policy (60% to 21%), and foreign policy (54% to 29%). Trump has a slight edge on being trusted more to handle abortion policy – 35% to 26%, with 33% saying they trust Trump and Haley equally on this issue.
This poll report does not include a modeled “likely voter” projection. The results presented here represent the pool of potential Republican primary voters, i.e., those who indicate having at least some chance of voting in the primary. More Trump voters (73%) report being extremely motivated to turn out than Haley supporters are (45%) according to the poll. On the other hand, South Carolina holds an open primary with no partisan registration. This means any registered voter who does not participate in this Saturday’s Democratic primary is eligible to cast a Republican ballot at the end of the month. The vast majority (81%) of those polled have voted in at least one primary since 2016 according to the election rolls. This includes 6 in 10 who have voted in only Republican primaries along with another 2 in 10 who have voted in both Republican and Democratic contests over the past eight years. Trump has a decisive advantage among voters who have only participated in Republican primaries (67% to 24% for Haley) as well as those who have not voted in any primary since 2016 (66% to 31%). However, Haley (55%) actually leads Trump (27%) among those who have voted in both parties’ primaries during this span.
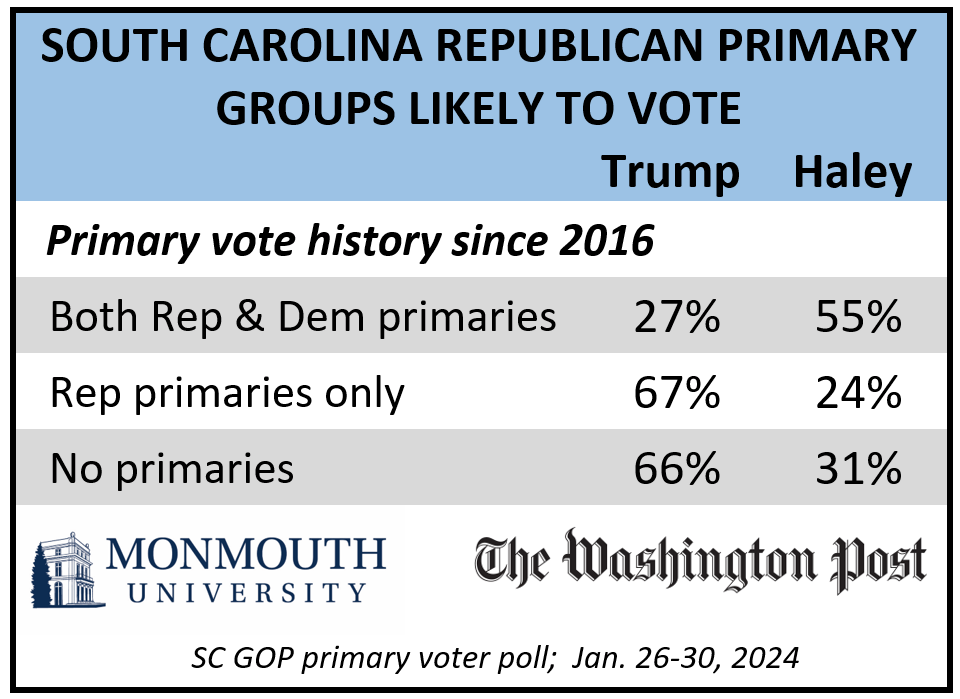
“Haley’s hopes appear to hang on pulling in Democratic-leaning voters who would never support her in a general election but simply want to stop Trump. Our sampling frame for this poll did not include voters who have participated only in Democratic primaries. If a sizable number of those voters decide to skip this week’s primary and show up for the Republican contest instead, she could narrow the gap. It would remain a tough challenge, though, for her to actually close it,” said Murray.
Murray added, “Another problem for Haley is that even a close second-place finish may not provide much momentum because of South Carolina’s winner-take-all delegate allocation rule. Our poll currently shows Trump statistically ahead in five congressional districts and holding nominal leads in the other two. A Trump sweep of all 50 delegates is possible even if Haley can make it a tighter race.”
The poll also asked potential Republican primary voters about Sen. Tim Scott’s endorsement for the presidential nomination. Haley originally appointed Scott to his U.S. Senate seat when she was governor, but Scott endorsed Trump last month. Half (50%) say Scott should have endorsed Trump, while just 24% say he should have endorsed Haley. Another 16% say Scott should not have endorsed anyone. Scott is currently more popular than Haley among their home state’s GOP primary electorate. The senator earns a 58% favorable to 24% unfavorable rating while the former governor gets a 45% favorable to 41% unfavorable rating. Scott’s favorability number is in line with his result in the Monmouth University-Washington Post poll from September (62%), but Haley’s positive rating has dropped considerably (from 59%). Views of Trump have remained relatively stable during this same time – 66% favorable to 28% favorable now compared with 60% to 30% in the fall.
The Monmouth University-Washington Post Poll was conducted by telephone and online from January 26 to 30, 2024 with 815 potential Republican presidential primary voters in South Carolina. The question results in this release have a margin of error of +/- 3.9 percentage points for this sample. The poll was conducted jointly by the Monmouth University Polling Institute and the Washington Post.
QUESTIONS AND RESULTS
(* Some columns may not add to 100% due to rounding.)
1.How closely are you following the race for the 2024 Republican presidential nomination?
| Trend: | Jan. 2024 | Sept. 2023 |
|---|---|---|
| Very closely | 58% | 46% |
| Somewhat closely | 28% | 31% |
| Not too closely | 8% | 12% |
| Not at all closely | 6% | 9% |
| (VOL) Don’t know | 1% | 1% |
| (n) | (815) | (506) |
2.How likely are you to vote in South Carolina’s Republican primary for president near the end of February – are you absolutely certain to vote, will you probably vote, are the chances 50-50, or less than that?
| Trend: | Jan. 2024 | Sept. 2023 |
|---|---|---|
| Absolutely certain to vote | 79% | 78% |
| Will probably vote | 13% | 15% |
| Chances are 50-50 | 7% | 7% |
| Less than that | n/a | n/a |
| (n) | (815) | (506) |
3.How motivated are you to vote in the Republican presidential primary: extremely motivated, very motivated, somewhat motivated, or not motivated?
| Trend: | Jan. 2024 | Sept. 2023 |
|---|---|---|
| Extremely motivated | 59% | 60% |
| Very motivated | 20% | 17% |
| Somewhat motivated | 13% | 14% |
| Not motivated | 6% | 8% |
| (VOL) Don’t know | 1% | 1% |
| (n) | (815) | (506) |
4.I’m going to read you the names of some prominent Republicans. Please tell me if your general impression of each is favorable or unfavorable, or if you don’t really have an opinion. If you have not heard of the person, just let me know. First, [READ NAME]. [NAMES WERE ROTATED]
| Trend: | Favorable | Unfavorable | No opinion | Not heard of | (VOL) No answer | (n) |
|---|---|---|---|---|---|---|
| Former President Donald Trump | 66% | 28% | 4% | 0% | 1% | (815) |
| — Sept. 2023 | 60% | 30% | 9% | 0% | 1% | (506) |
| Former South Carolina Governor and U.N. Ambassador Nikki Haley | 45% | 41% | 10% | 1% | 2% | (815) |
| — Sept. 2023 | 59% | 24% | 12% | 1% | 4% | (506) |
| South Carolina Senator Tim Scott | 58% | 24% | 12% | 3% | 3% | (815) |
| — Sept. 2023 | 62% | 20% | 13% | 1% | 4% | (506) |
5.If the Republican primary for president was held today, would you vote for Donald Trump, Nikki Haley, or someone else?[NAMES WERE ROTATED]
| Trend: | Jan. 2024 | Sept. 2023* |
|---|---|---|
| Donald Trump | 58% | 46% |
| Nikki Haley | 32% | 18% |
| Other-Someone else | 2% | 1% |
| Ron DeSantis | n/a | 9% |
| Mike Pence | n/a | 3% |
| Vivek Ramaswamy | n/a | 3% |
| Tim Scott | n/a | 10% |
| Asa Hutchinson | n/a | 2% |
| Chris Christie | n/a | 5% |
| Doug Burgum | n/a | <1% |
| (VOL) Don’t know | 8% | 4% |
| (n) | (815) | (506) |
6.Are you definitely supporting [TRUMP/HALEY FROM Q5] or would you consider supporting [HALEY/TRUMP]?
| Response: | Jan. 2024 |
|---|---|
| Definitely supporting | 79% |
| Would consider other candidate | 9% |
| (VOL) Don’t know | 2% |
| Other choice, undecided (from Q5) | 10% |
| (n) | (815) |
[QUESTIONS 7 & 8 WERE ROTATED]
7.How would you feel if Donald Trump became the Republican nominee – enthusiastic, satisfied, dissatisfied, or upset?
| Response: | Jan. 2024 |
|---|---|
| Enthusiastic | 39% |
| Satisfied | 30% |
| Dissatisfied | 9% |
| Upset | 20% |
| (VOL) Don’t know | 2% |
| (n) | (815) |
8.How would you feel if Nikki Haley became the Republican nominee – enthusiastic, satisfied, dissatisfied, or upset?
| Response: | Jan. 2024 |
|---|---|
| Enthusiastic | 20% |
| Satisfied | 34% |
| Dissatisfied | 24% |
| Upset | 19% |
| (VOL) Don’t know | 2% |
| (n) | (815) |
9.What’s more important to you – that Republicans nominate the presidential candidate whose positions on the issues come closest to yours or the candidate who seems most likely to defeat Joe Biden in November? [CHOICES WERE ROTATED]
| Response: | Jan. 2024 |
|---|---|
| Whose positions on the issues come closest to yours | 62% |
| Who seems most likely to defeat Joe Biden in November | 33% |
| (VOL) Don’t know | 5% |
| (n) | (815) |
[QUESTIONS 10 & 11 WERE ROTATED]
10.If Donald Trump became the Republican nominee, do you think he would definitely beat Joe Biden in November, probably beat Biden, probably lose to Biden, or definitely lose to Biden?
| Response: | Jan. 2024 |
|---|---|
| Definitely beat | 42% |
| Probably beat | 29% |
| Probably lose | 14% |
| Definitely lose | 11% |
| (VOL) Don’t know | 4% |
| (n) | (815) |
11.If Nikki Haley became the Republican nominee, do you think she would definitely beat Joe Biden in November, probably beat Biden, probably lose to Biden, or definitely lose to Biden?
| Response: | Jan. 2024 |
|---|---|
| Definitely beat | 21% |
| Probably beat | 42% |
| Probably lose | 21% |
| Definitely lose | 11% |
| (VOL) Don’t know | 5% |
| (n) | (815) |
12.Who do you trust more to handle [READ ITEM] policy – Donald Trump or Nikki Haley, or do you trust both equally on this issue? [ITEMS WERE ROTATED; NAMES WERE ROTATED]
| Response: | Trump | Haley | Both equally | (VOL) Don’t know | (n) |
|---|---|---|---|---|---|
| Immigration policy | 62% | 22% | 15% | 1% | (815) |
| Economic policy | 60% | 21% | 18% | 1% | (815) |
| Foreign policy | 54% | 29% | 17% | 1% | (815) |
| Abortion policy | 35% | 26% | 33% | 6% | (815) |
13.Do you think abortion should be: legal in all cases, legal in most cases, illegal in most cases, or illegal in all cases? [CHOICES WERE READ IN REVERSE ORDER FOR A RANDOM HALF SAMPLE]
| Trend: | Jan. 2024 | Sept. 2023 |
|---|---|---|
| Legal in all cases | 12% | 10% |
| Legal in most cases | 27% | 28% |
| Illegal in most cases | 41% | 45% |
| Illegal in all cases | 14% | 13% |
| (VOL) Don’t know | 5% | 4% |
| (n) | (815) | (506) |
14.How concerned, if at all, are you that the Republican Party is focusing too much on abortion – very, somewhat, not too, not at all?
| Response: | Jan. 2024 |
|---|---|
| Very concerned | 23% |
| Somewhat concerned | 31% |
| Not too concerned | 25% |
| Not at all concerned | 18% |
| (VOL) Don’t know | 2% |
| (n) | (815) |
15.Do you believe Joe Biden won the 2020 election fair and square, or do you believe that he only won it due to voter fraud?
| Trend: | Jan. 2024 | Sept. 2023 |
|---|---|---|
| Fair and square | 35% | 36% |
| Due to voter fraud | 57% | 57% |
| (VOL) Don’t know | 7% | 7% |
| (n) | (815) | (506) |
16.In his response to the 2020 presidential election, do you think Donald Trump committed a crime, did something wrong but not criminal, or did nothing wrong? [CHOICES WERE READ IN REVERSE ORDER FOR A RANDOM HALF SAMPLE]
| Trend: | Jan. 2024 | Sept. 2023 |
|---|---|---|
| Committed a crime | 21% | 21% |
| Did something wrong but not criminal | 25% | 33% |
| Did nothing wrong | 50% | 43% |
| (VOL) Don’t know | 4% | 4% |
| (n) | (815) | (506) |
17.If Donald Trump wins the Republican nomination for president and then is convicted of a crime for his response to the 2020 presidential election, do you think the Republican Party should keep Trump or replace Trump as their presidential candidate? [CHOICES WERE ROTATED]
| Trend: | Jan. 2024 | Sept. 2023 |
|---|---|---|
| Keep Trump | 60% | 51% |
| Replace Trump | 36% | 43% |
| (VOL) Don’t know | 4% | 6% |
| (n) | (815) | (506) |
18.If Trump is convicted of a crime and remains the Republican Party candidate in November, for whom would you vote for president – Donald Trump, Joe Biden, another candidate, or would you not vote? [NAMES WERE ROTATED]
| Response: | Jan. 2024 |
|---|---|
| Donald Trump | 62% |
| Joe Biden | 17% |
| Another candidate | 15% |
| Would not vote | 4% |
| (VOL) Don’t know | 3% |
| (n) | (815) |
19.Do you think Senator Tim Scott should have endorsed Donald Trump, should have endorsed Nikki Haley, or should have not endorsed anyone in the Republican primary for president? [FIRST TWO CHOICES WERE ROTATED]
| Response: | Jan. 2024 |
|---|---|
| Endorsed Donald Trump | 50% |
| Endorsed Nikki Haley | 24% |
| Not have endorsed anyone | 16% |
| (VOL) Don’t know | 10% |
| (n) | (815) |
20.Did you happen to vote in the Republican primary in 2016 when Donald Trump ran against Marco Rubio, Ted Cruz, Jeb Bush, John Kasich, and Ben Carson, or did you skip that primary? [If YES:] Which candidate did you vote for in the 2016 primary? [Vote choice is reported only for voters validated as participating in the 2016 primary.]
| Response: | Jan. 2024 |
|---|---|
| Donald Trump | 30% |
| Marco Rubio | 4% |
| Ted Cruz | 4% |
| Jeb Bush | 2% |
| John Kasich | 2% |
| Ben Carson | 3% |
| (VOL) Someone else | 0% |
| (VOL) Don’t know | 2% |
| Do not recall voting | 5% |
| Not voted per registration list | 48% |
| (n) | (815) |
21.Did you happen to vote in the 2020 general election between Donald Trump and Joe Biden, or did you skip that election? [If YES:] Who did you vote for? [Vote choice is reported only for voters validated as participating in the 2020 election.]
| Response: | Jan. 2024 |
|---|---|
| Donald Trump | 60% |
| Joe Biden | 16% |
| (VOL) Someone else | 1% |
| (VOL) Don’t know | 2% |
| Do not recall voting | 2% |
| Not voted per registration list | 18% |
| (n) | (815) |
METHODOLOGY
The Monmouth University-Washington Post Poll was conducted from January 26 to 30, 2024, among a probability-based sample of 1,045 South Carolina voters who have voted in at least one Republican primary election since 2016 or have newly registered since the 2020 election and not voted in a primary. The poll was conducted in English, and included 232 live landline telephone interviews, 401 live cell phone interviews, and 412 online surveys via a cell phone text invitation. Interviewing services were provided by Braun Research using telephone numbers randomly selected from a list of voters obtained from Aristotle. The full sample is weighted for region, age, gender and race based on the voter list and education based on US Census information (CPS and ACS one-year surveys). Results released from this poll are based on a sub-set of 815 voters who indicated they had a 50-50 chance or better of voting in the 2024 Republican presidential primary. For this sample, one can say with 95% confidence that the error attributable to sampling has a maximum margin of plus or minus 3.9 percentage points adjusted for sample design effects (1.26). Sampling error can be larger for sub-groups (see table below). In addition to sampling error, one should bear in mind that question wording and practical difficulties in conducting surveys can introduce error or bias into the findings of opinion polls. The Monmouth University Polling Institute and the Washington Post jointly sponsored and conducted this poll, and are responsible for all aspects of the questionnaire and sample design as well as weighting and data analysis.
Potential primary voter demographics (weighted)
Party ID (self-reported): 44% strong Rep., 37% soft or lean Rep., 19% Ind. or Dem.
Ideology: 37% very conservative, 31% somewhat conservative, 32% moderate, liberal
Sex: 53% male, 47% female
Age: 11% 18-34, 20% 35-49, 29% 50-64, 40% 65+
Education: 33% high school or less, 27% some college, 27% 4-year degree, 13% graduate degree
White Evangelical: 54% yes, 46% no
MAGA supporter: 54% yes, 46% no
Race: 87% White, 8% Black, 5% Hispanic/Asian/other
Income: 28% <$50K, 29% $50-<100K, 43% $100K+
Voted in 2016 GOP primary: 52% yes, 48% no
Click on pdf file link below for full methodology and crosstabs by key demographic groups.