West Long Branch, NJ – President Joe Biden’s job rating has hit an all-time low in the Monmouth (“Mon-muth”) University Poll, including particularly poor marks for his handling of immigration and inflation. Only 3 in 10 Americans say the incumbent is giving enough attention to the issues most important to them, which is worse than for his predecessor. The poll also finds congressional leadership ratings have dropped, with the new House speaker debuting in negative territory.
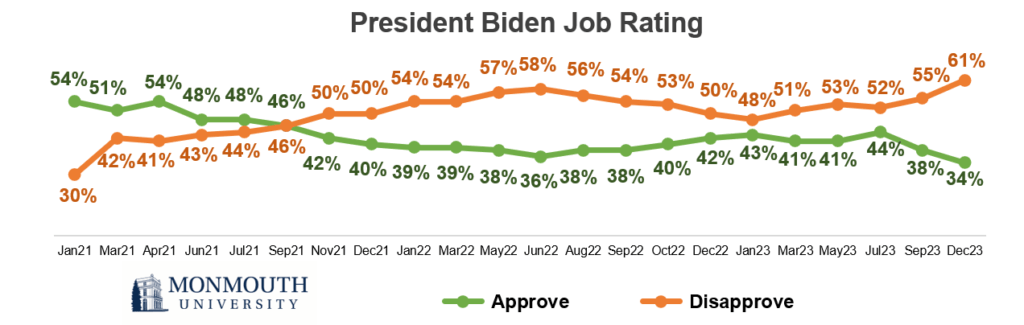
Public opinion of Biden’s overall job performance currently stands at 34% approve and 61% disapprove – his lowest rating in Monmouth’s polling since he took office. Since September, his approval number has dropped 4 points and his disapproval number has increased by 6 points. Between October 2022 and July 2023, Biden’s approval rating ranged between 40% and 44% while his disapproval number registered between 48% and 53%. Presidential approval has dropped among both Democrats (74%, down from 80% in September and 88% in July) and independents (24%, down from 30% in September and 38% in July); and it currently stands at just 5% among Republicans.
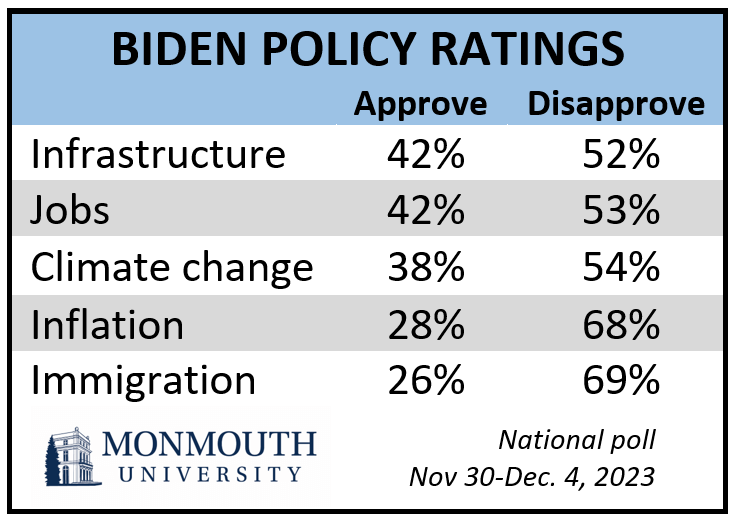
A majority of Americans disapprove of the way Biden has handled five different policy areas, results that are between one and six points worse than the last time Monmouth asked these questions. Specifically, just over 2 in 3 disapprove of the president’s performance on immigration (69%) and inflation (68%), while more than half feel the same about the way he has handled climate change (54%), jobs and unemployment (53%), and transportation and energy infrastructure (52%). While Biden’s fellow Democrats tend to approve of the job he has done in most of these areas, they are divided on his immigration efforts (50% approve and 47% disapprove). Also, while 62% of Democrats approve of how Biden has handled inflation, a sizable 35% disapprove.
“The Biden administration keeps touting their infrastructure investments and a host of positive economic indicators. Those data points may be factual, but most Americans are still smarting from higher prices caused by post-pandemic inflation. This seems to be what’s driving public opinion. There is political danger in pushing a message that basically tells people their take on their own situation is wrong,” said Patrick Murray, director of the independent Monmouth University Polling Institute.
Currently, 44% of Americans say they are struggling to remain where they are financially. Another 43% report being basically stable, while only 12% say their financial situation is improving. In the three years prior to the pandemic, the number of Americans who were struggling ranged between 20% and 29% while those who reported having improved finances ranged between 20% and 25%. When the COVID pandemic hit in March 2020, the number who said their finances were improving dropped to 11% but those who were struggling barely rose 26%, which was about on par with prior polling. This latter number remained basically steady throughout the pandemic and stood at 24% in June 2021, just a few months into the start of the current inflationary cycle. The number of Americans who said they were struggling increased to 42% as inflation peaked at about 9% in June 2022, but then went down to 37% in October 2022 as the rate of inflation started to ease. However, even though the inflation rate has continued to decline, the number of Americans who reported struggling started to increase again, hitting 41% in March of this year before registering 44% in the current poll.
Just 31% of the American public says Biden has been giving enough attention to the issues that are most important to their families. The vast majority (65%) wish he would give more attention to those issues. Just 11% of Republicans and 25% of independents say Biden is paying enough attention to their top concerns. Although a majority of Democrats (58%) feel he is paying the right amount of attention to their top issues, a sizable minority (41%) wish he would focus more on those concerns. As a point of comparison, former President Donald Trump got a relatively better evaluation on this metric in the year before the last presidential election; 41% said Trump was giving enough attention and 55% wished he would give more attention to their most important issues in a June 2019 poll.
“There is certainly an element of partisanship in how people frame their own financial situation, which is based in part on who occupies the White House. But even a good chunk of Biden’s Democratic base wish he’d start paying more attention to their top priorities than he is now,” said Murray.
Despite the fact that many Americans have a negative view of their current financial situation, most (58%) are optimistic about what their family’s financial situation will be 12 months from now. There are stark partisan differences in this view, however, with 80% of Democrats and just 37% of Republicans feeling optimistic. Independents are somewhat more likely to be optimistic (53%) than pessimistic (41%) about their financial status in a year’s time.
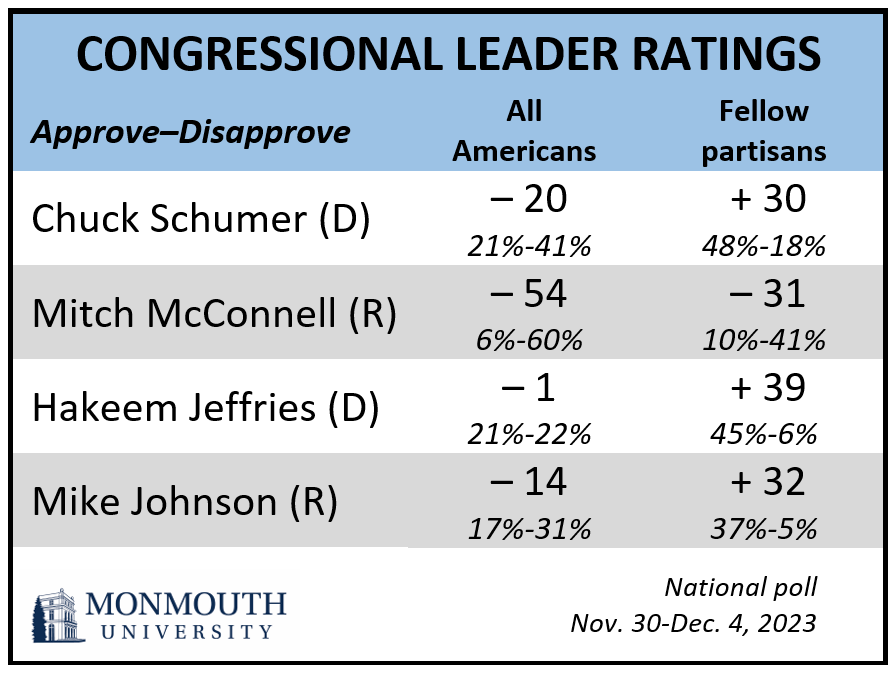
The Monmouth University Poll also finds that opinion of the job the U.S. Congress is doing stands at its worst mark in more than a year – 17% approve and 77% disapprove. Each of the three congressional leaders who were in office when Monmouth last polled on the leadership in July have seen their ratings go down, including among their fellow partisans. The U.S. Senate’s Republican Minority Leader Mitch McConnell earns the lowest overall rating (6% approve and 60% disapprove among American adults), and is the only leader to receive a net negative score from his fellow partisans (10% approve and 41% disapprove among Republicans). On the Democratic side, Senate Majority Leader Chuck Schumer (21% approve and 41% disapprove overall and 48%-18% among Democrats) and House Minority Leader Hakeem Jeffries (21% approve and 22% disapprove overall and 45%-6% among Democrats) enjoy positive ratings among their fellow partisans if not among the public as a whole. Each of these three leaders have seen their approval ratings drop between 3 and 6 points and their disapproval ratings rise between 4 and 10 points since the summer.
The new Speaker of the House, Mike Johnson, starts off his tenure in about the same position as the man he replaced. Johnson’s initial job rating is a negative 17% approve and 31% disapprove among all American adults, but a positive 37% approve and 5% disapprove among his fellow Republicans. Last July, then-Speaker Kevin McCarthy had an overall job rating of 23% approve and 39% disapprove and a Republican rating of 44%-18%. These numbers are similar to where McCarthy stood when he started his short time in the speaker’s chair (19% approve and 35% disapprove overall and 41%-11% among Republicans in January 2023). Also, Johnson’s – and McCarthy’s – ratings are largely similar to where Paul Ryan stood nearly two years into his speakership (23% approve and 43% disapprove overall and 47%-21% among Republicans in July 2017).
In other poll results, Vice President Kamala Harris receives a job rating of 35% approve and 57% disapprove, which is basically unchanged from September (36% favorable and 56% unfavorable). Only 20% of the public says the country is going in the right direction, while 69% say it is on the wrong track.
The Monmouth University Poll was conducted by telephone from November 30 to December 4, 2023 with 803 adults in the United States. The question results in this release have a margin of error of +/- 4.8 percentage points for the full sample. The poll was conducted by the Monmouth University Polling Institute in West Long Branch, NJ.
QUESTIONS AND RESULTS
(* Some columns may not add to 100% due to rounding.)
1.Do you approve or disapprove of the job Joe Biden is doing as president?
| Trend: | Dec. 2023 | Sept. 2023 | July 2023 | May 2023 | March 2023 | Jan. 2023 | Dec. 2022 | Oct. 2022 | Sept. 2022 | Aug. 2022 | June 2022 | May 2022 | March 2022 | Jan. 2022 |
|---|---|---|---|---|---|---|---|---|---|---|---|---|---|---|
| Approve | 34% | 38% | 44% | 41% | 41% | 43% | 42% | 40% | 38% | 38% | 36% | 38% | 39% | 39% |
| Disapprove | 61% | 55% | 52% | 53% | 51% | 48% | 50% | 53% | 54% | 56% | 58% | 57% | 54% | 54% |
| (VOL) No opinion | 5% | 7% | 4% | 6% | 8% | 9% | 8% | 7% | 8% | 7% | 6% | 5% | 7% | 7% |
| (n) | (803) | (814) | (910) | (981) | (805) | (805) | (805) | (808) | (806) | (808) | (978) | (807) | (809) | (794) |
| Trend: Continued | Dec. 2021 | Nov. 2021 | Sept. 2021 | July 2021 | June 2021 | April 2021 | March 2021 | Jan. 2021 |
|---|---|---|---|---|---|---|---|---|
| Approve | 40% | 42% | 46% | 48% | 48% | 54% | 51% | 54% |
| Disapprove | 50% | 50% | 46% | 44% | 43% | 41% | 42% | 30% |
| (VOL) No opinion | 11% | 9% | 8% | 8% | 9% | 5% | 8% | 16% |
| (n) | (808) | (811) | (802) | (804) | (810) | (800) | (802) | (809) |
2.Do you approve or disapprove of the job Kamala Harris is doing as vice president?
| Trend: | Dec. 2023 | Sept. 2023 | July 2023 | May 2023 | March 2023 |
|---|---|---|---|---|---|
| Approve | 35% | 36% | 40% | 37% | 36% |
| Disapprove | 57% | 56% | 52% | 52% | 53% |
| (VOL) No opinion | 8% | 8% | 7% | 11% | 12% |
| (n) | (803) | (814) | (910) | (981) | (805) |
3.Do you approve or disapprove of the job the U.S. Congress is doing?
| Trend: | Dec. 2023 | Sept. 2023 | July 2023 | May 2023 | March 2023 | Jan. 2023 |
|---|---|---|---|---|---|---|
| Approve | 17% | 17% | 22% | 18% | 23% | 19% |
| Disapprove | 77% | 74% | 68% | 72% | 68% | 67% |
| (VOL) No opinion | 6% | 9% | 10% | 9% | 10% | 14% |
| (n) | (803) | (814) | (910) | (981) | (805) | (805) |
| Trend: Continued | Dec. 2022 | Oct. 2022 | Sept. 2022 | Aug. 2022 | June 2022 | May 2022 | March 2022 | Jan. 2022 | Dec. 2021 | Nov. 2021 | Sept. 2021 | July 2021 | June 2021 | April 2021 | March 2021 | Jan. 2021 |
|---|---|---|---|---|---|---|---|---|---|---|---|---|---|---|---|---|
| Approve | 26% | 23% | 23% | 17% | 15% | 15% | 21% | 19% | 23% | 18% | 22% | 23% | 21% | 35% | 30% | 35% |
| Disapprove | 62% | 69% | 66% | 74% | 78% | 77% | 71% | 74% | 66% | 70% | 65% | 62% | 65% | 56% | 59% | 51% |
| (VOL) No opinion | 12% | 8% | 11% | 9% | 7% | 8% | 8% | 6% | 11% | 12% | 13% | 15% | 15% | 9% | 11% | 14% |
| (n) | (805) | (808) | (806) | (808) | (978) | (807) | (809) | (794) | (808) | (811) | (802) | (804) | (810) | (800) | (802) | (809) |
| Trend: Continued | Nov. 2020 | Early June 2020 | May 2020 | April 2020 | Feb. 2020 | Jan. 2020 | Dec. 2019 | Nov. 2019 | Sept. 2019 | Aug. 2019 | June 2019 | May 2019 | April 2019 | March 2019 | Jan. 2019 |
|---|---|---|---|---|---|---|---|---|---|---|---|---|---|---|---|
| Approve | 23% | 22% | 32% | 32% | 20% | 24% | 22% | 23% | 21% | 17% | 19% | 20% | 24% | 23% | 18% |
| Disapprove | 64% | 69% | 55% | 55% | 69% | 62% | 65% | 64% | 68% | 71% | 69% | 71% | 62% | 68% | 72% |
| (VOL) No opinion | 13% | 9% | 13% | 13% | 11% | 14% | 13% | 13% | 11% | 13% | 12% | 9% | 14% | 9% | 10% |
| (n) | (810) | (807) | (808) | (857) | (902) | (903) | (903) | (908) | (1,161) | (800) | (751) | (802) | (801) | (802) | (805) |
| Trend: Continued | Nov. 2018 | Aug. 2018 | June 2018 | April 2018 | March 2018 | Jan. 2018 | Dec. 2017 | Sept. 2017 | Aug. 2017 | July 2017 | May 2017 | March 2017 | Jan. 2017 |
|---|---|---|---|---|---|---|---|---|---|---|---|---|---|
| Approve | 23% | 17% | 19% | 17% | 18% | 21% | 16% | 17% | 18% | 19% | 19% | 25% | 23% |
| Disapprove | 63% | 69% | 67% | 71% | 72% | 68% | 65% | 69% | 69% | 70% | 68% | 59% | 66% |
| (VOL) No opinion | 14% | 14% | 14% | 12% | 11% | 11% | 19% | 15% | 13% | 11% | 13% | 16% | 11% |
| (n) | (802) | (805) | (806) | (803) | (803) | (806) | (806) | (1,009) | (805) | (800) | (1,002) | (801) | (801) |
| Trend: Continued | Sept. 2016* | Aug. 2016* | June 2016* | March 2016 | Jan. 2016 | Dec. 2015 | Oct. 2015 | Sept. 2015 | Aug. 2015 | July 2015 | June 2015 | April 2015 | Jan. 2015 | Dec. 2014 | July 2013 |
|---|---|---|---|---|---|---|---|---|---|---|---|---|---|---|---|
| Approve | 15% | 14% | 17% | 22% | 17% | 16% | 17% | 19% | 18% | 18% | 19% | 21% | 18% | 17% | 14% |
| Disapprove | 77% | 78% | 76% | 68% | 73% | 73% | 71% | 71% | 72% | 69% | 71% | 67% | 70% | 73% | 76% |
| (VOL) No opinion | 8% | 9% | 7% | 10% | 10% | 10% | 12% | 11% | 11% | 12% | 10% | 12% | 11% | 11% | 10% |
| (n) | (802) | (803) | (803) | (1,008) | (1,003) | (1,006) | (1,012) | (1,009) | (1,203) | (1,001) | (1,002) | (1,005) | (1,003) | (1,008) | (1,012) |
[QUESTIONS 4 & 5 WERE ROTATED WITH QUESTIONS 6 & 7]
4.Now, thinking about your current financial situation, would you say you are struggling to remain where you are financially, basically stable in your current financial situation, or is your financial situation improving?
| Trend: | Dec. 2023 | March 2023 | Oct. 2022 | June 2022 | June 2021 | Late June 2020 | Early June 2020 | May 2020 | April 2020 | March 2020 | April 2019 | April 2018 | Jan. 2017 |
|---|---|---|---|---|---|---|---|---|---|---|---|---|---|
| Struggling | 44% | 41% | 37% | 42% | 24% | 22% | 20% | 23% | 26% | 26% | 20% | 24% | 29% |
| Stable | 43% | 46% | 51% | 47% | 58% | 61% | 65% | 63% | 62% | 61% | 54% | 51% | 51% |
| Improving | 12% | 12% | 11% | 9% | 14% | 17% | 13% | 13% | 11% | 11% | 25% | 23% | 20% |
| (VOL) Don’t know | 1% | 2% | 2% | 1% | 3% | 1% | 1% | 1% | 2% | 1% | 1% | 2% | 0% |
| (n) | (803) | (805) | (808) | (978) | (810) | (867) | (807) | (808) | (857) | (851) | (801) | (803) | (801) |
5.Do you feel optimistic or pessimistic about what your family’s financial situation will be 12 months from now? [Would you say very or somewhat optimistic/pessimistic?]
| Trend: | Dec. 2023 | Oct. 2022 |
|---|---|---|
| Very optimistic | 19% | 22% |
| Somewhat optimistic | 39% | 37% |
| Somewhat pessimistic | 19% | 18% |
| Very pessimistic | 20% | 19% |
| (VOL) Don’t know | 4% | 3% |
| (n) | (803) | (808) |
6.Regardless of whether you agree or disagree with President Biden, has he been giving enough attention to the issues that are most important to your family or do you wish he would give more attention to issues that are important to your family?
| Comparison: | BIDEN | Dec. 2023 | Oct. 2022 | TRUMP | March 2020 | June 2019 | Nov. 2018 | Sept. 2017 | Aug. 2017 | May 2017 | March 2017 |
|---|---|---|---|---|---|---|---|---|---|---|---|
| Giving enough attention | 31% | 31% | 45% | 41% | 38% | 37% | 40% | 34% | 36% | ||
| Wish he’d give more | 65% | 63% | 49% | 55% | 56% | 53% | 51% | 62% | 57% | ||
| (VOL) Don’t know | 3% | 6% | 6% | 4% | 6% | 10% | 9% | 5% | 7% | ||
| (n) | (803) | (808) | (851) | (751) | (802) | (1,009) | (805) | (1,002) | (801) |
7.Do you approve or disapprove of how Joe Biden has handled the following policy areas? [ITEMS WERE ROTATED]
| Trend: | Approve | Disapprove | (VOL) Don’t know | (n) |
|---|---|---|---|---|
| Jobs and unemployment | 42% | 53% | 5% | (803) |
| — July 2023 | 47% | 48% | 5% | (910) |
| — Sept. 2022 | 43% | 52% | 5% | (806) |
| Transportation and energy infrastructure | 42% | 52% | 7% | (803) |
| — July 2023 | 43% | 51% | 5% | (910) |
| — Sept. 2022 | 43% | 49% | 8% | (806) |
| Inflation | 28% | 68% | 5% | (803) |
| — July 2023 | 34% | 62% | 4% | (910) |
| — Sept. 2022 | 30% | 66% | 4% | (806) |
| Climate change | 38% | 54% | 8% | (803) |
| — July 2023 | n/a | n/a | n/a | n/a |
| — Sept. 2022 | 42% | 50% | 9% | (806) |
| Immigration | 26% | 69% | 5% | (803) |
| — July 2023 | n/a | n/a | n/a | n/a |
| — Sept. 2022 | 31% | 63% | 6% | (806) |
8.Would you say things in the country are going in the right direction, or have they gotten off on the wrong track?
| Trend: | Dec. 2023 | Sept. 2023 | July 2023 | May 2023 | March 2023 | Jan. 2023 |
|---|---|---|---|---|---|---|
| Right direction | 20% | 17% | 25% | 16% | 22% | 24% |
| Wrong track | 69% | 68% | 68% | 74% | 72% | 73% |
| (VOL) Depends | 9% | 12% | 5% | 6% | 3% | 1% |
| (VOL) Don’t know | 2% | 2% | 3% | 4% | 3% | 2% |
| (n) | (803) | (814) | (910) | (981) | (805) | (805) |
| Trend: Continued | Dec. 2022 | Sept. 2022 | Aug. 2022 | June 2022 | May 2022 | March 2022 | Jan. 2022 | Dec. 2021 | Nov. 2021 | Sept. 2021 | July 2021 | June 2021 | April 2021 | March 2021 | Jan. 2021 |
|---|---|---|---|---|---|---|---|---|---|---|---|---|---|---|---|
| Right direction | 28% | 23% | 15% | 10% | 18% | 24% | 24% | 30% | 31% | 29% | 38% | 37% | 46% | 34% | 42% |
| Wrong track | 68% | 74% | 82% | 88% | 79% | 73% | 71% | 66% | 64% | 65% | 56% | 57% | 50% | 61% | 51% |
| (VOL) Depends | 2% | 2% | 1% | 1% | 2% | 1% | 3% | 1% | 2% | 4% | 3% | 3% | 2% | 4% | 3% |
| (VOL) Don’t know | 3% | 2% | 2% | 1% | 2% | 2% | 2% | 3% | 3% | 2% | 4% | 3% | 2% | 2% | 4% |
| (n) | (805) | (806) | (808) | (978) | (807) | (809) | (794) | (808) | (811) | (802) | (804) | (810) | (800) | (802) | (809) |
| Trend: Continued | Nov. 2020 | Early Sept. 2020 | Aug. 2020 | Late June 2020 | Early June 2020 | May 2020 | April 2020 | March 2020 | Feb. 2020 | Jan. 2020 |
|---|---|---|---|---|---|---|---|---|---|---|
| Right direction | 26% | 27% | 22% | 18% | 21% | 33% | 30% | 39% | 37% | 37% |
| Wrong track | 68% | 66% | 72% | 74% | 74% | 60% | 61% | 54% | 57% | 56% |
| (VOL) Depends | 4% | 4% | 4% | 5% | 4% | 4% | 5% | 4% | 6% | 6% |
| (VOL) Don’t know | 2% | 3% | 2% | 3% | 1% | 3% | 5% | 3% | 1% | 1% |
| (n) | (810) | (867) | (868) | (867) | (807) | (808) | (857) | (851) | (902) | (903) |
| Trend: Continued | Dec. 2019 | Nov. 2019 | Sept. 2019 | Aug. 2019 | June 2019 | April 2019 | April 2019 | March 2019 | Nov. 2018 | Aug. 2018 | June 2018 | April 2018 | March 2018 | Jan. 2018 |
|---|---|---|---|---|---|---|---|---|---|---|---|---|---|---|
| Right direction | 32% | 30% | 30% | 28% | 31% | 29% | 28% | 29% | 35% | 35% | 40% | 33% | 31% | 37% |
| Wrong track | 56% | 61% | 61% | 62% | 62% | 63% | 62% | 63% | 55% | 57% | 53% | 58% | 61% | 57% |
| (VOL) Depends | 8% | 7% | 6% | 8% | 6% | 4% | 7% | 6% | 7% | 6% | 3% | 5% | 6% | 3% |
| (VOL) Don’t know | 4% | 2% | 2% | 2% | 2% | 3% | 3% | 2% | 3% | 3% | 3% | 4% | 1% | 3% |
| (n) | (903) | (908) | (1,161) | (800) | (751) | (802) | (801) | (802) | (802) | (805) | (806) | (803) | (803) | (806) |
| Trend: Continued | Dec. 2017 | Aug. 2017 | May 2017 | March 2017 | Jan. 2017 | Aug. 2016* | Oct. 2015 | July 2015 | June 2015 | April 2015 | Dec. 2014 | July 2013 |
|---|---|---|---|---|---|---|---|---|---|---|---|---|
| Right direction | 24% | 32% | 31% | 35% | 29% | 30% | 24% | 28% | 23% | 27% | 23% | 28% |
| Wrong track | 66% | 58% | 61% | 56% | 65% | 65% | 66% | 63% | 68% | 66% | 69% | 63% |
| (VOL) Depends | 7% | 4% | 5% | 4% | 4% | 2% | 6% | 5% | 5% | 5% | 5% | 5% |
| (VOL) Don’t know | 3% | 5% | 3% | 5% | 2% | 3% | 4% | 3% | 3% | 2% | 3% | 4% |
| (n) | (806) | (805) | (1,002) | (801) | (801) | (803) | (1,012) | (1,001) | (1,002) | (1,005) | (1,008) | (1,012) |
[QUESTIONS 9-12 WERE ROTATED]
9.Do you approve or disapprove of the job Chuck Schumer is doing as Senate Majority Leader, or do you have no opinion of him?
| Trend: | Dec. 2023 | July 2023 | Jan. 2023 | Dec. 2022 | Nov. 2021 | April 2018* | July 2017* |
|---|---|---|---|---|---|---|---|
| Approve | 21% | 25% | 24% | 19% | 21% | 16% | 17% |
| Disapprove | 41% | 37% | 37% | 37% | 37% | 29% | 28% |
| No opinion | 38% | 38% | 39% | 44% | 43% | 55% | 55% |
| (n) | (803) | (910) | (805) | (805) | (811) | (803) | (800) |
10.Do you approve or disapprove of the job Mitch McConnell is doing as Senate Minority Leader, or do you have no opinion of him?
| Trend: | Dec. 2023 | July 2023 | Jan. 2023 | Dec. 2022 | Jan. 2020* | Nov. 2019* | Jan. 2019* | Nov. 2018* | April 2018* | July 2017* |
|---|---|---|---|---|---|---|---|---|---|---|
| Approve | 6% | 12% | 12% | 12% | 21% | 15% | 15% | 15% | 10% | 12% |
| Disapprove | 60% | 50% | 52% | 56% | 39% | 39% | 40% | 28% | 38% | 38% |
| No opinion | 34% | 37% | 36% | 32% | 40% | 46% | 45% | 57% | 52% | 49% |
| (n) | (803) | (910) | (805) | (805) | (903) | (908) | (805) | (802) | (803) | (800) |
11.Do you approve or disapprove of the job Mike Johnson is doing as Speaker of the House, or do you have no opinion of him?
| Response: | Dec. 2023 |
|---|---|
| Approve | 17% |
| Disapprove | 31% |
| No opinion | 51% |
| (n) | (803) |
12.Do you approve or disapprove of the job Hakeem Jeffries is doing as House Minority Leader, or do you have no opinion of him?
| Trend: | Dec. 2023 | July 2023 | Jan. 2023 |
|---|---|---|---|
| Approve | 21% | 24% | 18% |
| Disapprove | 22% | 18% | 16% |
| No opinion | 56% | 59% | 66% |
| (n) | (803) | (910) | (805) |
[Q13-36 previously released.]
METHODOLOGY
The Monmouth University Poll was sponsored and conducted by the Monmouth University Polling Institute from November 30 to December 4, 2023 with a probability-based national random sample of 803 adults age 18 and older. Interviews were conducted in English, and included 250 live landline telephone interviews, 348 live cell phone interviews, and 205 online surveys via a cell phone text invitation. Telephone numbers were selected through a mix of random digit dialing and list-based sampling. Landline respondents were selected with a modified Troldahl-Carter youngest adult household screen. Interviewing services were provided by Braun Research, with sample obtained from Dynata (RDD, n= 522), Aristotle (list, n= 120) and a panel of prior Monmouth poll participants (n= 161). Monmouth is responsible for all aspects of the survey design, data weighting and analysis. The full sample is weighted for region, age, education, gender and race based on US Census information (ACS 2021 one-year survey). For results based on this sample, one can say with 95% confidence that the error attributable to sampling has a maximum margin of plus or minus 4.8 percentage points adjusted for sample design effects (1.92). Sampling error can be larger for sub-groups (see table below). In addition to sampling error, one should bear in mind that question wording and practical difficulties in conducting surveys can introduce error or bias into the findings of opinion polls.
Demographics (weighted)
Party (self-reported): 28% Republican, 41% Independent, 31% Democrat
Sex: 48% male, 50% female
Age: 28% 18-34, 33% 35-54, 39% 55+
Race: 62% White, 12% Black, 16% Hispanic, 9% Asian/other
Education: 38% high school or less, 29% some college, 17% 4 year degree, 16% graduate degree
Click on pdf file link below for full methodology and crosstabs by key demographic groups.


