
West Long Branch, NJ – Public opinion of Sen. Bob Menendez has plummeted since he was charged in a second corruption case in less than ten years. The Monmouth (“Mon-muth”) University Poll finds a clear majority of New Jersey residents want him to resign now – including most of his fellow Democrats – which is a reversal of opinion from the last time he was under federal indictment.
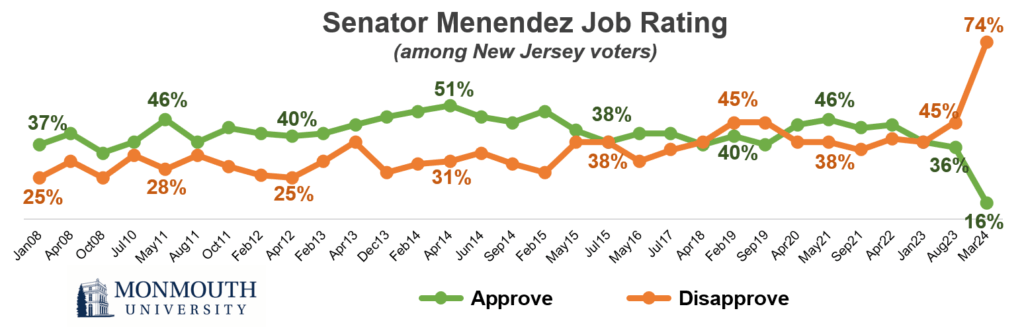
Just 16% of Garden State voters approve of the job Menendez is doing while 3 in 4 (74%) disapprove. This is his record low rating – by far – in Monmouth polling going back to 2008. The last time Menendez faced federal corruption charges, he held a much better job rating of 42% approve and 38% disapprove (May 2015). Those charges were dismissed and Menendez went on to win reelection in 2018. His job rating generally held steady during this time, but it dropped in September 2019 to what was then a career low of 37% favorable and 45% unfavorable. Those numbers quickly rebounded and Menendez held a net positive rating as recently as two years ago (44% favorable and 39% unfavorable in April 2022). His job rating moved to an even split last year (38% approve and 38% disapprove in January 2023) and dropped into negative territory in August of last year (36% approve and 45% disapprove) as news of another federal investigation emerged.
Since his first indictment, Menendez’s approval rating among his fellow Democrats ranged from just under half (47% in 2015) to a high of 72% (2021). That is no longer the case. Menendez gets just 23% approval from Democrats. Nearly 2 in 3 (65%) now disapprove of his performance, joining large majorities of Republicans (82%) and independents (77%) who feel the same.
“Throughout his prior legal ordeal, Menendez could at least count on the backing of most of his fellow Democrats. That support has now cratered and is unlikely to recover since the charges keep piling up,” said Patrick Murray, director of the independent Monmouth University Polling Institute. [Note: The poll was conducted before additional charges against Menendez were announced on Tuesday.]
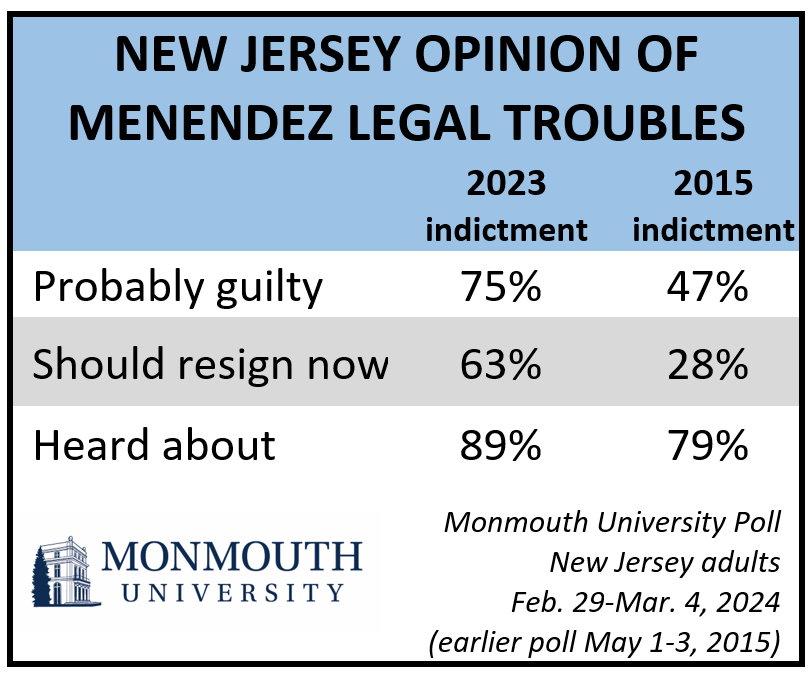
In 2015, just 28% of New Jerseyans called for Menendez’s immediate resignation from the U.S. Senate because of the criminal charges he then faced. In fact, a clear majority (68%) – including most Republicans (65%) – were willing to give him the opportunity to clear his name even though many (47%) believed he was probably guilty at the time. That sentiment doesn’t hold for the present indictment. Currently, 75% of state residents believe Menendez is probably guilty of the current charges and 63% say he should resign now – including 59% of Democrats who want him to step down.
“Perhaps the stash of gold bars is a little too much to stomach. Or maybe it’s simply one corruption trial too many. In any event, New Jerseyans say they have had enough and it’s time for Menendez to go,” said Murray.
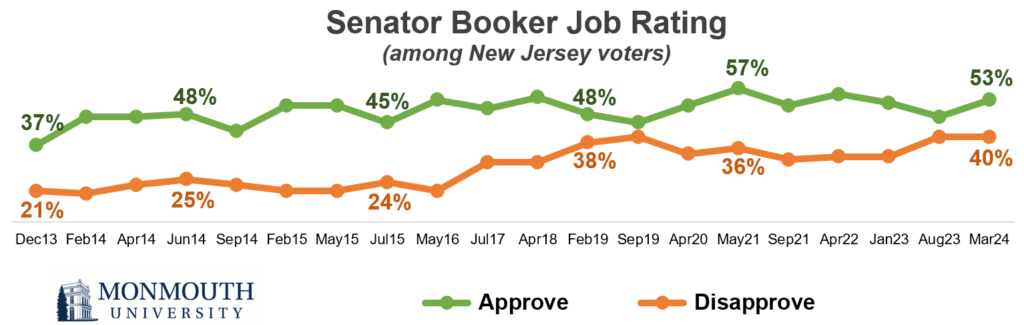
The poll also finds that New Jersey’s other U.S. Senator, Cory Booker, has a 53% approve and 40% disapprove rating among the state’s electorate. Registered voter opinion of President Joe Biden’s job performance stands at a net negative 44% approve and 53% disapprove. In both cases, these results represent slight improvements from Monmouth’s prior New Jersey poll taken last August.
The Monmouth University Poll was conducted by telephone from February 29 to March 4, 2024 with 801 New Jersey adults. The question results in this release have a margin of error of +/- 4.2 percentage points for the full sample. The poll was conducted by the Monmouth University Polling Institute in West Long Branch, NJ.
QUESTIONS AND RESULTS
(* Some columns may not add to 100% due to rounding.)
[Q1-3 held for future release.]
4.Do you approve or disapprove of the job Joe Biden is doing as president?
| All adults | March 2024 |
|---|---|
| Approve | 43% |
| Disapprove | 54% |
| (VOL) No opinion | 2% |
| (n) | (801) |
| Trend: Registered voters | March 2024 | Aug. 2023 | Jan. 2023 | April 2022 | Oct. 2021 | Aug. 2021 | May 2021 |
|---|---|---|---|---|---|---|---|
| Approve | 44% | 41% | 46% | 47% | 43% | 51% | 55% |
| Disapprove | 53% | 52% | 48% | 49% | 49% | 41% | 40% |
| (VOL) No opinion | 2% | 6% | 6% | 4% | 8% | 9% | 5% |
| (n) | (757) | (778) | (756) | (738) | (1,000) | (810) | (661) |
[QUESTIONS 5 & 6 WERE ROTATED]
5.Do you approve or disapprove of the job Cory Booker is doing as United States Senator?
| All adults | March 2024 |
|---|---|
| Approve | 52% |
| Disapprove | 40% |
| (VOL) No opinion | 8% |
| (n) | (801) |
| Trend: Registered voters | March 2024 | Aug. 2023 | Jan. 2023 | April 2022 | Sept. 2021 | May 2021 | April 2020 | Sept. 2019 | Feb. 2019 |
|---|---|---|---|---|---|---|---|---|---|
| Approve | 53% | 47% | 52% | 55% | 51% | 57% | 51% | 45% | 48% |
| Disapprove | 40% | 40% | 33% | 33% | 32% | 36% | 34% | 40% | 38% |
| (VOL) No opinion | 7% | 13% | 15% | 12% | 17% | 6% | 14% | 16% | 14% |
| (n) | (757) | (778) | (756) | (738) | (804) | (661) | (635) | (651) | (549) |
| Trend: Registered voters continued | April 2018 | July 2017 | May 2016 | July 2015 | May 2015 | Feb. 2015 | Sept. 2014 | June 2014 | April 2014 | Feb. 2014 | Dec. 2013 |
|---|---|---|---|---|---|---|---|---|---|---|---|
| Approve | 54% | 50% | 53% | 45% | 51% | 51% | 42% | 48% | 47% | 47% | 37% |
| Disapprove | 31% | 31% | 21% | 24% | 21% | 21% | 23% | 25% | 23% | 20% | 21% |
| (VOL) No opinion | 15% | 20% | 27% | 31% | 27% | 27% | 35% | 27% | 30% | 32% | 43% |
| (n) | (632) | (758) | (703) | (453) | (441) | (712) | (680) | (717) | (690) | (690) | (698) |
6.Do you approve or disapprove of the job Bob Menendez is doing as United States Senator?
| All adults | March 2024 |
|---|---|
| Approve | 16% |
| Disapprove | 74% |
| (VOL) No opinion | 10% |
| (n) | (801) |
| Trend: Registered voters | March 2024 | Aug. 2023 | Jan. 2023 | April 2022 | Sept. 2021 | May 2021 | April 2020 | Sept. 2019 | Feb. 2019 |
|---|---|---|---|---|---|---|---|---|---|
| Approve | 16% | 36% | 38% | 44% | 43% | 46% | 44% | 37% | 40% |
| Disapprove | 74% | 45% | 38% | 39% | 35% | 38% | 38% | 45% | 45% |
| (VOL) No opinion | 10% | 19% | 24% | 17% | 22% | 16% | 18% | 18% | 15% |
| (n) | (757) | (778) | (756) | (738) | (804) | (661) | (635) | (651) | (549) |
| Trend: Registered voters continued | April 2018 | July 2017 | May 2016 | July 2015 | May 2015 | Feb. 2015 | Sept. 2014 | June 2014 | April 2014 | Feb. 2014 | Dec. 2013 | April 2013 | Feb. 2013 |
|---|---|---|---|---|---|---|---|---|---|---|---|---|---|
| Approve | 37% | 41% | 41% | 38% | 42% | 49% | 45% | 47% | 51% | 49% | 47% | 44% | 41% |
| Disapprove | 38% | 35% | 31% | 38% | 38% | 27% | 30% | 34% | 31% | 30% | 27% | 38% | 31% |
| (VOL) No opinion | 25% | 23% | 28% | 23% | 20% | 24% | 26% | 19% | 18% | 21% | 26% | 18% | 28% |
| (n) | (632) | (758) | (703) | (453) | (441) | (712) | (680) | (717) | (690) | (690) | (698) | (694) | (697) |
| Trend: Registered voters continued | April 2012 | Feb. 2012 | Oct. 2011 | Aug. 2011 | May 2011 | July 2010 | Oct. 2008 | April 2008 | Jan. 2008 |
|---|---|---|---|---|---|---|---|---|---|
| Approve | 40% | 41% | 43% | 38% | 46% | 38% | 34% | 41% | 37% |
| Disapprove | 25% | 26% | 29% | 33% | 28% | 33% | 25% | 31% | 25% |
| (VOL) No opinion | 35% | 33% | 28% | 29% | 26% | 29% | 41% | 28% | 37% |
| (n) | (692) | (709) | (693) | (730) | (725) | (747) | (900) | (720) | (698) |
7.Senator Menendez was recently charged with accepting bribes and acting as a foreign agent. Have you heard a lot, a little, or nothing at all about this?
| Comparison: | March 2024 | May 2015* |
|---|---|---|
| A lot | 54% | 41% |
| A little | 35% | 38% |
| Nothing at all | 11% | 21% |
| (n) | (801) | (500) |
8.Based on what you have heard, do you think Menendez is probably guilty or probably not guilty of these charges?
| Comparison: | March 2024 | May 2015* |
|---|---|---|
| Probably guilty | 75% | 47% |
| Probably not guilty | 5% | 19% |
| (VOL) Don’t know | 9% | 13% |
| Not heard (from Q7) | 11% | 21% |
| (n) | (801) | (500) |
9.As a New Jersey resident, do you think Senator Menendez should resign from office now or should he be allowed to wait and see how the charges against him are settled?
| Comparison: | March 2024 | May 2015* |
|---|---|---|
| Resign now | 63% | 28% |
| Allowed to wait | 33% | 68% |
| (VOL) Don’t know | 4% | 4% |
| (n) | (801) | (500) |
[Q10-13 previously released.]
[Q14-42 held for future release.]
METHODOLOGY
The Monmouth University Poll was sponsored and conducted by the Monmouth University Polling Institute from February 29 to March 4, 2024 with a probability-based random sample of 801 New Jersey adults age 18 and older. Interviews were conducted in English, and included 259 live landline telephone interviews, 375 live cell phone interviews, and 167 online surveys via a cell phone text invitation. Telephone numbers were selected through a mix of random digit dialing and list-based sampling. Landline respondents were selected with a modified Troldahl-Carter youngest adult household screen. Interviewing services were provided by Braun Research, with sample obtained from Dynata (RDD, n= 657) and Aristotle (list, n= 144). Monmouth is responsible for all aspects of the survey design, data weighting and analysis. The full sample is weighted for region, age, education, gender and race based on US Census information (ACS 2021 one-year survey. For results based on this sample, one can say with 95% confidence that the error attributable to sampling has a maximum margin of plus or minus 4.2 percentage points adjusted for sample design effects (1.49). Sampling error can be larger for sub-groups (see table below). In addition to sampling error, one should bear in mind that question wording and practical difficulties in conducting surveys can introduce error or bias into the findings of opinion polls.
NJ Regions (by county)
North – Bergen, Essex, Hudson, Morris, Passaic, Sussex, Union, Warren
Central – Hunterdon, Mercer, Middlesex, Monmouth, Somerset
South – Atlantic, Burlington, Camden, Cape May, Cumberland, Gloucester, Ocean, Salem
Demographics (weighted)
Party (self-reported): 26% Republican, 37% Independent, 37% Democrat
Sex: 49% male, 51% female, 1% other
Age: 28% 18-34, 33% 35-54, 39% 55+
Race: 55% White, 13% Black, 19% Hispanic, 13% Asian/other
Education: 34% high school or less, 25% some college, 23% 4 year degree, 18% graduate degree
Click on pdf file link below for full methodology and crosstabs by key demographic groups.


