West Long Branch, NJ – The race for California’s 48th Congressional District between Republican incumbent Dana Rohrabacher and Democratic challenger Harley Rouda remains tight, according to the Monmouth University Poll. An increase in Republican enthusiasm and an uptick in positive views of President Donald Trump have given Rohrabacher a small boost since Monmouth’s last poll of this district in July. Immigration is the top issue for CA-48 voters which also benefits the Republican. Still, the poll finds the 15-term congressman is facing his toughest re-election fight ever.
Rohrabacher registers 50% support and Rouda has the backing of 48% using a standard midterm likely voter model. Rohrabacher’s share of the vote has grown from 45% in July, while Rouda’s support is virtually unchanged from his 47% share over the summer. The race flips, but is still tight, when applying a model that includes a potential turnout surge in Democratic precincts – 50% for Rouda and 48% for Rohrabacher. A model with lower overall turnout, however, gives the Republican a lead of 52% to 46%. None of the margins in these models are statistically significant.
“This is a district where very small differences in who turns out to vote can have a big impact on the final margin. The high level of diversity in this district means the higher the turnout the better it gets for Rouda,” said Patrick Murray, director of the independent Monmouth University Polling Institute.
Overall interest in this House election has increased from 76% who had a lot of interest in July to 84% currently. Republicans have closed the Democrats’ summer advantage on this measure. Currently 85% of Democrats, 85% of Republicans, and 82% of independents have a lot of interest. In July, this stood at 86% of Democrats, 72% of Republicans, and 70% of independents.
Both candidates have predictable leads among their fellow partisans – Rohrabacher at 93%-7% among Republicans and Rouda at 97%-2% among Democrats – but independents are evenly split at 48% for Rohrabacher and 47% for Rouda. In July, Rouda held a 46%-39% advantage among independents. Rohrabacher leads among white voters without a college degree by 54% to 44%. This margin is smaller than his 58% to 34% advantage with this group in July, but he has countered that by narrowing the gap among groups that have been trending Democratic in the 2018 cycle. Specifically, white voters with a college degree are split at 49% for Rouda and 48% for Rohrabacher – a group the Democrat led by 47%-44% in July. And while Rohrabacher still trails Rouda among non-white voters by 42%-55%, the gap is smaller than the 34%-59% deficit he had in July.
“The winds in this race have started to blow a little more in the Republican’s favor. A big factor in this shift is an uptick in support for the president since the summer,” said Murray.
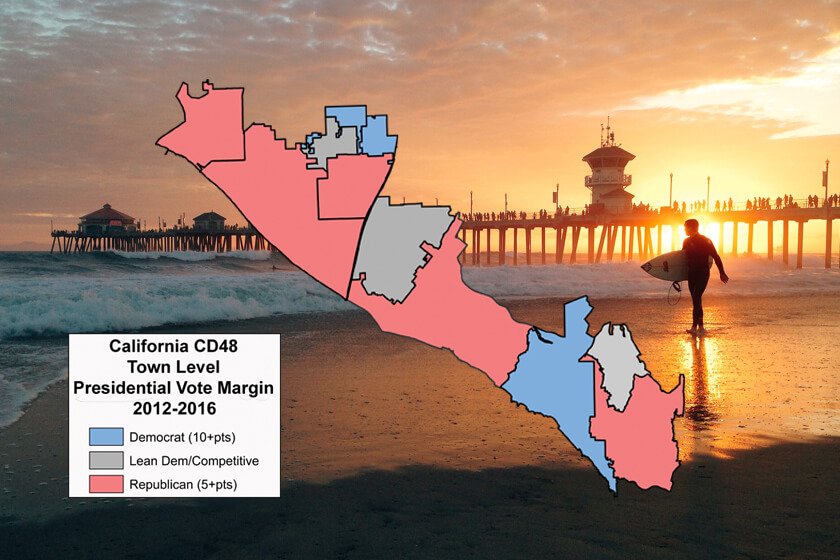
Voter opinion of Donald Trump has improved in California’s 48th, now standing at 54% approve and 46% disapprove, compared with 49% approve and 48% disapprove in July. The poll finds 82% of likely voters say that Trump is a very important factor in their House vote, which includes similar numbers of Trump supporters (87%) and opponents (85%). Donald Trump actually lost this district by 2 points in 2016 while Rohrabacher cruised to one of his typical double digit wins. Mitt Romney won this district by 12 points in 2012. These GOP roots are one reason why CA-48 voters are somewhat more likely to prefer to have Republicans (48%) rather than Democrats (43%) in control of Congress, with just 7% saying party control does not matter to them. This gap was slightly narrower in July when 45% preferred Republican control and 42% preferred Democratic control.
Among six issues asked about in the poll, CA-48 voters choose immigration (33%) as their top concern in the congressional election, followed by health care (26%). Other issues included in the poll are taxes (12%), gun control (8%), job creation (7%), and abortion (5%). Voters are more likely to trust Rohrabacher (46%) over Rouda (38%) to handle illegal immigration, with just 7% saying they trust both candidates equally. Preferences are divided on keeping health care affordable, with 40% trusting Rouda more on this issue and 35% trusting Rohrabacher more, while 10% say they trust both equally.
“In other districts we’ve polled, immigration takes a back seat to health care among voter concerns and the Democratic candidate usually has a clear advantage on it. Neither of those trends apply in this case. Rohrabacher has been successful in focusing the electorate on an issue where he has the edge,” said Murray.
The Republican incumbent has been one of the president’s strongest supporters, especially on issues involving Russia. Over one-third (36%) say Rohrabacher has been too supportive of Trump, while 41% say he has offered the right amount of support to the president and 6% say he has not been supportive enough. In July, 30% said he was too supportive, 32% said he gave the right amount of support, and 10% said he was not supportive enough. The poll also finds that over 1-in-3 (37%) voters say they are concerned that Rohrabacher may be too friendly toward Russia, but a majority (56%) of likely voters are not concerned about this.
“Voters have some misgivings about the incumbent’s behavior, which is helping to make this race competitive. But these concerns are not widespread enough to make this seat an easy pick up for the Democrat,” said Murray.
Voter opinion is split on the incumbent – 37% have a favorable view of Rohrabacher and 39% have an unfavorable view, with 23% expressing no opinion. These results are similar to July when his rating stood at 37% favorable and 40% unfavorable. Over one-third of CA-48 voters (37%) say Rohrabacher’s political views are in line with most residents of the district, while 22% say they are out of step, and 41% are unsure. This has not changed much since Monmouth’s earlier poll when 37% said his views were in line, 19% said out of step, and 44% were unsure.
Businessman Rouda also gets mixed personal ratings at 35% favorable and 29% unfavorable, with 35% expressing no opinion. While the Democrat’s positive rating is close to his summer standing of 33% favorable, his negative number has increased significantly from 16% unfavorable in July. Currently, 23% say Rouda’s political views are in line with most CA-48 residents and 26% say they are out of step, with 51% saying they are unsure. In July, 18% said they were in line, 20% said out of step, and 62% were unsure.
The Monmouth University Poll was conducted by telephone from October 17 to 21, 2018 with 372 likely voters in California’s 48th Congressional District. The question results in this release have a margin of error of +/- 5.1 percentage points. The error of the difference between the two candidates’ vote share (i.e. the “lead”) is +/-7.2 percentage points. The poll was conducted by the Monmouth University Polling Institute in West Long Branch, NJ.
QUESTIONS AND RESULTS
(* Some columns may not add to 100% due to rounding.)
1/2. If the election for U.S. House of Representatives in your district was today, would you vote for Dana Rohrabacher the Republican or Harley Rouda the Democrat? [IF UNDECIDED: If you had to vote for one of the following at this moment, do you lean more toward Dana Rohrabacher or more toward Harley Rouda?] [NAMES WERE ROTATED]
| Likely Voters with leaners |
Oct. 2018 |
July 2018 | ||||
| Standard | Democratic | Low | Standard | Democratic | Low | |
| Dana Rohrabacher | 50% | 48% | 52% | 45% | 44% | 45% |
| Harley Rouda | 48% | 50% | 46% | 47% | 48% | 48% |
| (VOL) Undecided | 2% | 2% | 2% | 8% | 8% | 7% |
| (n) | (372) | (372) | (372) | (361) | (361) | (361) |
[QUESTIONS 3 & 4 WERE ROTATED]
3. Is your general impression of Dana Rohrabacher favorable or unfavorable, or do you have no opinion of him?
| Likely Voter Standard | Oct. 2018 | July 2018 |
| Favorable | 37% | 37% |
| Unfavorable | 39% | 40% |
| No opinion | 23% | 23% |
| (n) | (372) | (361) |
4. Is your general impression of Harley Rouda favorable or unfavorable, or do you have no opinion of him?
| Likely Voter Standard | Oct. 2018 | July 2018 |
| Favorable | 35% | 33% |
| Unfavorable | 29% | 16% |
| No opinion | 35% | 51% |
| (n) | (372) | (361) |
5. How much interest do you have in the upcoming election for House of Representatives – a lot of interest, a little interest, or not much interest at all?
| Likely Voter Standard | Oct. 2018 | July 2018 |
| A lot | 84% | 76% |
| A little | 14% | 17% |
| Not much at all | 2% | 7% |
| (VOL) Don’t know | 1% | 1% |
| (n) | (372) | (361) |
6. Have you been following the campaign in your congressional district very closely, somewhat closely, or not too closely?
| Likely Voter Standard | Oct. 2018 | July 2018 |
| Very closely | 38% | 25% |
| Somewhat closely | 39% | 44% |
| Not too closely | 23% | 32% |
| (VOL) Don’t know | 0% | 0% |
| (n) | (372) | (361) |
7. Do you approve or disapprove of the job Donald Trump is doing as president? [Do you (approve/disapprove) strongly or somewhat?]
| Likely Voter Standard | Oct. 2018 | July 2018 |
| Strongly approve | 48% | 38% |
| Somewhat approve | 6% | 11% |
| Somewhat disapprove | 5% | 7% |
| Strongly disapprove | 41% | 41% |
| (VOL) Don’t know | 1% | 3% |
| (n) | (372) | (361) |
8. On most issues would you say you support or oppose what President Trump is doing?
| Likely Voter Standard | Oct. 2018 | July 2018 |
| Support | 51% | 47% |
| Oppose | 44% | 48% |
| (VOL) Depends/both | 3% | 3% |
| (VOL) Don’t know | 2% | 1% |
| (n) | (372) | (361) |
9. How important is it for you to cast a vote for Congress that shows your [support of/opposition to] President Trump – very important, somewhat important, not too important, or not at all important?
| Likely Voter Standard | Oct. 2018 | July 2018 |
| Very important | 82% | 75% |
| Somewhat important | 8% | 13% |
| Not too important | 2% | 4% |
| Not at all important | 2% | 2% |
| (VOL) Don’t know | 7% | 6% |
| (n) | (372) | (361) |
10. Would you rather see the Republicans or the Democrats in control of Congress, or doesn’t this matter to you?
| Likely Voter Standard | Oct. 2018 | July 2018 |
| Republicans | 48% | 45% |
| Democrats | 43% | 42% |
| Does not matter | 7% | 11% |
| (VOL) Don’t know | 3% | 2% |
| (n) | (372) | (361) |
[QUESTIONS 11 & 12 WERE ROTATED]
11. Are Dana Rohrabacher’s political views generally in line or out of step with most residents in this district, or are you not sure?
| Likely Voter Standard | Oct. 2018 | July 2018 |
| In line | 37% | 37% |
| Out of step | 22% | 19% |
| Not sure | 41% | 44% |
| (n) | (372) | (361) |
12. Are Harley Rouda’s political views generally in line or out of step with most residents in this district, or are you not sure?
| Likely Voter Standard | Oct. 2018 | July 2018 |
| In line | 23% | 18% |
| Out of step | 26% | 20% |
| Not sure | 51% | 62% |
| (n) | (372) | (361) |
13. Please tell me which one of the following policy issues is most important to you in your vote choice for Congress? [ITEMS WERE ROTATED]
| Likely Voter Standard | Oct. 2018 |
| Immigration policy | 33% |
| Health care policy | 26% |
| Gun control policy | 8% |
| Abortion policy | 5% |
| Tax policy | 12% |
| Job creation policy | 7% |
| (VOL) Other | 3% |
| (VOL) Don’t know | 6% |
| (n) | (372) |
[QUESTIONS 14A & 14B WERE ROTATED]
14A. Who do you trust more to work to keep health care affordable – Dana Rohrabacher or Harley Rouda, or do you trust both equally? [NAMES WERE ROTATED]
| Likely Voter Standard | Oct. 2018 |
| Dana Rohrabacher | 35% |
| Harley Rouda | 40% |
| Both equally | 10% |
| (VOL) Neither one | 5% |
| (VOL) Don’t know | 10% |
| (n) | (372) |
14B. Who do you trust more to handle the issue of illegal immigration – Dana Rohrabacher or Harley Rouda, or do you trust both equally? [NAMES WERE ROTATED]
| Likely Voter Standard | Oct. 2018 |
| Dana Rohrabacher | 46% |
| Harley Rouda | 38% |
| Both equally | 7% |
| (VOL) Neither one | 2% |
| (VOL) Don’t know | 7% |
| (n) | (372) |
[QUESTIONS 15 & 16 WERE ROTATED]
15. Has Dana Rohrabacher been too supportive of Donald Trump, not supportive enough, or has he given the right amount of support to Trump?
| Likely Voter Standard | Oct. 2018 | July 2018 |
| Too supportive | 36% | 30% |
| Not supportive enough | 6% | 10% |
| Right amount of support | 41% | 32% |
| (VOL) Don’t know | 17% | 28% |
| (n) | (372) | (361) |
16. Are you concerned or not concerned that Dana Rohrabacher may be too friendly toward Russia? [IF CONCERNED: Are you concerned a lot or a little?]
| Likely Voter Standard | Oct. 2018 |
| Concerned, a lot | 29% |
| Concerned, a little | 8% |
| Not concerned | 56% |
| (VOL) Don’t know | 7% |
| (n) | (372) |
METHODOLOGY
The Monmouth University Poll was sponsored and conducted by the Monmouth University Polling Institute from October 17 to 21, 2018 with a random sample of 372 likely voters in California’s 48th Congressional District, drawn from a list of registered voters who voted in at least one of the last four general or primary elections or have registered to vote since January 2016. This includes 180 contacted by a live interviewer on a landline telephone and 192 contacted by a live interviewer on a cell phone in English. Monmouth is responsible for all aspects of the survey design, data weighting and analysis. Final sample is weighted for region, party registration, age, gender, education and race based on state voter registration list and U.S. Census information. Data collection support provided by Braun Research (field) and L2 (voter sample). For results based on this sample, one can say with 95% confidence that the error attributable to sampling has a maximum margin of plus or minus 5.1 percentage points (unadjusted for sample design). Sampling error can be larger for sub-groups (see table below). In addition to sampling error, one should bear in mind that question wording and practical difficulties in conducting surveys can introduce error or bias into the findings of opinion polls.
| DEMOGRAPHICS (weighted) |
| Party Registration |
| 49% Republican |
| 31% Democrat |
| 20% Neither |
| Self-Reported Party ID |
| 37% Republican |
| 31% Independent |
| 32% Democrat |
| 46% Male |
| 54% Female |
| 12% 18-34 |
| 21% 35-49 |
| 33% 50-64 |
| 34% 65+ |
| 72% White, non-Hispanic |
| 2% Black |
| 14% Hispanic |
| 13% Asian |
| 0% Other |
| 49% No college degree |
| 51% 4-year college degree |
Click on pdf file link below for full methodology and results by key demographic groups.