West Long Branch, NJ – Joe Biden leads Donald Trump in Arizona, making small gains in the past month. The Monmouth (“Mon-muth”) University Poll finds the Democrat maintaining a large advantage among Latino voters and a small edge in all-important Maricopa County. In the race for U.S. Senate, Democrat Mark Kelly has widened his lead over incumbent Martha McSally. Also, support for a proposition to legalize marijuana has increased since last month.
Among all registered voters in Arizona, the race for president stands at 50% for Biden and 44% for Trump. The contest stood at 48% to 44% one month ago and 46% to 43% in a poll taken shortly before the state’s presidential primary in March. Another 2% currently support Jo Jorgensen and 4% are undecided. Biden (42%) trails Trump (51%) among non-Hispanic white voters, but has a large advantage among the state’s sizable Latino electorate (66% to 28%).
Using a likely voter model with a relatively high level of turnout, the race stands at 51% for Biden and 44% for Trump. The race tightens to 49% Biden and 47% Trump when using a likely voter model with lower turnout. Trump beat Hillary Clinton by just under 4 points in 2016. Arizona has given its electoral votes to the Democratic candidate just once (1996) in the past 70 years.
“Biden is currently on track to do slightly better than Clinton did with Latino voters and possibly white voters as well. Those shifts would be enough for a victory if these numbers hold,” said Patrick Murray, director of the independent Monmouth University Polling Institute.
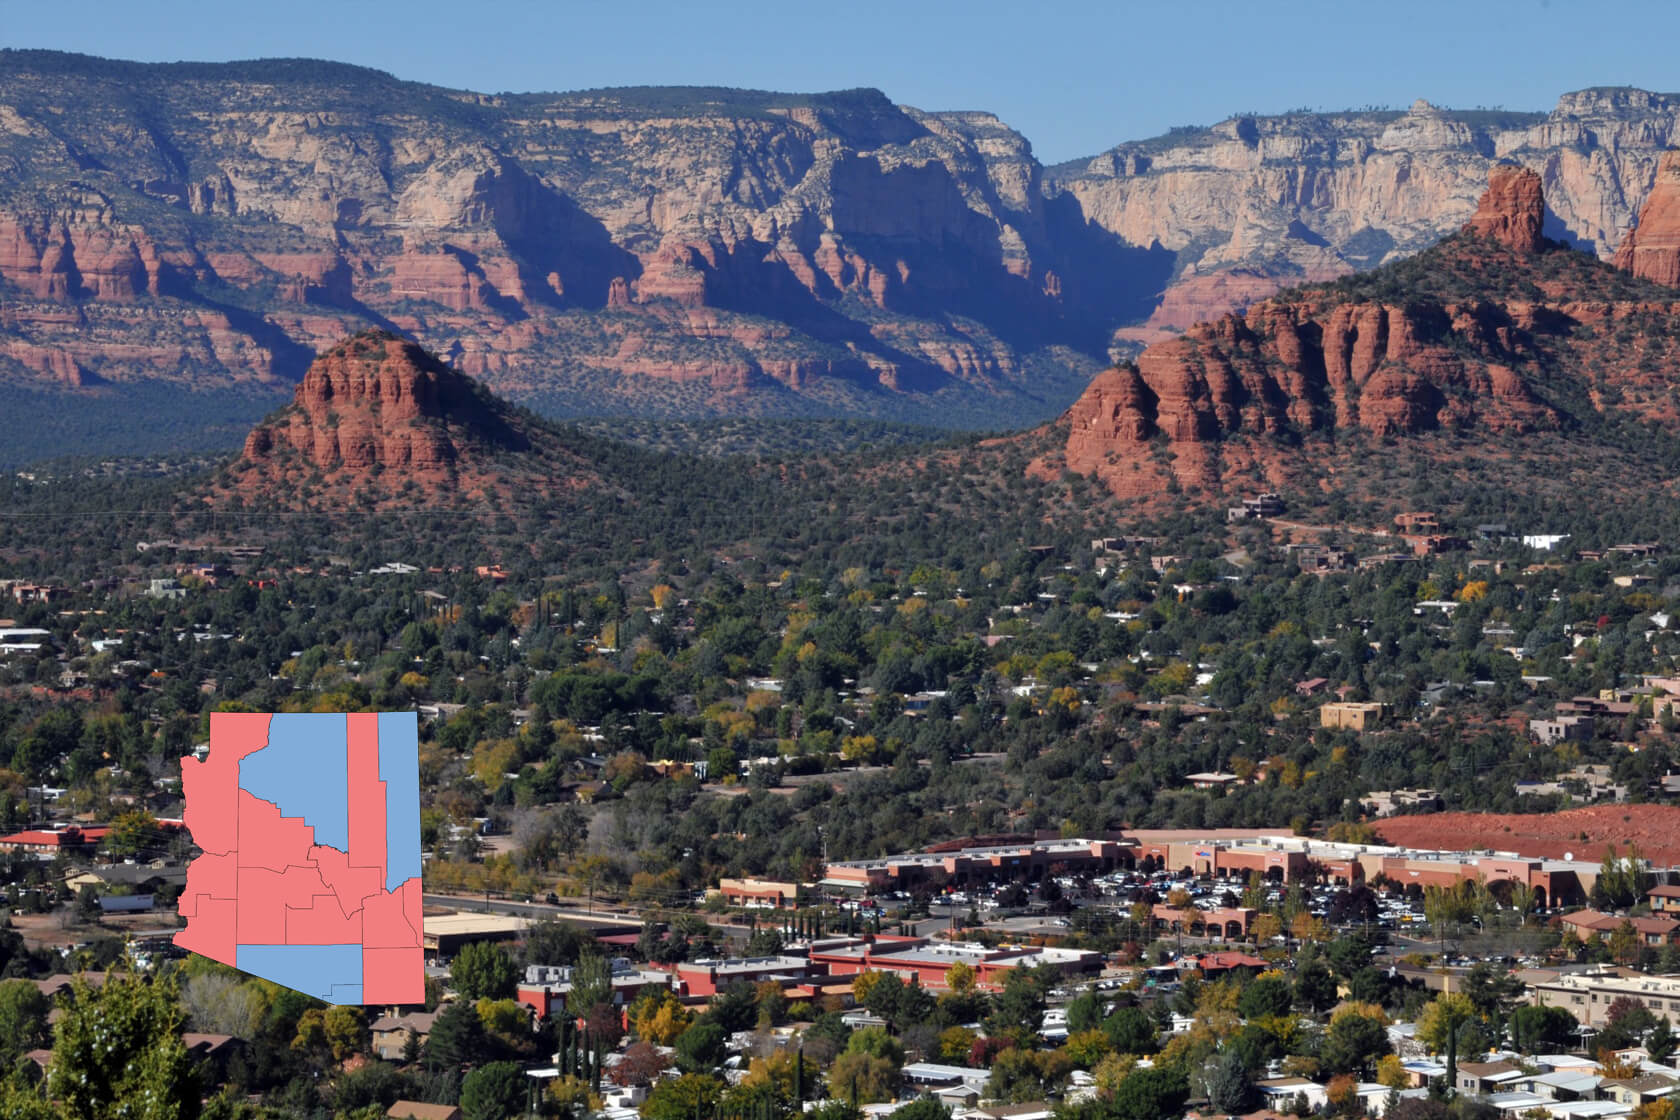
In populous Maricopa County, which alone accounts for about 60% of the state’s electorate, Biden maintains a 7-point lead among registered voters (50% to 43%), similar to his 9-point edge last month. Trump actually won this county by 3 points four years ago. In the four counties Clinton won (Apache, Coconino, Pima, and Santa Cruz) by a cumulative total of 16 points, Biden holds a much larger lead now (61% to 33%). Trump holds a commanding lead in the remaining ten counties (56% to 39%), but this is smaller than his 26-point cumulative victory in these counties four years ago.
| ARIZONA: PRESIDENT | ||||
| Registered voters | High likely turnout | Low likely turnout | ||
| October | ||||
| Biden (D) | 50% | 51% | 49% | |
| Trump (R) | 44% | 44% | 47% | |
| Other | 3% | 2% | 1% | |
| September | ||||
| Biden (D) | 48% | 48% | 47% | |
| Trump (R) | 44% | 46% | 47% | |
| Other | 4% | 3% | 3% | |
| Source: Monmouth University Poll, Oct. 9-13, 2020 | ||||
Of four issues asked about in the poll, the most salient for voters is the potential breakdown of law and order, which 58% of Arizona voters say worries them a lot personally. Just under half worry a lot about the coronavirus pandemic (47%), having access to medical care when they need it (46%) and knowing they will have a stable income over the next year (45%).
When asked who they trust more to maintain law and order, 46% of voters choose Trump and 40% choose Biden. Senior voters aged 65 and older, though, actually give Biden (49%) an edge over Trump (45%) as the candidate they trust more on this issue.
“The Trump campaign has been successful in elevating law and order on voters’ agenda. However, it’s not really working to their advantage among senior voters. This group has historically supported Republicans but appears to be rejecting the Trump message here,” said Murray.
The challenger has an advantage when it comes to voter confidence in handling the pandemic – 48% trust Biden more while 38% trust the incumbent. Biden also has a lead – 47% to 40% – on voter trust in keeping health care affordable and accessible. Trump’s best issue area is creating jobs and strengthening the economy, where he has a 48% to 37% trust advantage over Biden.
Biden has a slight edge on the empathy metric. Just over half (53%) of Arizona voters say he has at least some understanding of the day to day concerns of people like them while just under half (47%) say the same about Trump.
– U.S. Senate race –
In Arizona’s U.S. Senate contest, Kelly leads McSally by 10 points among registered voters (52% to 42%), which is larger than his margins in prior Monmouth polls from September (50% to 44%) and March (50% to 44%). Among likely voters, his lead is 10 points in a high turnout scenario (52% to 42%) and 6 points in a low turnout scenario (51% to 45%). Last month, Kelly held a 4-point lead in the high turnout model and a 1-point lead in the low turnout model.
The biggest demographic shift in Senate preferences has been among voters in different age groups. McSally has gained among voters aged 50 to 64 years old – now leading Kelly by 51% to 45% with this group after trailing by 38% to 56% last month. However, Kelly has pulled ahead among voters under 50 years old – now leading McSally by 56% to 37% after trailing 45% to 48% in September. The Democrat maintains a sizable 55% to 40% advantage among voters aged 65 and older, which is slightly larger than his 53% to 44% lead last month.
| ARIZONA: US SENATE | ||||
| Registered voters | High likely turnout | Low likely turnout | ||
| October | ||||
| Kelly (D) | 52% | 52% | 51% | |
| McSally (R) | 42% | 42% | 45% | |
| September | ||||
| Kelly (D) | 50% | 50% | 49% | |
| McSally (R) | 44% | 46% | 48% | |
| Source: Monmouth University Poll, Oct. 9-13, 2020 | ||||
Kelly gets a net positive rating from registered voters – 44% favorable and 32% unfavorable, which is down slightly from his 48% to 29% rating last month. McSally earns a 33% favorable and 45% unfavorable rating, which is more negative than her divided 40% to 42% rating in September.
More Arizona voters feel that McSally has been too supportive of the president (49%) than say she has given Trump the right amount of support (38%). They are more evenly divided on whether Kelly would be more beholden to the Democratic Party’s left wing (45%) or more of an independent voice (43%) if he were elected. Among independent voters, most feel McSally is too close to Trump (57%, versus 25% who say she gives him the right support), but they are less likely to see Kelly as beholden to the left (37%, versus 51% who say he would be more independent).
“Both campaigns have been trying to paint their opponents in a negative light. Among that all-important group of independent voters, the image of McSally as a rubberstamp for Trump has more resonance than Kelly being portrayed as in lockstep with the left,” said Murray. McSally was appointed to fill the late Sen. John McCain’s seat after losing the race for the state’s other Senate seat two years ago.
– Other poll findings –
The Monmouth University Poll also asked about two propositions on the Arizona ballot this year. Support for a measure to legalize recreational marijuana has grown in the past month. Currently, 56% of registered voters say they will vote for it and 36% will vote against it. In September, these numbers stood at 51% for and 41% against. Among likely voters, support stands at 56% and opposition at 37% in a high turnout scenario and a slightly narrower 54% for and 39% against in a low turnout scenario. A similar measure failed by a vote of 48.7% to 51.3% four years ago. Registered voter support for the current ballot proposition comes from 69% of Democrats and 63% of independents. Just 38% of Republicans say they will vote to legalize marijuana, but this is up from 32% last month.
A measure to impose a 3.5% surcharge on the income tax rate of high-earners in the state to fund teacher pay remains on track for passage despite a drop in Republican support. The vote in favor stands at 60% among registered voters, 58% among high turnout likely voters, and 55% among low turnout likely voters. One-third (34%) of registered voters say they will vote against this. Registered voter opinion stood at 66% for and 25% against in September. Backers of this measure include majorities of Democrats (87% now, 84% in September) and independents (65% now, 67% last month). However, Republican support (31%) has dropped significantly since last month (53%).
Just one-fifth (21%) of Arizona voters plan to wait until November 3rd to cast their ballots. Most are returning their ballots by mail (64%) while 14% intend to vote in person before Election Day. In fact, 19% of those polled say they have already returned their ballots, including 24% of Democrats, 18% of Republicans, and 17% of independents.
The Monmouth University Poll was conducted by telephone from October 9 to 13, 2020 with 502 Arizona registered voters. The question results in this release have a margin of error of +/- 4.4 percentage points. The poll was conducted by the Monmouth University Polling Institute in West Long Branch, NJ.
QUESTIONS AND RESULTS
(* Some columns may not add to 100% due to rounding.)
[Note: Voters who report already casting their ballots were asked, “In the election for X, did you vote for…” for Q1 and Q4, and “Did you vote for or against…” for Q5 and Q6.]
1.If the election for President was today, would you vote for … Donald Trump the Republican, Joe Biden the Democrat, or Jo Jorgensen the Libertarian? [NAMES WERE ROTATED] [If UNDECIDED: If you had to vote for one of the following candidates at this moment, who do you lean toward – Donald Trump or Joe Biden?]
| TREND: REGISTERED VOTERS (with leaners) | Oct. 2020 | Sept. 2020 | March 2020 |
| Donald Trump | 44% | 44% | 43% |
| Joe Biden | 50% | 48% | 46% |
| Jo Jorgensen | 2% | 4% | n/a |
| (VOL) Other candidate | 1% | <1% | 3% |
| (VOL) No one | 0% | 1% | 2% |
| (VOL) Undecided | 4% | 3% | 6% |
| (n) | (502) | (420) | (847) |
[1A. If Trump/Biden voter, ASK: Are you certain about your vote choice, or might you change your mind before election day?]
[QUESTIONS 2 & 3 WERE ROTATED]
2.What is the likelihood that you might vote for Donald Trump in November – very likely, somewhat likely, not too likely, or not at all likely?
| TREND: REGISTERED VOTERS | Oct. 2020 | Sept. 2020 |
| Certain for Trump (from Q1/A) | 41% | 38% |
| Very likely | 1% | 2% |
| Somewhat likely | 4% | 5% |
| Not too likely | 3% | 5% |
| Not at all likely | 49% | 48% |
| (VOL) Don’t know | 2% | 1% |
| (n) | (502) | (420) |
3.What is the likelihood that you might vote for Joe Biden in November – very likely, somewhat likely, not too likely, or not at all likely?
| TREND: REGISTERED VOTERS | Oct. 2020 | Sept. 2020 |
| Certain for Biden (from Q1/A) | 46% | 42% |
| Very likely | 1% | 2% |
| Somewhat likely | 5% | 7% |
| Not too likely | 3% | 3% |
| Not at all likely | 43% | 45% |
| (VOL) Don’t know | 2% | 1% |
| (n) | (502) | (420) |
4.If the election for U.S. Senate was today, would you vote for … Martha McSally the Republican or Mark Kelly the Democrat? [NAMES WERE ROTATED] [If UNDECIDED: If you had to vote for one of the following candidates at this moment, who do you lean toward – Martha McSally or Mark Kelly?]
| TREND: REGISTERED VOTERS (with leaners) | Oct. 2020 | Sept. 2020 | March 2020 |
| Martha McSally | 42% | 44% | 44% |
| Mark Kelly | 52% | 50% | 50% |
| (VOL) Other candidate | <1% | <1% | 1% |
| (VOL) No one | 1% | 1% | 1% |
| (VOL) Undecided | 4% | 4% | 4% |
| (n) | (502) | (420) | (847) |
5.There is a measure on the ballot that would legalize the recreational use of marijuana for adults 21 years of age or older and allow residents to grow up to six marijuana plants for personal use. Marijuana use would be banned in public and a 16 percent tax would be placed on marijuana sold by licensed establishments. Will you vote for or against this measure?
| TREND: REGISTERED VOTERS | Oct. 2020 | Sept. 2020 |
| For | 56% | 51% |
| Against | 36% | 41% |
| (VOL) Will not vote on this | <1% | 3% |
| (VOL) Don’t know | 7% | 6% |
| (n) | (502) | (420) |
6.Another measure on the ballot would impose a 3.5% surcharge on income tax rates paid by single filers making over $250,000 and joint filers making over $500,000. The additional funds will be used to hire and increase salaries of teachers and other school personnel. Will you vote for or against this measure?
| TREND: REGISTERED VOTERS | Oct. 2020 | Sept. 2020 |
| For | 60% | 66% |
| Against | 34% | 25% |
| (VOL) Will not vote on this | 1% | 1% |
| (VOL) Don’t know | 5% | 7% |
| (n) | (502) | (420) |
7.Do you feel optimistic or pessimistic about the 2020 presidential election? [Is that very or somewhat optimistic/pessimistic?]
| TREND: REGISTERED VOTERS | Oct. 2020 | Sept. 2020 |
| Very optimistic | 36% | 32% |
| Somewhat optimistic | 30% | 35% |
| Somewhat pessimistic | 13% | 15% |
| Very pessimistic | 12% | 12% |
| (VOL) Neither, don’t care | 4% | 2% |
| (VOL) Don’t know | 5% | 3% |
| (n) | (502) | (420) |
8.How motivated are you to vote in the November election for president – very motivated, somewhat motivated, or not that motivated?
| TREND: REGISTERED VOTERS | Oct. 2020 | Sept. 2020 |
| Very motivated | 90% | 88% |
| Somewhat motivated | 7% | 8% |
| Not that motivated | 3% | 4% |
| (VOL) Don’t know | 0% | 0% |
| (n) | (502) | (420) |
9.Compared to past elections, are you more enthusiastic than usual, less enthusiastic, or about the same as past elections?
| TREND: REGISTERED VOTERS | Oct. 2020 | Sept. 2020 |
| More enthusiastic | 53% | 48% |
| Less enthusiastic | 9% | 14% |
| About the same | 37% | 36% |
| (VOL) Don’t know | 2% | 1% |
| (n) | (502) | (420) |
[QUESTIONS 10 & 11 WERE ROTATED]
10.How much does Donald Trump understand the day to day concerns of people like you – a great deal, some, not much, or not at all?
| REGISTERED VOTERS | Oct. 2020 |
| Great deal | 30% |
| Some | 17% |
| Not much | 10% |
| Not at all | 42% |
| (VOL) Don’t know | 1% |
| (n) | (502) |
11.How much does Joe Biden understand the day to day concerns of people like you – a great deal, some, not much, or not at all?
| REGISTERED VOTERS | Oct. 2020 |
| Great deal | 26% |
| Some | 27% |
| Not much | 13% |
| Not at all | 33% |
| (VOL) Don’t know | 1% |
| (n) | (502) |
12.For each of the following situations please tell me if it personally worries you a lot, a little, or not at all? [ITEMS WERE ROTATED]
Knowing you will have access to medical care if you need it
| REGISTERED VOTERS | Oct. 2020 |
| A lot | 46% |
| A little | 20% |
| Not at all | 33% |
| (VOL) Don’t know | 1% |
| (n) | (502) |
Knowing you will have a stable income over the next year
| REGISTERED VOTERS | Oct. 2020 |
| A lot | 45% |
| A little | 21% |
| Not at all | 32% |
| (VOL) Don’t know | 2% |
| (n) | (502) |
The possible breakdown of law and order
| REGISTERED VOTERS | Oct. 2020 |
| A lot | 58% |
| A little | 28% |
| Not at all | 13% |
| (VOL) Don’t know | 2% |
| (n) | (502) |
The coronavirus pandemic
| REGISTERED VOTERS | Oct. 2020 |
| A lot | 47% |
| A little | 30% |
| Not at all | 21% |
| (VOL) Don’t know | 1% |
| (n) | (502) |
[QUESTIONS 13-16 WERE ROTATED]
13.Who do you trust more to keep health care affordable and accessible – Donald Trump or Joe Biden, or both equally?
| REGISTERED VOTERS | Oct. 2020 |
| Donald Trump | 40% |
| Joe Biden | 47% |
| Both equally | 9% |
| (VOL) Neither | 3% |
| (VOL) Don’t know | 1% |
| (n) | (502) |
14.Who do you trust more on creating jobs and strengthening the economy – Donald Trump or Joe Biden, or both equally?
| REGISTERED VOTERS | Oct. 2020 |
| Donald Trump | 48% |
| Joe Biden | 37% |
| Both equally | 11% |
| (VOL) Neither | 3% |
| (VOL) Don’t know | 1% |
| (n) | (502) |
15.Who do you trust more on maintaining law and order – Donald Trump or Joe Biden, or both equally?
| REGISTERED VOTERS | Oct. 2020 |
| Donald Trump | 46% |
| Joe Biden | 40% |
| Both equally | 11% |
| (VOL) Neither | 3% |
| (VOL) Don’t know | 1% |
| (n) | (502) |
16.Who do you trust more on handling the coronavirus pandemic – Donald Trump or Joe Biden, or both equally?
| REGISTERED VOTERS | Oct. 2020 |
| Donald Trump | 38% |
| Joe Biden | 48% |
| Both equally | 11% |
| (VOL) Neither | 3% |
| (VOL) Don’t know | 1% |
| (n) | (502) |
[QUESTIONS 17 & 18 WERE ROTATED]
17.Is your general impression of Martha McSally favorable or unfavorable, or don’t you really have an opinion of her?
| TREND: REGISTERED VOTERS | Oct. 2020 | Sept. 2020 | March 2020 |
| Favorable | 33% | 40% | 35% |
| Unfavorable | 45% | 42% | 39% |
| No opinion | 22% | 18% | 26% |
| (n) | (502) | (420) | (847) |
18.Is your general impression of Mark Kelly favorable or unfavorable, or don’t you really have an opinion of him?
| TREND: REGISTERED VOTERS | Oct. 2020 | Sept. 2020 | March 2020 |
| Favorable | 44% | 48% | 41% |
| Unfavorable | 32% | 29% | 17% |
| No opinion | 24% | 22% | 42% |
| (n) | (502) | (420) | (847) |
[QUESTIONS 19 & 20 WERE ROTATED]
19.Do you think Martha McSally has given Donald Trump the right amount of support, or has she been too supportive of the president at times?
| REGISTERED VOTERS | Oct. 2020 |
| Right amount | 38% |
| Too supportive | 49% |
| (VOL) Don’t know | 13% |
| (n) | (502) |
20.Do you think Mark Kelly will be more of an independent voice if he is elected to the Senate, or will he be more beholden to the left wing of the Democratic Party?
| REGISTERED VOTERS | Oct. 2020 |
| Independent voice | 43% |
| Beholden to the left | 45% |
| (VOL) Don’t know | 12% |
| (n) | (502) |
21.How will you vote this year – in person on Election Day, in person at an early voting location, or by mail ballot? [If ALREADY VOTED: How did you vote this year…?]
| TREND: REGISTERED VOTERS | Oct. 2020 | Sept. 2020 |
| In person on Election Day | 21% | 24% |
| In person at an early voting location | 14% | 10% |
| By mail ballot | 64% | 62% |
| (VOL) Won’t vote at all | 0% | 1% |
| (VOL) Don’t know | 1% | 3% |
| (n) | (502) | (420) |
22.Overall, how confident are you that the November election will be conducted fairly and accurately – very confident, somewhat confident, not too confident, or not at all confident?
| TREND: REGISTERED VOTERS | Oct. 2020 | Sept. 2020 |
| Very confident | 22% | 24% |
| Somewhat confident | 45% | 41% |
| Not too confident | 24% | 23% |
| Not at all confident | 8% | 11% |
| (VOL) Don’t know | 2% | 2% |
| (n) | (502) | (420) |
METHODOLOGY
The Monmouth University Poll was sponsored and conducted by the Monmouth University Polling Institute from October 9 to 13, 2020 with a statewide random sample of 502 Arizona voters drawn from a list of registered voters. This includes 130 contacted by a live interviewer on a landline telephone and 372 contacted by a live interviewer on a cell phone, in English and Spanish. Monmouth is responsible for all aspects of the survey design, data weighting and analysis. The full sample is weighted for party registration, age, gender, race, education, and region based on state voter registration list information and U.S. Census information (CPS 2018 supplement). Data collection support provided by Braun Research (field) and Aristotle (voter sample). For results based on the full voter sample, one can say with 95% confidence that the error attributable to sampling has a maximum margin of plus or minus 4.4 percentage points (unadjusted for sample design). Sampling error can be larger for sub-groups (see table below). In addition to sampling error, one should bear in mind that question wording and practical difficulties in conducting surveys can introduce error or bias into the findings of opinion polls.
| DEMOGRAPHICS (weighted) |
| REGISTERED VOTERS |
| Party Registration |
| 36% Republican |
| 32% Other/none |
| 32% Democrat |
| Self-Reported Party |
| 32% Republican |
| 41% Independent |
| 27% Democrat |
| 48% Male |
| 52% Female |
| 20% 18-34 |
| 26% 35-49 |
| 29% 50-64 |
| 26% 65+ |
| 71% White, non-Hispanic |
| 3% Black |
| 22% Hispanic |
| 2% Asian |
| 3% Other race |
| 65% No degree |
| 35% 4 year degree |
Click on pdf file link below for full methodology and crosstabs by key demographic groups.