West Long Branch, NJ – Three in ten Americans now believe the nation’s system is fundamentally unsound, according to the Monmouth (“Mon-muth”) University Poll. This number has increased from prior polls while one-third of the public continues to believe voter fraud determined the outcome of the 2020 election, a finding that has been consistent over the past year. A GOP-sponsored audit of Arizona election results did more to reinforce this belief than dispel it. The poll also finds that half of Americans support greater regulation of Facebook, with majority support among most groups – except for Republicans and independents who use the platform.
Fewer than half of all Americans believe that the American system of government is basically sound and needs either no changes (8%) or some improvement (35%). The combined 43% who feel the system is basically sound is nearly identical to 44% who said the same shortly after the U.S. Capitol riot in January. Polls over the prior three years had this number higher – between 50% and 55% basically sound. An older Opinion Research Corporation poll, from which this question was taken, showed faith in the system being sound at a significantly higher level in 1980 (62%).
In the current poll, 26% say the system is not too sound and needs many improvements. This is down from 33% in January, but the shift in opinion has resulted in more rather than less negative views. Specifically, 30% feel that the American system is not sound at all and needs significant changes. This number stood at 22% in January 2021 and ranged between 21% and 24% in polls taken between 2017 and 2020. Four decades ago, only 10% of the country said the American system was not at all sound.
“The increase of distrust in the American system appears to be linked to the persistence of ‘the big lie.’ The fact that this belief continues to get oxygen is having a serious, and potentially dangerous, impact on faith in our fundamental democratic processes,” said Patrick Murray, director of the independent Monmouth University Polling Institute.
About one-third (32%) of the American public continues to believe that President Joe Biden won the 2020 election only due to voter fraud – a number that has not budged across five polls in which Monmouth asked this question during the past year. Nearly 3 in 4 Republicans (73%) cling to the idea that Biden won through fraud. Among all voters who believe fraud determined the 2020 outcome, nearly half (45%) also say that the American system is not at all sound. Among the 6 in 10 Americans who believe Biden won the election fair and square, far fewer (23%) feel that way.
The GOP-backed “audit” of the 2020 Arizona election results released in late September concluding that Biden won that state fairly has been rejected by most Republicans. Overall, a majority of Americans say the review did in fact show that Biden won Arizona fairly (36%) or say they are not sure about the report but guess it probably arrived at that conclusion (21%). On the other hand, 13% of the public claims the review turned up significant evidence of voter fraud while 16% say they are not sure but it probably found fraud. Among Republicans, 32% say the so-called audit found evidence of fraud and 30% say it probably did.
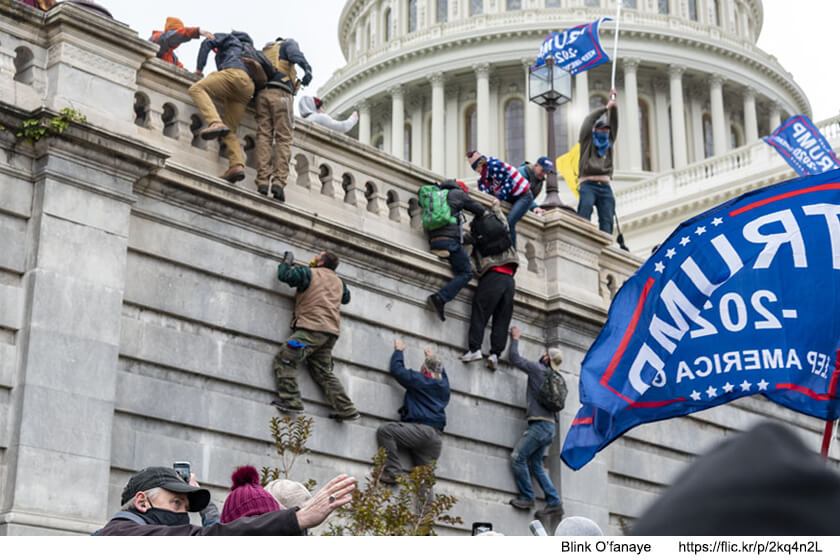
Looking back at the riot at the U.S Capitol on January 6th, about 1 in 4 Americans (27%) say that the anger that led to this incident was at least partially justified, including a majority of Republicans (54%). Just over half of the public has either a lot (26%) or a little (31%) trust that the House Select Committee set up to examine this incident will conduct a fair investigation. Most Republicans (75%) have no trust at all in the committee.
Most Americans approve of having the select committee look into whether members of Congress (73%) or former President Donald Trump (67%) played a role in the incident along with looking into possible fraud in the 2020 election (60%). Majorities of Republicans support having the committee investigate possible election fraud (70%) and the role members of Congress may have played (58%), but only 40% approve of the committee looking into anything that could implicate Trump. About 9 in 10 Democrats approve of an inquiry into the role played by Trump (91%) and members of Congress (89%), while nearly half say the same about looking into possible election fraud (47%).
“Democrats do not believe that Biden won through fraud, as the poll results clearly show. The fact that nearly half want to see an investigation into possible fraud likely stems from their hopes that it would put the false claims to rest. But as the experience from the so-called Arizona audit shows, that outcome is highly unlikely and America will remain divided on this,” said Murray
About half (49%) of all Americans feel the country has become more divided since Biden took office. Just 12% say we have become more united and 38% say nothing has really changed. While these results are largely negative, they are somewhat better than feelings about our political rift under Biden’s predecessor. At a similar point in Trump’s term, 63% said the country had become more divided. That sentiment topped out at 70% right after the 2020 election. Unsurprisingly, a larger number of Republicans say that the country has become more divided under Biden (78%) than did under Trump a year ago (49%). Far fewer Democrats say that the country has become more divided under the current president from their own party (22%) while more felt that way about the president from the opposite party last year (90%). However, only 25% of Democrats see the country as becoming more united since Biden took office; half (52%), in fact, say nothing has changed.
The Monmouth University Poll also looked into usage of Facebook for political content. Even though Republicans are not significantly more likely than Democrats to use the social media platform, they are twice as likely to read items about politics there on a daily basis (24% for Republicans and 12% for Democrats). About 3 in 4 Americans (77%) of all partisan stripes feel Facebook does a bad job monitoring its content. However, Republicans (53%) are more likely to say Facebook does a bad job because its monitoring goes too far, while most Democrats (66%) say it does a bad job because it does not go far enough. This partisan pattern is fairly consistent regardless of frequency of Facebook usage.
About half of the American public (51%) would support greater government regulation of how Facebook operates, while 36% would oppose. Two-thirds of Democrats support greater regulation regardless of whether they use Facebook (66%) or not (69%). Republicans, on the other hand, are divided with 53% of those who do not use the platform supporting greater government regulation but just 34% of GOP Facebook users agree. There is also a gap in this support, albeit smaller, among independents who do not use the platform (55%) versus those who do (42%).
The Monmouth University Poll was conducted by telephone from November 4 to 8, 2021 with 811 adults in the United States. The question results in this release have a margin of error of +/- 3.5 percentage points. The poll was conducted by the Monmouth University Polling Institute in West Long Branch, NJ.
QUESTIONS AND RESULTS
(* Some columns may not add to 100% due to rounding.)
[Q1-16 previously released.]
17.Has the country become more united, more divided, or not really changed since President Biden took office?
| COMPARISON: Under Donald Trump | ||||||||
| Nov. 2021 | Nov. 2020 | Late June 2020 | Nov. 2018 | Dec. 2017 | March 2017 | |||
| More united | 12% | 12% | 13% | 11% | 9% | 11% | ||
| More divided | 49% | 70% | 66% | 62% | 63% | 52% | ||
| Not really changed | 38% | 16% | 17% | 25% | 26% | 34% | ||
| (VOL) Don’t know | 1% | 2% | 4% | 3% | 2% | 3% | ||
| (n) | (811) | (810) | (867) | (802) | (806) | (801) | ||
18.I’m going to read four statements about our American system of government. Listen carefully and then tell me which one is closest to how you feel: our system of government is basically sound and essentially needs no changes, our system is basically sound, but needs some improvement, our system is not too sound and needs many improvements, or our system is not sound at all and needs significant changes?
| TREND: | Nov. 2021 | Jan. 2021 | Feb. 2020 | Nov. 2018 | Dec. 2017 | Nov. 1980* |
| Basically sound, no changes | 8% | 7% | 9% | 10% | 7% | 6% |
| Basically sound, some improvement | 35% | 37% | 46% | 42% | 43% | 56% |
| Not too sound, many improvements | 26% | 33% | 24% | 26% | 25% | 27% |
| Not sound at all, significant changes | 30% | 22% | 21% | 22% | 24% | 10% |
| (VOL) Don’t know | 1% | 0% | 1% | 1% | 2% | 1% |
| (n) | (811) | (809) | (902) | (802) | (806) | (1,103) |
* Source: Opinion Research Corporation
19.Do you believe Joe Biden won the 2020 election fair and square, or do you believe that he only won it due to voter fraud?
| TREND: | Nov. 2021 | June 2021 | March 2021 | Jan. 2021 | Nov. 2020 |
| Fair and square | 62% | 61% | 62% | 65% | 60% |
| Due to voter fraud | 32% | 32% | 32% | 32% | 32% |
| (VOL) Biden won’t be declared | n/a | n/a | n/a | n/a | 2% |
| (VOL) Don’t know | 5% | 7% | 6% | 3% | 6% |
| (n) | (811) | (810) | (802) | (809) | (810) |
20.Just over a month ago, Republicans in Arizona completed an audit of the 2020 election results in that state. Based on what you have heard of this audit, did it find significant evidence of voter fraud, did it find that Biden won Arizona fairly, did it find some evidence for both, or are you not sure what it found? [If NOT SURE: If you had to guess, do you think the audit probably found evidence of fraud or probably found that Biden won fairly?]
| Nov. 2021 | |
| Significant evidence of voter fraud | 13% |
| Not sure, probably fraud | 16% |
| Biden won Arizona fairly | 36% |
| Not sure, probably fair | 21% |
| Both | 7% |
| Not sure, no guess | 7% |
| (n) | (811) |
21.Thinking back to the riot at the U.S. Capitol in January… Regardless of the actual actions taken, do you think the anger over the presidential election that led to this incident was fully justified, partially justified, or not at all justified?
| TREND: | Nov. 2021 | March 2021 |
| Fully justified | 9% | 8% |
| Partially justified | 18% | 18% |
| Not at all justified | 69% | 70% |
| (VOL) Don’t know | 4% | 4% |
| (n) | (811) | (802) |
22.The House of Representatives created a select committee to investigate the U.S. Capitol incident. How much do you trust the House committee to conduct a fair investigation – a lot, a little, or not at all?
| Nov. 2021 | |
| A lot | 26% |
| A little | 31% |
| Not at all | 41% |
| (VOL) Don’t know | 2% |
| (n) | (811) |
23.The House committee can look into a number of different issues related to the incident. For each one I mention, please tell me if you approve or disapprove of the committee looking into it. [ITEMS WERE ROTATED]
| TREND: | Approve | Disapprove | (VOL) Don’t know | (n) |
| Possible fraud in the 2020 election | 60% | 37% | 3% | (811) |
| — June 2021* | 58% | 40% | 1% | (810) |
| — March 2021* | 59% | 39% | 2% | (802) |
| Whether former President Trump played a role in the incident | 67% | 30% | 3% | (811) |
| — June 2021* | 66% | 32% | 2% | (810) |
| — March 2021 | n/a | n/a | n/a | n/a |
| Whether members of Congress played a role in the incident | 73% | 23% | 4% | (811) |
| — June 2021 | n/a | n/a | n/a | n/a |
| — March 2021 | n/a | n/a | n/a | n/a |
* Question wording was “An independent commission could look into…”
[Q24A/B previously released.]
25.Do you currently use the social media platform Facebook, or not? [If YES:] And how often do you read items about politics on Facebook – every day, a few times a week, a few times a month, or less often?
| Nov. 2021 | |
| Every day | 15% |
| Few times a week | 14% |
| Few times a month | 7% |
| Less often | 20% |
| Do not use Facebook | 43% |
| (VOL) Don’t know | 1% |
| (n) | (811) |
26.Based on what you know or have heard, does Facebook do a good job or bad job monitoring the content of what people post on it? [If BAD JOB: Does Facebook’s monitoring go too far or not far enough?]
| TREND: | Nov. 2021 | June 2020 |
| Good job | 13% | 32% |
| Bad job, too far | 32% | 25% |
| Bad job, not far enough | 41% | 31% |
| (VOL) Bad job, not sure | 4% | 3% |
| (VOL) Don’t know | 10% | 10% |
| (n) | (811) | (807) |
27.Would you support or oppose greater government regulation of how Facebook operates?
| Nov. 2021 | |
| Support | 51% |
| Oppose | 36% |
| (VOL) Depends | 3% |
| (VOL) Don’t know | 10% |
| (n) | (811) |
[Q28-39 previously released.]
[Q40-44 held for future release.]
METHODOLOGY
The Monmouth University Poll was sponsored and conducted by the Monmouth University Polling Institute from November 4 to 8, 2021 with a national random sample of 811 adults age 18 and older. This includes 283 contacted by a live interviewer on a landline telephone and 528 contacted by a live interviewer on a cell phone, in English. Telephone numbers were selected through a mix of random digit dialing and list-based sampling. Landline respondents were selected with a modified Troldahl-Carter youngest adult household screen. Monmouth is responsible for all aspects of the survey design, data weighting and analysis. The full sample is weighted for region, age, education, gender and race based on US Census information (ACS 2018 one-year survey). Data collection support provided by Braun Research (field), Dynata (RDD sample), and Aristotle (list sample). For results based on this sample, one can say with 95% confidence that the error attributable to sampling has a maximum margin of plus or minus 3.5 percentage points (unadjusted for sample design). Sampling error can be larger for sub-groups (see table below). In addition to sampling error, one should bear in mind that question wording and practical difficulties in conducting surveys can introduce error or bias into the findings of opinion polls.
| DEMOGRAPHICS (weighted) |
| Self-Reported |
| 27% Republican |
| 43% Independent |
| 31% Democrat |
| 49% Male |
| 51% Female |
| 30% 18-34 |
| 32% 35-54 |
| 38% 55+ |
| 63% White |
| 12% Black |
| 16% Hispanic |
| 8% Asian/Other |
| 69% No degree |
| 31% 4 year degree |
Click on pdf file link below for full methodology and crosstabs by key demographic groups.


