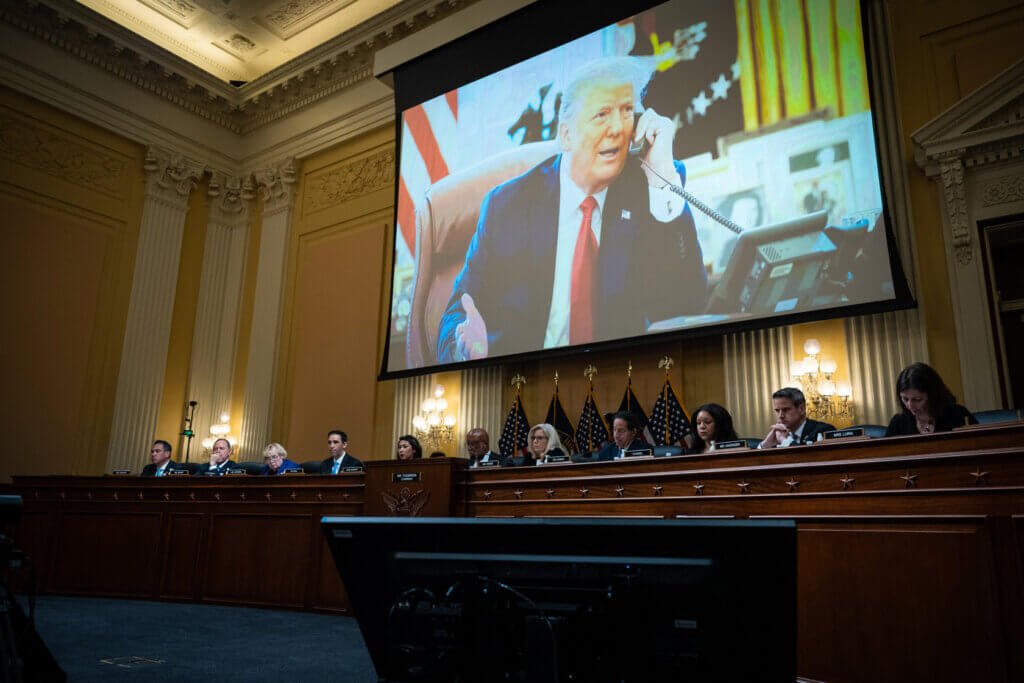
West Long Branch, NJ – Opinion on Donald Trump’s involvement in the January 2021 attack on the U.S. Capitol has not moved after what was billed as the final public hearing of the House committee investigating the incident. However, most Americans feel the former president should have to appear before the committee and that any such testimony should happen in public. The latest national Monmouth (“Mon-muth”) University Poll also finds the public is evenly divided on whether Trump’s continued presence in American politics poses a danger to our democracy.
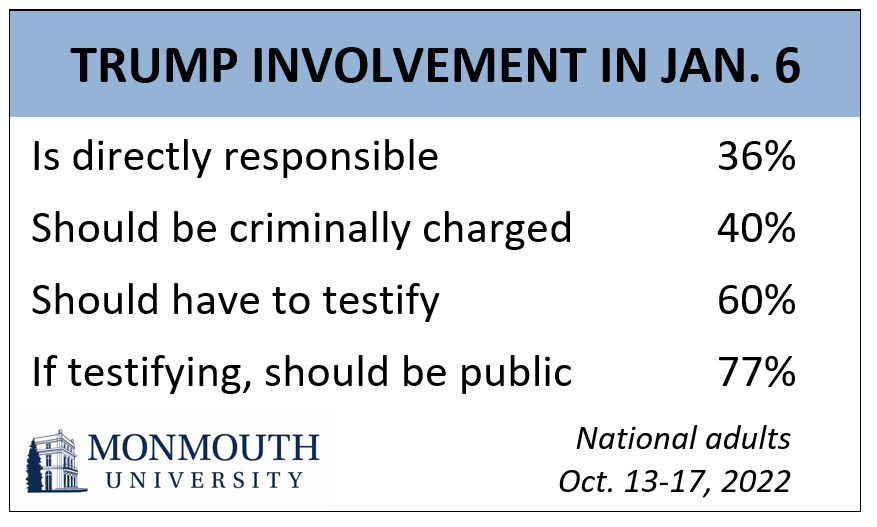
Six in 10 Americans (60%) say Trump should have to testify before the House Committee investigating the Jan. 6 attack. This includes 89% of Democrats and 61% of independents. Just one-third of the public (34%) says he should not have to appear, which includes 67% of Republicans. If Trump does testify, partisans of all stripes agree that his appearance should occur at a public hearing – 77% overall, including 8 in 10 Democrats and independents and nearly two-thirds of Republicans.
Despite the committee’s newsmaking subpoena last week, opinion of Trump’s involvement in the attack on the Capitol has not moved since the summer. Currently, 36% of the public says Trump is directly responsible for what happened, 27% feel Trump encouraged those involved but is not directly responsible, and 33% feel he has done nothing wrong regarding the Jan. 6 attack. Four in 10 Americans (40%) favor charging Trump with crimes related to his involvement in the incident, which has been stable since August. Another 38% are opposed to criminal charges. This number has increased slightly (from 34%) as more Republicans have moved from being unsure of whether to charge Trump (13% currently, down from 31% in August) to opposing criminal charges (79% now, up from 66% in August).
“If anything, the House hearings seem to have driven Republicans further into the Trump camp,” said Patrick Murray, director of the independent Monmouth University Polling Institute.
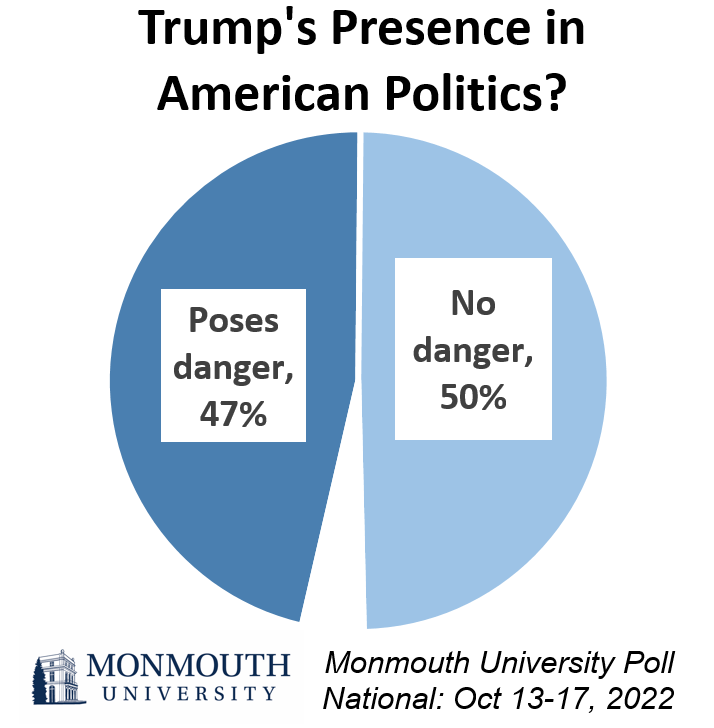
Americans are divided on the impact of Trump’s continued presence in the country’s political life – 47% say this poses an actual danger to American democracy while 50% disagree. Nearly 9 in 10 Democrats (85%) say Trump poses a danger and about the same number of Republicans (86%) say he does not. Independents tilt toward saying Trump’s political activity does not pose a danger (55%) rather than does (42%).
In other poll findings, just 1 in 4 Americans (26%) say the House investigation of the Jan. 6 incident at the U.S. Capitol has helped to strengthen American democracy, while more (35%) say it has actually helped to weaken our democracy. Another 33% feel the investigation has had no impact on American democracy.
Trust in the House Jan. 6 committee has remained stable since public hearings got underway this summer. One-third (34%) has a lot of trust that the committee is conducting a fair investigation – a number that has hovered at 34% to 35% since June. Another 20% currently trust the committee’s fairness a little and 44% do not trust it at all.
“The committee’s efforts to paint Trump as a clear and present danger have not really hit the mark. That is due in part to the fact it is preaching to the choir according to the demographics of who has been paying attention,” said Murray.
Just 27% have been following the select committee’s public hearings a lot, 37% have been following them a little, and 37% have not been following them at all. Those following a lot include nearly half of Democrats (46%), but far fewer Republicans (17%) and independents (21%). Only 8% of Americans say the hearings have changed their minds about what happened or who was responsible – and these people are more likely to be Democrats (15%) than Republicans (3%). Poll results about who has been following the hearings and whether these proceedings have changed any minds have been very stable since the summer.
A majority of Americans (54%) say the House committee should wrap up its investigation as soon as possible and another 10% want it wrapped up in the next year. Only about a third (32%) of the public feels the committee should continue its investigation for as long as necessary.
The Monmouth University Poll was conducted by telephone from October 13 to 17, 2022 with 808 adults in the United States. The question results in this release have a margin of error of +/- 5.2 percentage points for the full sample. The poll was conducted by the Monmouth University Polling Institute in West Long Branch, NJ.
QUESTIONS AND RESULTS
(* Some columns may not add to 100% due to rounding.)
[Q1-18 held for future release.]
19.As you may know, the House of Representatives created a select committee to investigate the U.S. Capitol incident that has been holding public hearings. How much have you been following these hearings – a lot, a little, or not at all?
| TREND: | Oct. 2022 | Aug. 2022* | June 2022* |
| A lot | 27% | 23% | 23% |
| A little | 37% | 38% | 40% |
| Not at all | 37% | 39% | 37% |
| (n) | (808) | (808) | (978) |
* Prior poll wording: “… has recently been holding …”
20.How much do you trust that the House committee is conducting a fair investigation – a lot, a little, or not at all?
| TREND: | Oct. 2022 | Sept. 2022 | Aug. 2022 | June 2022 | Nov. 2021* |
| A lot | 34% | 34% | 35% | 34% | 26% |
| A little | 20% | 24% | 26% | 22% | 31% |
| Not at all | 44% | 39% | 36% | 41% | 41% |
| (VOL) Don’t know | 2% | 3% | 3% | 3% | 2% |
| (n) | (808) | (806) | (808) | (978) | (811) |
* Nov 2021 wording: “How much do you trust the House committee to conduct a fair investigation …?”
21.Have the House January 6 Committee hearings changed your mind about what happened at the Capitol that day or who is responsible, or have the hearings not changed your mind?
| TREND: | Oct. 2022 | Aug. 2022* | June 2022* |
| Yes, have | 8% | 8% | 6% |
| No, have not | 86% | 89% | 90% |
| (VOL) Don’t know | 5% | 3% | 4% |
| (n) | (808) | (808) | (978) |
* Prior poll wording: “Have the recent House …?”
22.Do you think the committee should continue its investigation as long as necessary, should plan to wrap up the investigation sometime in the next year, or should wrap up the investigation as soon as possible?
| TREND: | Oct. 2022 | Sept. 2022 |
| Continue as long as necessary | 32% | 35% |
| Wrap up in the next year | 10% | 11% |
| Wrap up as soon as possible | 54% | 51% |
| (VOL) Don’t know | 4% | 3% |
| (n) | (808) | (806) |
23.Has the committee’s investigation helped to strengthen American democracy, helped to weaken American democracy, or has had no impact on American democracy?
| TREND: | Oct. 2022 | Sept. 2022 |
| Strengthen | 26% | 25% |
| Weaken | 35% | 34% |
| No impact | 33% | 35% |
| (VOL) Don’t know | 6% | 6% |
| (n) | (808) | (806) |
24.Do you think Donald Trump is (a) directly responsible for January 6th, (b) encouraged those involved in January 6th but was not directly responsible for their actions, or (c) did nothing wrong regarding January 6th?
| TREND: | Oct. 2022 | Sept. 2022 | Aug. 2022 | June 2022 |
| Directly responsible | 36% | 38% | 38% | 42% |
| Encouraged those involved | 27% | 25% | 26% | 25% |
| Did nothing wrong | 33% | 33% | 32% | 30% |
| (VOL) Don’t know | 3% | 4% | 3% | 3% |
| (n) | (808) | (806) | (808) | (978) |
25.Do you favor or oppose charging Trump with crimes related to his involvement in January 6th, or are you not sure?
| TREND: | Oct. 2022 | Sept. 2022 | Aug. 2022 |
| Favor | 40% | 41% | 41% |
| Oppose | 38% | 34% | 34% |
| Not sure | 21% | 25% | 25% |
| (n) | (808 | (806) | (808) |
26.Should Donald Trump have to testify before the House committee, or not?
| Oct. 2022 | |
| Should have to | 60% |
| Should not | 34% |
| (VOL) Don’t know | 6% |
| (n) | (808) |
27.If Trump appears before the committee, should it be in a public hearing or a private hearing?
| Oct. 2022 | |
| Public | 77% |
| Private | 17% |
| (VOL) Don’t know | 6% |
| (n) | (808) |
28.Regardless of what you think of Trump’s involvement in the January 6th incident, do you think his continued presence in American political life poses an actual danger to American democracy, or not?
| Oct. 2022 | |
| Yes, poses danger | 47% |
| No, does not pose danger | 50% |
| (VOL) Don’t know | 3% |
| (n) | (808) |
METHODOLOGY
The Monmouth University Poll was sponsored and conducted by the Monmouth University Polling Institute from October 13 to 17, 2022 with a probability-based national random sample of 808 adults age 18 and older. This includes 284 contacted by a live interviewer on a landline telephone and 524 contacted by a live interviewer on a cell phone, in English. Telephone numbers were selected through a mix of random digit dialing and list-based sampling. Landline respondents were selected with a modified Troldahl-Carter youngest adult household screen. Interviewing services were provided by Braun Research, with sample obtained from Dynata (RDD, n=584), Aristotle (list, n=143) and a panel of prior Monmouth poll participants (n=81). Monmouth is responsible for all aspects of the survey design, data weighting and analysis. The full sample is weighted for region, age, education, gender and race based on US Census information (ACS 2018 one-year survey). For results based on this sample, one can say with 95% confidence that the error attributable to sampling has a maximum margin of plus or minus 5.2 percentage points (adjusted for sample design effects). Sampling error can be larger for sub-groups (see table below). In addition to sampling error, one should bear in mind that question wording and practical difficulties in conducting surveys can introduce error or bias into the findings of opinion polls.
DEMOGRAPHICS (weighted) |
| Self-Reported |
| 26% Republican |
| 45% Independent |
| 29% Democrat |
| 49% Male |
| 51% Female |
| 30% 18-34 |
| 33% 35-54 |
| 37% 55+ |
| 63% White |
| 12% Black |
| 16% Hispanic |
| 9% Asian/Other |
| 69% No degree |
| 31% 4 year degree |


