
West Long Branch, NJ – In a television appearance last month, President Joe Biden said, “The pandemic is over.” Only 1 in 5 Americans would make that kind of blanket declaration about Covid-19, but the latest Monmouth (“Mon-muth”) University Poll finds most feel it is time to put pandemic-era restrictions – such as mask and vaccine mandates – behind us. The poll also finds that uptake of the new bivalent booster shot may not be as widespread as it was for the initial boosters.
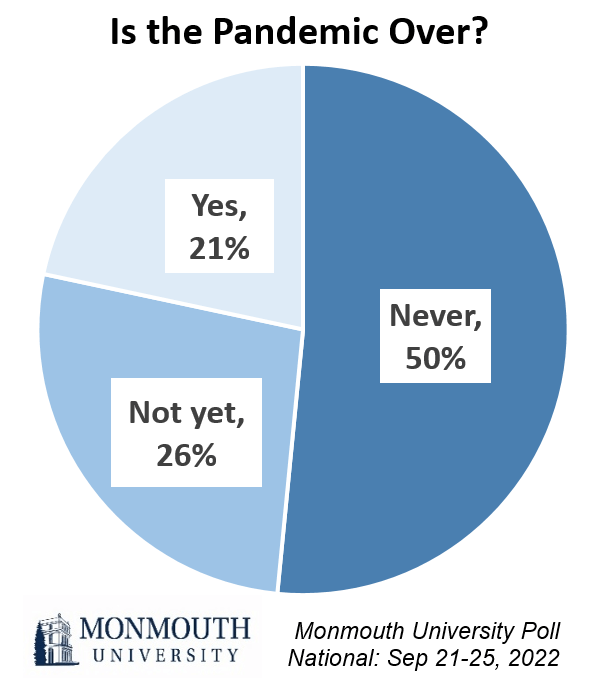
Just 21% of the public says the Covid pandemic is over, while another 26% say it is not over yet but will end eventually. However, half (50%) of the country feels the pandemic will never be over and we will just have to live with it.
“On the face of it, few Americans would declare the pandemic over, but that may just be a matter of semantics. If you listen to what the president said, he was referring to the idea that we no longer need to let Covid infringe on our daily routine. On that measure, most Americans agree with him,” said Patrick Murray, director of the independent Monmouth University Polling Institute.
Only 35% of the public support requiring people to show proof of vaccination in order to work in an office or around other people. This number has been dropping steadily over the past 12 months – declining by 7 points since May and down from a majority of 53% who supported workplace vaccine mandates in September 2021. Even fewer people (25%) support instituting, or reinstituting, face mask and social distancing guidelines, which is also down 7 points from May. One year ago, a majority (63%) supported this measure.
Support for Covid regulations is down among all partisan groups, although with some key differences. A clear majority of Democrats continue to support workplace vaccine mandates (73%, down slightly from 83% one year ago), but only 45% support bringing back face mask and social distancing guidelines. Support for this latter measure among Democrats has been cut in half since last year (91%) and marks the first time in Monmouth’s polling that a majority of Democrats do not back social distancing guidelines. Just 1 in 10 Republicans support either vaccine (8%) or mask mandates (12%), which is down from about 3 in 10 last year.
“You can understand the drop in support for mask mandates since people want to get on with their lives, but the decline in support for vaccine mandates is interesting. I think it might be because people continue to get Covid despite being vaccinated,” said Murray.
Just under half (46%) of the adult population has tested positive for Covid according to the poll. This number was 35% in May and 27% in January. There is little difference in reported Covid prevalence by vaccination status. Just under half of those who have received at least one vaccine dose (46%) as well as those who have not been vaccinated (49%) report testing positive for Covid. At the beginning of the year there was a notable gap, with just 1 in 4 vaccinated adults (24%) having tested positive compared with 4 in 10 unvaccinated adults (39%).
The poll also finds that fewer people plan to get the new bivalent booster shot when compared with a year ago when the first boosters were approved. Just 1 in 3 adults are very likely to get the new booster (33% plus another 1% who already received the new booster by the time the poll was conducted). By comparison, 51% of adults report having received one of the prior boosters – which matches the 52% who said they were very likely to get the extra shot when it was approved one year ago. Throughout the original booster rollout, the combined number of Americans who either got the extra shot or were very likely to get it stayed between 51% and 56% – significantly higher than the comparable 34% result for the new bivalent booster.
Intent to get the new booster is lowest among Republicans (12%) and independents (26%), especially when compared with uptake of the original boosters (33% of Republicans and 43% of independents got a booster). Even Democrats, who almost universally got the base vaccination, are somewhat less likely to plan to get the new booster (64% plus 2% who already received the new booster) than they were the old one (80%). Looking at these results by age, about 1 in 4 Americans under 55 years old plan to get the new shot compared with just over 4 in 10 who got a previous booster. Among those age 55 and older, just under half plan to get the new shot, compared with 2 in 3 who got a prior booster.
“These results are a huge warning sign for health officials who say we may need to get annual Covid shots. The public is not in the frame of mind for more Covid vaccines right now,” said Murray.
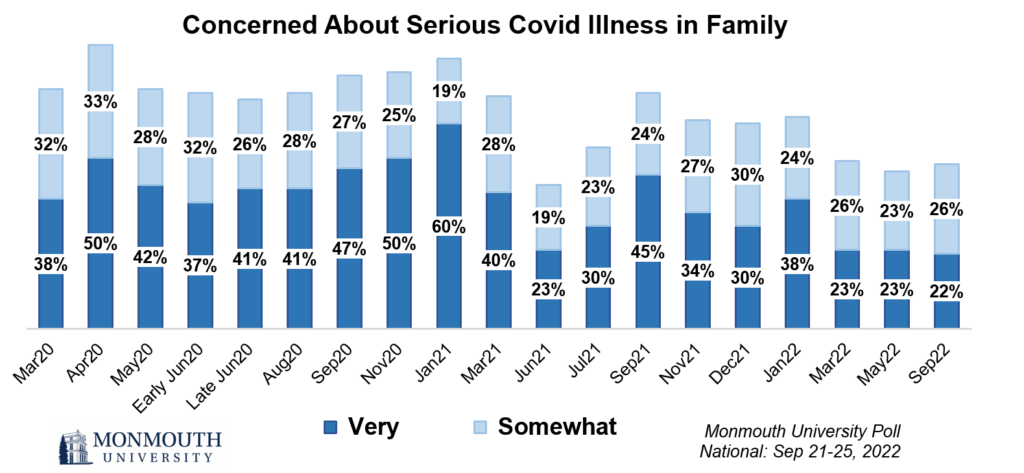
The poll also finds the number of people who are very concerned about a family member becoming seriously ill from the virus remains steady at 22%, while another 26% are somewhat concerned. These results are about the same as polls taken last spring. The year began with 38% (January 2022) who were very concerned. The pandemic high for this number was 60% one year before that (January 2021). While the current level of concern is lower than it was throughout most of the pandemic, it still does not quite match opinion in June 2021 (23% very and 19% somewhat concerned) – when a drop in cases and the introduction of vaccines fed public optimism. In the current poll, concerns about serious illness are about the same among those who have had Covid (22% very and 26% somewhat) and those who have not (24% very and 27% somewhat).
The Monmouth University Poll was conducted by telephone from September 21 to 25, 2022 with 806 adults in the United States. The question results in this release have a margin of error of +/- 3.5 percentage points. The poll was conducted by the Monmouth University Polling Institute in West Long Branch, NJ.
QUESTIONS AND RESULTS
(* Some columns may not add to 100% due to rounding.)
[Q1-25 previously released.]
26.How concerned are you about someone in your family becoming seriously ill from the coronavirus outbreak – very concerned, somewhat concerned, not too concerned, or not at all concerned?
| TREND: | Sept. 2022 | May 2022 | March 2022 | Jan. 2022 | Dec. 2021 | Nov. 2021 | Sept. 2021 | July 2021 | June 2021 | March 2021 | Jan. 2021 |
| Very concerned | 22% | 23% | 23% | 38% | 30% | 34% | 45% | 30% | 23% | 40% | 60% |
| Somewhat concerned | 26% | 23% | 26% | 24% | 30% | 27% | 24% | 23% | 19% | 28% | 19% |
| Not too concerned | 22% | 26% | 26% | 19% | 20% | 22% | 17% | 21% | 24% | 14% | 12% |
| Not at all concerned | 28% | 28% | 24% | 17% | 19% | 15% | 12% | 24% | 32% | 16% | 7% |
| (VOL) Don’t know | 0% | 0% | 0% | 0% | 0% | 1% | 1% | 0% | 1% | 0% | 0% |
| (VOL) Has already happened | 1% | 1% | 1% | 1% | 1% | 1% | 1% | 2% | 1% | 2% | 2% |
| (n) | (806) | (807) | (809) | (794) | (808) | (811) | (802) | (804) | (810) | (802) | (809) |
| TREND: Continued | Nov. 2020 | Early Sept. 2020 | Aug. 2020 | Late June 2020 | Early June 2020 | May 2020 | April 2020 | March 2020 |
| Very concerned | 50% | 47% | 41% | 41% | 37% | 42% | 50% | 38% |
| Somewhat concerned | 25% | 27% | 28% | 26% | 32% | 28% | 33% | 32% |
| Not too concerned | 13% | 13% | 18% | 17% | 14% | 14% | 9% | 18% |
| Not at all concerned | 10% | 12% | 13% | 15% | 16% | 16% | 7% | 12% |
| (VOL) Don’t know | 0% | 0% | 0% | 0% | 0% | 0% | 0% | 0% |
| (VOL) Has already happened | 1% | 0% | 1% | 1% | 0% | 0% | 0% | n/a |
| (n) | (810) | (867) | (868) | (867) | (807) | (808) | (857) | (851) |
27.At any time during the pandemic, did you ever have Covid or think you had Covid? [If YES: Was your Covid status confirmed with a test, were you given the diagnosis by a medical professional without a test, or did you just know you had Covid?]
| TREND: | Sept. 2022 | May 2022 | March 2022 | Jan. 2022 |
| Yes, confirmed with a test | 46% | 35% | 38% | 27% |
| Yes, diagnosis without a test | 3% | 2% | 4% | 2% |
| Yes, just knew had Covid | 9% | 11% | 10% | 11% |
| No, have not had Covid | 41% | 49% | 47% | 59% |
| (VOL) Don’t know | 1% | 2% | 2% | 1% |
| (n) | (806) | (807) | (809) | (794) |
28.Do you support or oppose instituting, or reinstituting, face mask and social distancing guidelines in your state at the current time?
| TREND: | Sept. 2022 | May 2022 | March 2022 | Jan. 2022 | Dec. 2021 | Sept. 2021 | July 2021 |
| Support | 25% | 32% | 34% | 52% | 55% | 63% | 52% |
| Oppose | 71% | 65% | 62% | 45% | 42% | 34% | 46% |
| (VOL) Depends | 3% | 3% | 3% | 1% | 2% | 2% | n/a |
| (VOL) Don’t know | 2% | 1% | 1% | 2% | 2% | 1% | 2% |
| (n) | (806) | (807) | (809) | (794) | (808) | (802) | (804) |
29.Do you support or oppose requiring people to show proof of vaccination in order to go to work in an office or setting where they are around other people?
| TREND: | Sept. 2022 | May 2022 | March 2022 | Jan. 2022 | Dec. 2021 | Nov. 2021 | Sept. 2021 |
| Support | 35% | 42% | 44% | 43% | 46% | 51% | 53% |
| Oppose | 63% | 56% | 55% | 53% | 50% | 47% | 45% |
| (VOL) Depends | 2% | 1% | 1% | 2% | 2% | 2% | 2% |
| (VOL) Don’t know | 0% | 1% | 0% | 2% | 2% | 1% | 1% |
| (n) | (806) | (807) | (809) | (794) | (808) | (811) | (802) |
30.Do you personally feel that the Covid pandemic is over, that the pandemic is not over yet but will end eventually, or that the pandemic will never be over and we will just have to live with it?
| Sept. 2022 | |
| Is over | 21% |
| Will end eventually | 26% |
| Will never be over | 50% |
| (VOL) Don’t know | 2% |
| (n) | (806) |
31.Have you received at least one dose of Covid vaccine, or not?
| TREND: | Sept. 2022 | May 2022 | March 2022 | Jan. 2022 | Dec. 2021 | Nov. 2021 | Sept. 2021 | July 2021 | June 2021 | April 2021 |
| Yes | 72% | 77% | 78% | 77% | 78% | 80% | 75% | 68% | 66% | 51% |
| No | 27% | 22% | 21% | 20% | 20% | 18% | 21% | 28% | 33% | 48% |
| (VOL) Don’t know | 2% | 1% | 1% | 4% | 2% | 3% | 4% | 4% | 1% | 1% |
| (n) | (806) | (807) | (809) | (794) | (808) | (811) | (802) | (804) | (810) | (800) |
31A.Have you received at least one dose of Covid vaccine, or not? [If YES] Did you receive a booster shot of the Covid vaccine at any time before this month, or not?
| Sept. 2022 | |
| Vaxed and boosted | 51% |
| Vaxed, not boosted | 21% |
| Not vaxed | 27% |
| (VOL) Don’t know | 2% |
| (n) | (806) |
32.How likely are you to get one of the new booster shots just released this month that cover more variants of the virus – are you very likely, somewhat likely, not too likely, or not at all likely?
| Sept. 2022 | |
| (VOL) Already received | 1% |
| Very likely | 33% |
| Somewhat likely | 15% |
| Not too likely | 10% |
| Not at all likely | 39% |
| (VOL) Don’t know | 2% |
| (n) | (806) |
Prior trends on likelihood of receiving Covid booster:
| TREND: | May 2022 | March 2022 | Jan. 2022 | Dec. 2021 | Nov. 2021 | Sept. 2021 |
| Already received booster | 49% | 48% | 45% | 24% | 10%* | 1%* |
| Very likely | 6% | 8% | 11% | 27% | 41% | 51% |
| Somewhat likely | 6% | 4% | 7% | 13% | 14% | 16% |
| Not too likely | 4% | 5% | 7% | 6% | 8% | 6% |
| Not at all likely ** | 34% | 33% | 30% | 27% | 25% | 26% |
| (VOL) Don’t know | 1% | 1% | 0% | 1% | 2% | 1% |
| (n) | (807) | (809) | (794) | (808) | (811) | (802) |
* September/November 2021 polls did not specifically ask if person already got the booster.
** Prior to March 2022, includes results to previous question on likelihood of getting any dose of vaccine.
METHODOLOGY
The Monmouth University Poll was sponsored and conducted by the Monmouth University Polling Institute from September 21 to 25, 2022 with a probability-based national random sample of 806 adults age 18 and older. This includes 283 contacted by a live interviewer on a landline telephone and 523 contacted by a live interviewer on a cell phone, in English. Telephone numbers were selected through a mix of random digit dialing and list-based sampling. Landline respondents were selected with a modified Troldahl-Carter youngest adult household screen. Interviewing services were provided by Braun Research, with sample obtained from Dynata (RDD, n=571), Aristotle (list, n=156) and a panel of prior Monmouth poll participants (n=79). Monmouth is responsible for all aspects of the survey design, data weighting and analysis. The full sample is weighted for region, age, education, gender and race based on US Census information (ACS 2018 one-year survey). For results based on this sample, one can say with 95% confidence that the error attributable to sampling has a maximum margin of plus or minus 3.5 percentage points (unadjusted for sample design). Sampling error can be larger for sub-groups (see table below). In addition to sampling error, one should bear in mind that question wording and practical difficulties in conducting surveys can introduce error or bias into the findings of opinion polls.
DEMOGRAPHICS (weighted) |
| Self-Reported |
| 28% Republican |
| 43% Independent |
| 29% Democrat |
| 49% Male |
| 51% Female |
| 30% 18-34 |
| 33% 35-54 |
| 37% 55+ |
| 63% White |
| 12% Black |
| 16% Hispanic |
| 8% Asian/Other |
| 69% No degree |
| 31% 4 year degree |
Click on pdf file link below for full methodology and crosstabs by key demographic groups.


