West Long Branch, NJ – Former Vice President Joe Biden maintains his front-runner status among Democratic voters nationwide, but Massachusetts Sen. Elizabeth Warren is now virtually tied with Vermont Sen. Bernie Sanders for second place in the latest Monmouth University Poll. As the candidates prepare to take the debate stage for the first time, the poll finds that Biden is considered to be the most electable candidate against Trump – among both his own supporters as well as those who are currently backing other candidates. The poll also finds broad voter interest, although not quite excitement, among Democrats for next week’s debates.
Among a field of 24 contenders, Biden currently has the support of 32% of Democrats and Democratic-leaning voters. This is similar to his 33% support last month. Warren’s support has jumped five points to 15% from 10% in May. Sanders holds onto 14% support, which is similar to his 15% support last month. Warren’s biggest gain has come from self-identified liberals (25%, up from 14% in May).
Other candidates receiving support in the poll include California Sen. Kamala Harris (8%, down slightly from 11% in May), South Bend, Indiana Mayor Pete Buttigieg (5%, steady from 6% in May), former Texas Rep. Beto O’Rourke (3%, basically unchanged from 4% in May), New Jersey Sen. Cory Booker (2%, from 1% in May), and entrepreneur Andrew Yang (2%, from 1% in May). Candidates who receive 1% support include Minnesota Sen. Amy Klobuchar (which is down from 3% in May), as well as New York City Mayor Bill de Blasio, Hawaii Rep. Tulsi Gabbard, Washington Gov. Jay Inslee, and author Marianne Williamson. The remaining 11 candidates included in the poll receive less than 1% or were not selected by any respondents.
“Biden maintains his lead but there is plenty percolating in the tier right below him. Next week will provide the first opportunity for voters to see these candidates side by side. Well, at least they’ll see some of them side by side,” said Patrick Murray, director of the independent Monmouth University Polling Institute.
The poll tested the perceived “electability” of 11 candidates, finding that Biden is considered the potential nominee with the best chance to beat Trump next year. When asked to rate Biden on a scale from 0 (would definitely lose to Trump) to 10 (would definitely defeat Trump), 59% of Democratic voters give him an 8, 9 or 10 and just 9% score him less than 5. His average score among the 95% of voters who rate his electability is 7.7. Sanders and Warren are seen as somewhat less electable than Biden, but similar to one another. Sanders has an average score of 6.5 among 93% of Democratic voters who rate him (including 39% at 8 to 10 and 17% below 5), and Warren averages 6.4 from 84% of voters (including 32% at 8 to 10 and 16% below 5). Harris averages 6.0 from 83% (including 24% at 8 to 10 and 20% below 5), Buttigieg averages 5.6 from 75% (including 17% at 8 to 10 and 21% below 5), O’Rourke averages 5.3 from 78% (including 13% at 8 to 10 and 23% below 5), and Booker averages 5.3 from 78% (including 13% at 8 to 10 and 22% below 5).
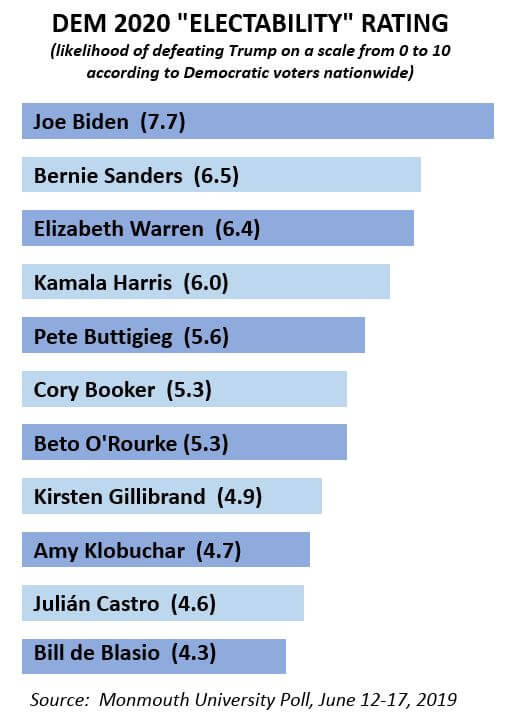
Further down the electability scale are New York Sen. Kirsten Gillibrand at an average of 4.9 from 69% of voters (including 8% at 8 to 10 and 26% below 5), Klobuchar with an average of 4.7 from 66% of voters (including 9% at 8 to 10 and 28% below 5), and former cabinet secretary Julián Castro at 4.6 from 70% of voters (including 8% at 8 to 10 and 29% below 5). At the bottom of the list of candidates tested for electability is de Blasio at 4.3 from 79% of voters (including 10% at 8 to 10 and 39% below 5).
Biden’s electability is rated nearly as high among liberals (7.7) as it is among non-liberals (7.8). Sanders (6.9 liberals and 6.1 non-liberals), Warren (6.7 liberals and 6.1 non-liberals), Harris (6.4 liberals and 5.7 non-liberals), and Buttigieg (5.8 liberals and 5.2 non-liberals) do somewhat better with liberals than non-liberals on the electability metric.
On average, most voters feel that the candidate they are currently supporting has a very good chance of defeating Trump. Among the 11 candidates tested for perceived electability in the poll, the average score from their own supporters is 8.3, including 8.9 for Biden, 8.1 for Warren, and 8.0 for Sanders. Biden voters do not see any of the other candidates nearly as electable as their choice – rating Sanders at 6.4, Warren at 6.1, Harris at 5.7, and Booker at 5.1. The other candidates average less than 5.0 among Biden supporters. Among supporters of candidates other than Biden, the former vice president receives an average 7.2 electability score, placing him ahead of Sanders (6.9), Warren (6.7), and Harris (6.4).
“Democratic voters have told us that electability matters in 2020. The perception that Biden is the party’s best shot against Trump separates him from the rest of the pack in the minds of his own supporters. Other Democratic voters also tend to see Biden as a highly electable nominee. This could play to his advantage as the field gets winnowed, but only if he can maintain this aura as the primary campaign really gets underway,” said Murray. He added, “Electability is in the eye of the supporter. At this early stage of the race, voters have not had a chance to make direct comparisons among the candidates, which makes it is easier to project a sense of electability on almost anyone in the field. All this could change after next week’s debates.”
About half of Democratic voters are looking forward to next week’s inaugural debates, although just 13% say they are excited about them while 36% are very interested. Another 34% have some interest and 17% have no interest at all. Liberals (60%) are more likely than non-liberals (38%) to have a high level of interest. Most Democrats (58%) say they plan to watch the debates live, 27% will watch clips afterwards, and 14% say they will not watch any of the June debates.
There has been some controversy over the debate rules, although only 20% of party voters have heard a lot about the Democratic National Committee’s qualification criteria. Another 40% have heard a little, and 39% have not heard anything at all. The overwhelming majority of Democrats (73%) support the decision to limit the first two debates to 20 candidates. Just 17% disapprove of this limit. However, voters are divided on how to deal with the possibility of 21 or 22 candidates qualifying for the next debate – 49% say the DNC should stick to the limit of ten per night and 45% say they should squeeze the extra person onto the stage.
The Monmouth University Poll was conducted by telephone from June 12 to 17, 2019 with 751 adults in the United States. Results in this release are based on 306 registered voters who identify as Democrats or lean toward the Democratic Party, which has a +/- 5.6 percentage point sampling margin of error. The poll was conducted by the Monmouth University Polling Institute in West Long Branch, NJ.
QUESTIONS AND RESULTS
(* Some columns may not add to 100% due to rounding.)
[Q1-15 held for future release.]
16. I know the 2020 election is far away, but who would you support for the Democratic nomination for president if the candidates were the following? [INCLUDES LEANERS] [NAMES WERE ROTATED]
|
TREND: (with leaners) | June 2019 | May 2019 | April 2019 | March 2019 | Jan. 2019 |
| Joe Biden | 32% | 33% | 27% | 28% | 29% |
| Elizabeth Warren | 15% | 10% | 6% | 8% | 8% |
| Bernie Sanders | 14% | 15% | 20% | 25% | 16% |
| Kamala Harris | 8% | 11% | 8% | 10% | 11% |
| Pete Buttigieg | 5% | 6% | 8% | <1% | 0% |
| Beto O’Rourke | 3% | 4% | 4% | 6% | 7% |
| Cory Booker | 2% | 1% | 2% | 5% | 4% |
| Andrew Yang | 2% | 1% | <1% | 1% | 1% |
| Bill de Blasio | 1% | 1% | 1% | 1% | n/a |
| Tulsi Gabbard | 1% | 1% | 0% | <1% | 1% |
| Jay Inslee | 1% | <1% | <1% | <1% | <1% |
| Amy Klobuchar | 1% | 3% | 1% | 3% | 2% |
| Marianne Williamson | 1% | 1% | <1% | <1% | n/a |
| Julián Castro | <1% | 1% | <1% | 1% | 1% |
| Kirsten Gillibrand | <1% | <1% | <1% | <1% | 1% |
| Tim Ryan | <1% | <1% | 0% | n/a | n/a |
| Michael Bennet | 0% | <1% | 0% | <1% | n/a |
| Steve Bullock | 0% | 0% | 0% | 0% | n/a |
| John Delaney | 0% | <1% | 0% | 0% | <1% |
| Mike Gravel | 0% | 0% | n/a | n/a | n/a |
| John Hickenlooper | 0% | <1% | 2% | 1% | 1% |
| Wayne Messam | 0% | 0% | <1% | n/a | n/a |
| Seth Moulton | 0% | 0% | <1% | n/a | n/a |
| Eric Swalwell | 0% | 0% | <1% | n/a | n/a |
| (VOL) Other | 0% | 0% | 1% | 4% | 7% |
| (VOL) No one | 1% | 2% | 3% | <1% | 3% |
| (VOL) Undecided | 11% | 9% | 14% | 8% | 9% |
| (n) | (306) | (334) | (330) | (310) | (313) |
17. I’m going to read you the names of some Democrats who are running for president in 2020. Regardless of whether you would support them, I want to know how strong you think they would be against President Trump if they were the Democratic nominee. For each one, please rate them on a scale from zero to 10, where zero means they definitely would lose to Trump and 10 means they definitely would beat Trump. 5 means they have a 50/50 chance. You may use any number between zero and 10. If you have not heard of the person, just let me know. [NAMES WERE ROTATED]
| Definitely lose to Trump <<<<<<<<< >>>>>>>>> Definitely beat Trump | ||||||||||||||
0 Definitely lose | 1 | 2 | 3 | 4 | 5 50/50 chance | 6 | 7 | 8 | 9 | 10 Definitely win | Not heard of | (VOL) Don’t know | (n) | |
| Former Vice President Joe Biden | 1% | 2% | 1% | 1% | 4% | 8% | 5% | 14% | 17% | 13% | 29% | 0% | 5% | (306) |
| Vermont Senator Bernie Sanders | 4% | 2% | 2% | 4% | 5% | 16% | 11% | 12% | 18% | 8% | 13% | 3% | 4% | (306) |
| Massachusetts Senator Elizabeth Warren | 2% | 2% | 2% | 4% | 6% | 17% | 8% | 11% | 11% | 12% | 9% | 11% | 5% | (306) |
| Former Texas Congressman Beto O’Rourke | 4% | 2% | 3% | 5% | 9% | 20% | 10% | 11% | 7% | 2% | 4% | 15% | 7% | (306) |
| California Senator Kamala Harris | 3% | 2% | 2% | 4% | 9% | 17% | 9% | 13% | 11% | 7% | 6% | 11% | 6% | (306) |
| Minnesota Senator Amy Klobuchar | 6% | 3% | 2% | 6% | 11% | 14% | 9% | 6% | 4% | 1% | 4% | 25% | 9% | (306) |
| South Bend, Indiana Mayor Pete Buttigieg | 5% | 2% | 2% | 5% | 7% | 16% | 10% | 11% | 9% | 4% | 4% | 18% | 7% | (306) |
| New Jersey Senator Cory Booker | 5% | 1% | 3% | 7% | 6% | 18% | 12% | 11% | 7% | 2% | 4% | 16% | 6% | (306) |
| New York Senator Kirsten Gillibrand | 5% | 2% | 4% | 6% | 9% | 23% | 5% | 7% | 3% | 2% | 3% | 22% | 9% | (306) |
| Former cabinet secretary Julián Castro | 6% | 3% | 3% | 6% | 11% | 21% | 7% | 4% | 4% | 1% | 3% | 22% | 8% | (306) |
| New York City Mayor Bill de Blasio | 10% | 4% | 6% | 10% | 9% | 17% | 7% | 5% | 4% | 2% | 4% | 14% | 7% | (306) |
18. The first Democratic debates will be held at the end of the month. Do you plan to watch these debates live, watch clips later, or do you not plan to watch any of the June debates?
|
June 2019 | |
| Plan to watch live | 58% |
| Watch clips later | 27% |
| Not plan to watch | 14% |
| (VOL) Don’t know | 1% |
| (n) | (306) |
19. Would you say you are excited about the upcoming debates this month, very interested but not excited, somewhat interested, or not interested in these debates?
|
June 2019 | |
| Excited | 13% |
| Very interested | 36% |
| Somewhat interested | 34% |
| Not interested | 17% |
| (VOL) Don’t know | 0% |
| (n) | (306) |
20. The first debates will be spread over two nights with ten candidates on the stage each night based on certain polling and fundraising qualifications set by the Democratic National Committee. Have you heard a lot, a little, or nothing about these debate qualifications?
|
June 2019 | |
| A lot | 20% |
| A little | 40% |
| Nothing | 39% |
| (n) | (306) |
21. Do you approve or disapprove of the Democratic National Committee’s decision to limit the first debates to 20 candidates?
|
June 2019 | |
| Approve | 73% |
| Disapprove | 17% |
| (VOL) Both, depends | 0% |
| (VOL) Don’t know | 9% |
| (n) | (306) |
22. If 21 or 22 candidates meet the debate qualifications, should the Democratic National Committee allow an extra person on the debate stage or should they keep it to their announced limit of ten candidates each night?
|
June 2019 | |
| Allow an extra person on the stage | 45% |
| Limit of ten candidates each night | 49% |
| (VOL) Both, depends | 1% |
| (VOL) Don’t know | 5% |
| (n) | (306) |
[Q23-30 held for future release.]
METHODOLOGY
The Monmouth University Poll was sponsored and conducted by the Monmouth University Polling Institute from June 12 to 17, 2019 with a national random sample of 751 adults age 18 and older, in English. This includes 301 contacted by a live interviewer on a landline telephone and 450 contacted by a live interviewer on a cell phone. The results in this poll release are based on a subsample of 306 registered voters who identify themselves as Democrats or lean toward the Democratic Party. Telephone numbers were selected through random digit dialing and landline respondents were selected with a modified Troldahl-Carter youngest adult household screen. Monmouth is responsible for all aspects of the survey design, data weighting and analysis. Final sample is weighted for region, age, education, gender and race based on US Census information. Data collection support provided by Braun Research (field) and Dynata (RDD sample). For results based on the Democratic voter sample, one can say with 95% confidence that the error attributable to sampling has a maximum margin of plus or minus 5.6 percentage points (unadjusted for sample design). Sampling error can be larger for sub-groups (see table below). In addition to sampling error, one should bear in mind that question wording and practical difficulties in conducting surveys can introduce error or bias into the findings of opinion polls.
| DEMOGRAPHICS (weighted) |
| DEMOCRATIC VOTERS |
| 37% Male |
| 63% Female |
| 31% 18-34 |
| 31% 35-54 |
| 39% 55+ |
| 50% White |
| 19% Black |
| 20% Hispanic |
| 11% Asian/Other |
| 61% No degree |
| 39% 4 year degree |
Click on pdf file link below for full methodology and crosstabs by key demographic groups.


