
West Long Branch, NJ – Most Americans say socialism is not compatible with American values, but only 4-in-10 hold a decidedly negative opinion of it. The latest Monmouth University Poll also finds that less than half the country has a clearly positive opinion of capitalism. Republicans have stronger, largely negative, views of socialism. Democrats tend to be more neutral; at the same time they give overwhelming support to universal health care – a policy which both supporters and detractors have painted as a socialist policy.
A majority of Americans (57%) say that socialism is not compatible with American values. Just 29% say it is compatible. About 4-in-10 (42%) have a negative opinion of socialism in general, with another 45% having a neutral opinion and just 10% holding a positive view of socialism. Public opinion about capitalism – while largely positive – is not overwhelmingly favorable, however. Nearly 4-in-10 Americans (39%) have a positive opinion of capitalism in general and a similar 40% have a neutral opinion. Another 17% hold a negative view of capitalism.
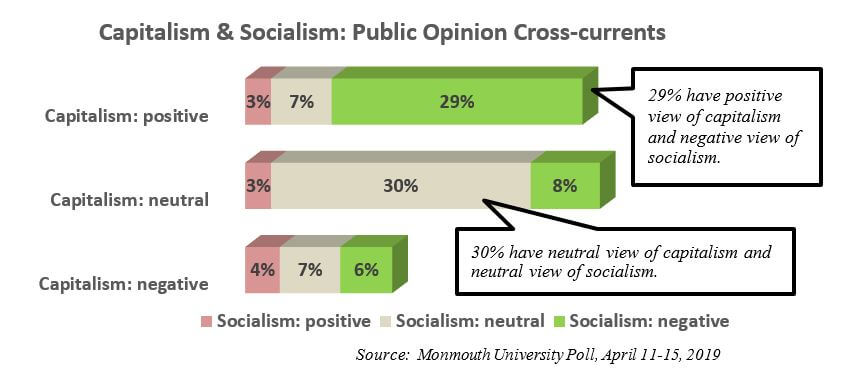
Taken together, Americans divide into two dominant camps – 29% who have a positive view of capitalism and a negative view of socialism and 30% who have neutral opinions of both capitalism and socialism. The remaining 4-in-10 Americans hold a range of mixed views on the two economic systems. The vast majority of pro-capitalist/anti-socialist Americans identify as Republicans (49%) or lean toward the Republican Party (29%). Just 8% are Democrats or lean Democratic. This group also skews older – nearly half (47%) are aged 55 and over, compared to 34% who are aged 35 to 54 and just 19% who are under 35 years old. Almost two-thirds (64%) of this group are men versus 36% who are women. On the other hand, the majority of Americans who are neutral about both economic systems identify as Democrats (46%) or lean toward the Democratic Party (17%). Another 18% are Republican or lean Republican. This neutral group skews slightly younger than the population as a whole, with 37% who are 18 to 34 years old, 30% who are 35 to 54, and 33% who are 55 and older. The gender split for this group – 55% women and 45% men – is only slightly more female than the public as a whole.
“We may be in a period of flux with how these economic systems are viewed. Socialism still carries a stigma, but many Americans feel they are being left behind by the current capitalist system. Policies that have traditionally been seen as socialist may be getting more popular even if the term itself is not,” said Patrick Murray, director of the independent Monmouth University Polling Institute.
The poll finds some contradictory opinion on what socialism means to the public. Most Americans say that socialism “takes away too many individual rights,” either a great deal (35%) or somewhat (25%). Just one-third say this phrase describes socialism not much (13%) or not at all (20%). On the other hand, half of the public feels that socialism “is a way to make things fairer for working people,” either a great deal (15%) or somewhat (35%). Just under half, though, say this describes socialism not much (11%) or not at all (33%).
Applying these terms to a policy proposal that many say has its roots in socialism provides an illustration of this dissonant opinion. Specifically, a majority of Americans either strongly (41%) or somewhat (17%) favor creating a universal health care system while fewer than 4-in-10 either strongly (26%) or somewhat (11%) oppose this idea. When asked how they view this proposal in systematic terms, 37% describe universal health care as a socialist policy while just 4% describe it as a capitalist policy. However, a majority (53%) say they see universal health care as neither socialist nor capitalist.
Democrats are the most likely to strongly favor (65%) establishing a universal health care system and see it as being neither socialist nor capitalist (76%). A plurality of independents (42%) strongly favor universal health care and 55% see it as neither socialist nor capitalist. A majority of Republicans (54%), though, strongly oppose universal health care, with 75% saying it is a socialist policy.
“We shouldn’t ignore the possibility that ‘neutral’ could be a way for some Americans, especially Democrats, to couch their policy preferences without using a term that has historically negative connotations. This is going to be a real challenge for left-leaning candidates in the 2020 presidential race. The party base seems to be saying, ‘We like your platform, just don’t use the word socialism to describe it,’” said Murray.
Public opinion about these economic systems in general breaks along party lines. Among Republicans, 76% have a negative view of socialism and 66% have a positive view of capitalism. Among Democrats, 67% have a neutral view of socialism and 53% have a neutral view of capitalism. Independents tend to be more divided on both socialism (45% negative and 43% neutral) and capitalism (39% positive and 40% neutral). Most independents (59% to 27%) and Republicans (87% to 7%) say socialism is not compatible with American values compared to those who say it is, while this is a minority view among Democrats (32% is not to 50% is).
The poll also finds some sizable age differences in public opinion of these terms. While about half of Americans under the age of 35 (49%) feel neutral toward capitalism, the remainder are evenly divided between seeing it as positive (24%) or negative (22%). This is significantly different from the more favorable views of capitalism among those aged 35 to 54 (43% positive to 15% negative) and aged 55 and older (48% positive to 13% negative). The poll also finds that younger adults (31%) are less likely to be negative toward socialism than are those aged 35 to 54 (47%) or older (49%).
These age differences hold even when controlling for partisanship, although there are some notable variations. Among those who either identify with or lean toward the Democratic Party, those under 35 years old (12%) are less likely than those aged 35 and older (24%) to feel positive about capitalism and more likely to feel negative (35% aged 18 to 34 and 20% aged 35 and older). Younger Democrats (48%) are about as likely as Democrats aged 35 and older (51%) to feel neutral about capitalism. Among those who identify with or lean toward the Republican Party, those under 35 years old (53%) are less likely than those aged 35 and older (69%) to feel positive about capitalism, although they are not significantly more likely to feel negative (10% aged 18 to 35 to 7% aged 35 and older). Younger Republicans (37%) are more likely than Republicans aged 35 and older (23%) to feel neutral about capitalism.
Democrats and Democratic-leaners under 35 years old (6%) are less likely than older Democrats (19%) to feel negative about socialism, although they are not much more likely to be positive (19% to 15%). Younger Democrats (73%) are somewhat more likely than Democrats aged 35 and older (62%) to feel neutral about socialism. Republicans and Republican-leaners under 35 years old are slightly less likely than older Republicans to feel either positive (1% to 5%) or negative (72% to 78%) about socialism, but are somewhat more likely to feel neutral (26% to 16%).
“We’ve seen younger voters trending more Democratic in recent elections which has played a role in the party shifting leftward. This means socialism is poised to become a defining feature of the 2020 presidential contest. Will progressive Democrats be able to redefine the term or will the GOP be successful at vilifying this agenda as anti-American?” said Murray.
Murray added, “Polling about socialism poses a number of challenges. The meaning of the term is fluid and some respondents are reluctant to share their thoughts on a concept with historically negative baggage. Monmouth will be doing more polls on this topic but it will require approaches from a variety of pollsters to help us better understand this concept in the current political environment.”
The Monmouth University Poll was conducted by telephone from April 11 to 15, 2019 with 801 adults in the United States. The question results in this release have a margin of error of +/- 3.5 percentage points. The poll was conducted by the Monmouth University Polling Institute in West Long Branch, NJ.
QUESTIONS AND RESULTS
(* Some columns may not add to 100% due to rounding.)
[Q1-25 previously released.]
26. Do you favor or oppose creating a universal health care system in America? [Do you favor/oppose that strongly or somewhat?]
|
April 2019 | |
| Strongly favor | 41% |
| Somewhat favor | 17% |
| Somewhat oppose | 11% |
| Strongly oppose | 26% |
| (VOL) Don’t know | 5% |
| (n) | (801) |
27. Do you tend to view universal health care as a socialist policy, as a capitalist policy, or neither?
|
April 2019 | |
| Socialist policy | 37% |
| Capitalist policy | 4% |
| Neither | 53% |
| (VOL) Both | 1% |
| (VOL) Don’t know | 6% |
| (n) | (801) |
[QUESTIONS 28 & 29 WERE ROTATED]
28. In general, is your opinion of capitalism positive, negative, or neutral?
|
April 2019 | |
| Positive | 39% |
| Negative | 17% |
| Neutral | 40% |
| (VOL) Don’t know | 4% |
| (n) | (801) |
29. In general, is your opinion of socialism positive, negative, or neutral?
|
April 2019 | |
| Positive | 10% |
| Negative | 42% |
| Neutral | 45% |
| (VOL) Don’t know | 3% |
| (n) | (801) |
30. In general, is socialism compatible or not compatible with American values?
|
April 2019 | |
| Compatible | 29% |
| Not compatible | 57% |
| (VOL) Depends | 7% |
| (VOL) Don’t know | 7% |
| (n) | (801) |
31. How much do each of the following descriptions match your view of socialism – does this describe socialism a great deal, somewhat, not much, or not at all? [ITEMS WERE ROTATED]
It takes away too many individual rights
|
April 2019 | |
| Great deal | 35% |
| Somewhat | 25% |
| Not much | 13% |
| Not at all | 20% |
| (VOL) Don’t know | 7% |
| (n) | (801) |
It is a way to make things fairer for working people
|
April 2019 | |
| Great deal | 15% |
| Somewhat | 35% |
| Not much | 11% |
| Not at all | 33% |
| (VOL) Don’t know | 6% |
| (n) | (801) |
METHODOLOGY
The Monmouth University Poll was sponsored and conducted by the Monmouth University Polling Institute from April 11 to 15, 2019 with a national random sample of 801 adults age 18 and older, in English. This includes 320 contacted by a live interviewer on a landline telephone and 481 contacted by a live interviewer on a cell phone. Telephone numbers were selected through random digit dialing and landline respondents were selected with a modified Troldahl-Carter youngest adult household screen. Monmouth is responsible for all aspects of the survey design, data weighting and analysis. Final sample is weighted for region, age, education, gender and race based on US Census information. Data collection support provided by Braun Research (field) and Dynata (RDD sample). For results based on this sample, one can say with 95% confidence that the error attributable to sampling has a maximum margin of plus or minus 3.5 percentage points (unadjusted for sample design). Sampling error can be larger for sub-groups (see table below). In addition to sampling error, one should bear in mind that question wording and practical difficulties in conducting surveys can introduce error or bias into the findings of opinion polls.
| DEMOGRAPHICS (weighted) |
| Self-Reported |
| 25% Republican |
| 44% Independent |
| 31% Democrat |
| 48% Male |
| 52% Female |
| 30% 18-34 |
| 33% 35-54 |
| 37% 55+ |
| 64% White |
| 12% Black |
| 16% Hispanic |
| 8% Asian/Other |
| 69% No degree |
| 31% 4 year degree |
Click on pdf file link below for full methodology and crosstabs by key demographic groups.


