
West Long Branch, NJ – About half of the country remains concerned about Covid-19 affecting their family’s health, but the Monmouth (“Mon-muth”) University Poll also finds that most Americans say their pre-pandemic daily routine is basically back to normal. Three years after the global pandemic started, most people are leaving their face masks at home while few want to bring back social distancing restrictions. The poll also finds the number of adults who are very likely to get an annual Covid vaccine is lower than the number who report getting a flu shot every year.
Just 24% of the public says the Covid pandemic is over, while another 20% say it is not over yet but will end eventually. More than half (53%) of the country feels the pandemic will never be over and we will just have to live with it. These results are very similar to poll findings from September 2022.
At the same time, most Americans report that their daily routines are either completely (34%) or mostly (35%) back to their pre-pandemic normal. Nearly half report they still use a face mask in public at least occasionally, although only 1 in 5 wear one either all (9%) or most (12%) of the time.
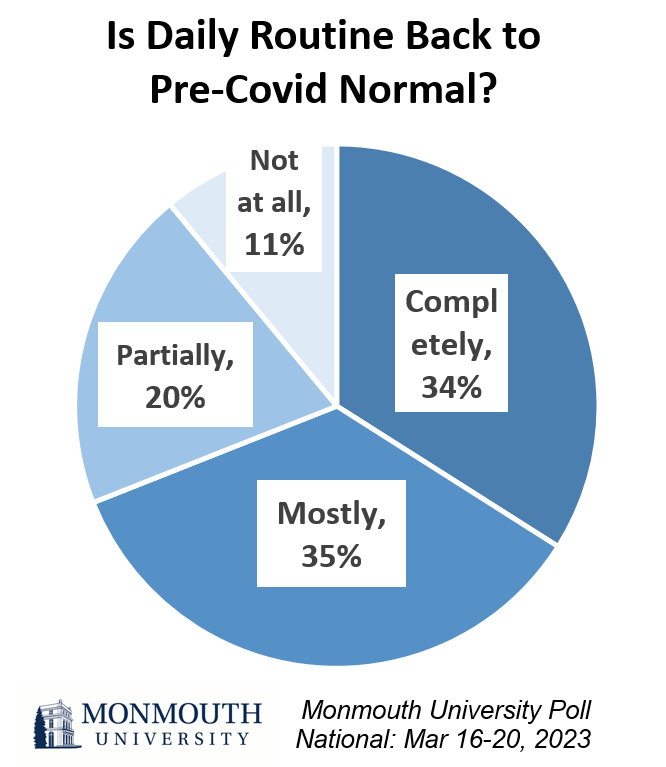
“Living with Covid isn’t just the new normal. For many, it’s also back to the old normal. It appears most Americans are willing to chance an infection in order to return to their pre-pandemic routines,” said Patrick Murray, director of the independent Monmouth University Polling Institute.
It appears the prevalence of Covid among American adults has leveled off. Just under half (47%) report having tested positive for Covid at least once since the pandemic started, which is nearly identical to the number who said the same in September (46%).
Just over half (56%) report getting the Covid vaccine with at least one booster shot, which is an uptick from September (51%). Still, the number of American adults who have not received any dose of the vaccine at all continues to hold steady at 26%. The poll also finds that just 30% of Americans are very likely to get an annual Covid shot as some health officials have recommended. This number is lower than those who report getting a flu shot every year (41%). Interesting, about the same number of Democrats say they are very likely to get an annual Covid vaccine (62%) as report getting a flu shot every year (59%). However, far fewer Republicans intend to get an annual Covid vaccine (13% very likely) than the number who say they receive a flu shot every year (40%). [Note: prior Monmouth polling has found that the “very likely” result on Covid vaccine intent questions has been predictive of future uptake.]
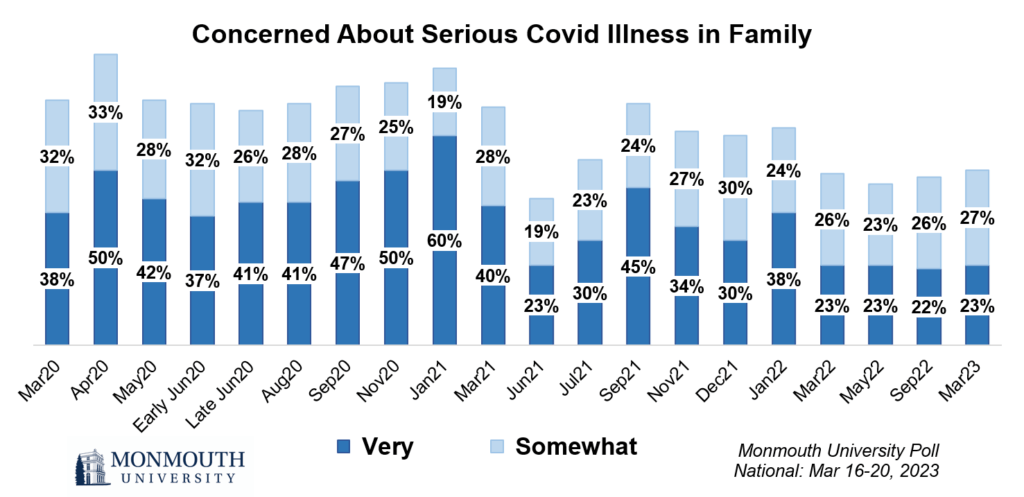
The poll also finds the number of people who are very concerned about a family member becoming seriously ill from the virus stands at 23%, while another 27% are somewhat concerned. These metrics have steadily hovered around this level for the past 12 months.
“Half of the public continues to have some concern about Covid seriously impacting their family. But taken in sum with the other poll findings, it is a risk many have come to accept,” said Murray.
Only 35% of the public supports requiring people to show proof of vaccination in order to work in an office or around other people. Even fewer (27%) support instituting, or reinstituting, face mask and social distancing guidelines. These results have held steady over the past six months after declining through 2022. A majority of Democrats (69%) support workplace vaccine mandates and nearly half (46%) back face mask and social distancing guidelines. Just 1 in 4 independents and about 1 in 10 Republicans support either of these measures.
The Monmouth University Poll was conducted by telephone from March 16 to 20, 2023 with 805 adults in the United States. The question results in this release have a margin of error of +/- 5.8 percentage points for the full sample. The poll was conducted by the Monmouth University Polling Institute in West Long Branch, NJ.
QUESTIONS AND RESULTS
(* Some columns may not add to 100% due to rounding.)
[Q1-4 previously released.]
[Q5-17 held for future release.]
18.Have you ever received a flu shot, or not? [If YES: How often do you get a flu shot – every year, nearly every year, or just once in a while?]
| Response: | March 2023 |
|---|---|
| Every year | 41% |
| Nearly every year | 10% |
| Once in a while | 24% |
| Never | 23% |
| (VOL) Don’t know | 2% |
| (n) | (805) |
19.How concerned are you about someone in your family becoming seriously ill from the coronavirus outbreak – very concerned, somewhat concerned, not too concerned, or not at all concerned?
| Trend: | March 2023 | Sept. 2022 | May 2022 | March 2022 | Jan. 2022 | Dec. 2021 | Nov. 2021 | Sept. 2021 | July 2021 | June 2021 | March 2021 | Jan. 2021 |
|---|---|---|---|---|---|---|---|---|---|---|---|---|
| Very concerned | 23% | 22% | 23% | 23% | 38% | 30% | 34% | 45% | 30% | 23% | 40% | 60% |
| Somewhat concerned | 27% | 26% | 23% | 26% | 24% | 30% | 27% | 24% | 23% | 19% | 28% | 19% |
| Not too concerned | 22% | 22% | 26% | 26% | 19% | 20% | 22% | 17% | 21% | 24% | 14% | 12% |
| Not at all concerned | 26% | 28% | 28% | 24% | 17% | 19% | 15% | 12% | 24% | 32% | 16% | 7% |
| (VOL) Don’t know | 1% | 0% | 0% | 0% | 0% | 0% | 1% | 1% | 0% | 1% | 0% | 0% |
| (VOL) Has already happened | n/a | 1% | 1% | 1% | 1% | 1% | 1% | 1% | 2% | 1% | 2% | 2% |
| (n) | (805) | (806) | (807) | (809) | (794) | (808) | (811) | (802) | (804) | (810) | (802) | (809) |
| Trend: Continued | Nov. 2020 | Early Sept. 2020 | Aug. 2020 | Late June 2020 | Early June 2020 | May 2020 | April 2020 | March 2020 |
|---|---|---|---|---|---|---|---|---|
| Very concerned | 50% | 47% | 41% | 41% | 37% | 42% | 50% | 38% |
| Somewhat concerned | 25% | 27% | 28% | 26% | 32% | 28% | 33% | 32% |
| Not too concerned | 13% | 13% | 18% | 17% | 14% | 14% | 9% | 18% |
| Not at all concerned | 10% | 12% | 13% | 15% | 16% | 16% | 7% | 12% |
| (VOL) Don’t know | 0% | 0% | 0% | 0% | 0% | 0% | 0% | 0% |
| (VOL) Has already happened | 1% | 0% | 1% | 1% | 0% | 0% | 0% | n/a |
| (n) | (810) | (867) | (868) | (867) | (807) | (808) | (857) | (851) |
20.Since the pandemic started, did you ever have Covid or think you had Covid? [If YES: Was your Covid status confirmed with a test, were you given the diagnosis by a medical professional without a test, or did you just know you had Covid?]
| Trend: | March 2023 | Sept. 2022* | May 2022* | March 2022* | Jan. 2022* |
|---|---|---|---|---|---|
| Yes, confirmed with a test | 47% | 46% | 35% | 38% | 27% |
| Yes, diagnosis without a test | 3% | 3% | 2% | 4% | 2% |
| Yes, just knew had Covid | 11% | 9% | 11% | 10% | 11% |
| No, have not had Covid | 37% | 41% | 49% | 47% | 59% |
| (VOL) Don’t know | 3% | 1% | 2% | 2% | 1% |
| (n) | (805) | (806) | (807) | (809) | (794) |
21.Do you support or oppose instituting, or reinstituting, face mask and social distancing guidelines in your state at the current time?
| Trend: | March 2023 | Sept. 2022 | May 2022 | March 2022 | Jan. 2022 | Dec. 2021 | Sept. 2021 | July 2021 |
|---|---|---|---|---|---|---|---|---|
| Support | 27% | 25% | 32% | 34% | 52% | 55% | 63% | 52% |
| Oppose | 70% | 71% | 65% | 62% | 45% | 42% | 34% | 46% |
| (VOL) Depends | 3% | 3% | 3% | 3% | 1% | 2% | 2% | n/a |
| (VOL) Don’t know | 1% | 2% | 1% | 1% | 2% | 2% | 1% | 2% |
| (n) | (805) | (806) | (807) | (809) | (794) | (808) | (802) | (804) |
22.Do you support or oppose requiring people to show proof of Covid vaccination in order to go to work in an office or setting where they are around other people?
| Trend: | March 2023 | Sept. 2022 | May 2022 | March 2022 | Jan. 2022 | Dec. 2021 | Nov. 2021 | Sept. 2021 |
|---|---|---|---|---|---|---|---|---|
| Support | 35% | 35% | 42% | 44% | 43% | 46% | 51% | 53% |
| Oppose | 61% | 63% | 56% | 55% | 53% | 50% | 47% | 45% |
| (VOL) Depends | 1% | 2% | 1% | 1% | 2% | 2% | 2% | 2% |
| (VOL) Don’t know | 2% | 0% | 1% | 0% | 2% | 2% | 1% | 1% |
| (n) | (805) | (806) | (807) | (809) | (794) | (808) | (811) | (802) |
23.Do you personally feel that the Covid pandemic is over, that the pandemic is not over yet but will end eventually, or that the pandemic will never be over and we will just have to live with it?
| Trend: | March 2023 | Sept. 2022 |
|---|---|---|
| Is over | 24% | 21% |
| Will end eventually | 20% | 26% |
| Will never be over | 53% | 50% |
| (VOL) Don’t know | 3% | 2% |
| (n) | (805) | (806) |
24.Thinking back to before the pandemic started three years ago, would you say your daily routine now is completely back to normal, mostly back to normal, only partially back to normal, or not back to normal at all?
| Response: | March 2023 |
|---|---|
| Completely back to normal | 34% |
| Mostly back to normal | 35% |
| Partially back to normal | 20% |
| Not back to normal at all | 11% |
| (VOL) Don’t know | 1% |
| (n) | (805) |
25.Do you ever wear a face mask when you go out in public now, or not? [If YES: How often do you wear a face mask when you are in public – all of the time, most of the time, or just some of the time?]
| Response: | March 2023 |
|---|---|
| Yes, all of the time | 9% |
| Yes, most of the time | 12% |
| Yes, just some of the time | 27% |
| No, don’t wear a mask in public | 51% |
| (VOL) Don’t know | 1% |
| (n) | (805) |
26.Have you received at least one dose of Covid vaccine, or not? [If YES] Did you receive a booster shot of the Covid vaccine, or not?
| Trend: | March 2023 | Sept. 2022* |
|---|---|---|
| Vaxed and boosted | 56% | 51% |
| Vaxed, not boosted | 15% | 21% |
| Not vaxed | 26% | 27% |
| (VOL) Don’t know | 3% | 2% |
| (n) | (805) | (806) |
27.Some health officials have recommended getting the Covid vaccine every year. Are you very likely, somewhat likely, not too likely, or not at all likely to get an annual Covid shot?
| Response: | March 2023 |
|---|---|
| Very likely | 30% |
| Somewhat likely | 15% |
| Not too likely | 12% |
| Not at all likely | 41% |
| (VOL) Don’t know | 2% |
| (n) | (805) |
Methodology
The Monmouth University Poll was sponsored and conducted by the Monmouth University Polling Institute from March 16 to 20, 2023 with a probability-based national random sample of 805 adults age 18 and older. This includes 284 contacted by a live interviewer on a landline telephone and 521 contacted by a live interviewer on a cell phone, in English. Telephone numbers were selected through a mix of random digit dialing and list-based sampling. Landline respondents were selected with a modified Troldahl-Carter youngest adult household screen. Interviewing services were provided by Braun Research, with sample obtained from Dynata (RDD, n= 479), Aristotle (list, n= 133) and a panel of prior Monmouth poll participants (n= 193). Monmouth is responsible for all aspects of the survey design, data weighting and analysis. The full sample is weighted for region, age, education, gender and race based on US Census information (ACS 2021 one-year survey). For results based on this sample, one can say with 95% confidence that the error attributable to sampling has a maximum margin of plus or minus 5.8 percentage points adjusted for sample design effects (1.68). Sampling error can be larger for sub-groups (see table below). In addition to sampling error, one should bear in mind that question wording and practical difficulties in conducting surveys can introduce error or bias into the findings of opinion polls.
DEMOGRAPHICS (weighted) |
| Self-Reported |
| 25% Republican |
| 45% Independent |
| 30% Democrat |
| 49% Male |
| 51% Female |
| 29% 18-34 |
| 33% 35-54 |
| 38% 55+ |
| 61% White |
| 12% Black |
| 17% Hispanic |
| 10% Asian/Other |
| 67% No degree |
| 33% 4 year degree |
Click on pdf file link below for full methodology and crosstabs by key demographic groups.


