
West Long Branch, NJ – Even though most Democrats hold a favorable opinion of President Joe Biden, only one in four would want him to run for a second term. More than 4 in 10 would prefer to see the incumbent step aside in favor of another candidate according to a Monmouth (“Mon-muth”) University Poll of self-identified Democrats and Democratic-leaning voters. These voters, however, do not have a clear idea of who they would like to see as the party’s nominee in Biden’s stead.
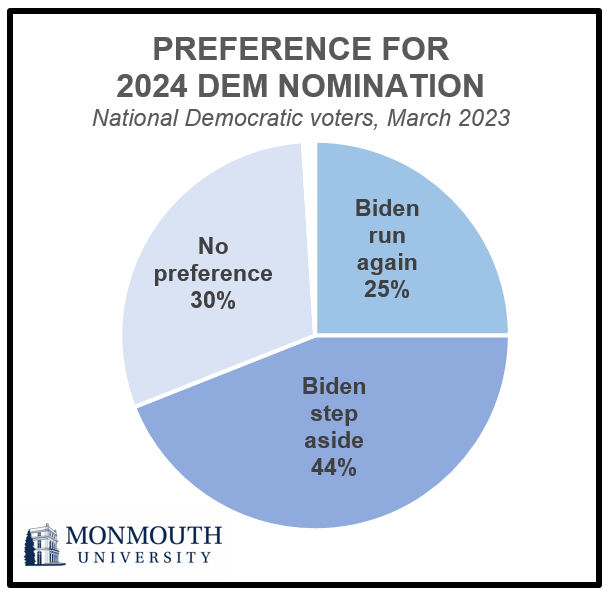
Three in four Democrats (74%) have a favorable opinion of Joe Biden and just 14% hold an unfavorable view. However, when asked what they want to see happen in 2024 if the choice was up to them, nearly half (44%) would like Biden to step aside so someone else can run as the Democrat for president. Just 25% say their preference is for Biden to pursue a second term, while 30% say they have no preference either way. Among voters who identify as strong Democrats – representing just over half of the party’s electorate – 36% want Biden to run again and 36% would prefer him to step aside. Among voters with very liberal political views – representing just over one-quarter of Democrats nationwide – more than half (52%) want Biden to turn the reins over to someone else and just 22% say they prefer to see the incumbent seek another term. A majority of Democratic voters under 50 years old (54%) would also like to see Biden defer to another candidate in 2024.
Half (51%) of the Democratic electorate cannot offer a name when asked who they would like to see as the party’s nominee if Biden does not run. Among those who do have a preferred alternative, Vice President Kamala Harris (13%) is the only potential contender who registers above single digits. These results are basically the same among party voters who specifically say they want Biden to step aside for another candidate.
“Democrats appear to be saying they like the job Biden has done, but maybe it’s time for him to move on when his term is up. However, no top tier of candidates emerges when these voters are asked to name a preferred alternative. Part of that could simply be the holding pattern that Democrats are in because Biden has signaled that he will, in fact, run,” said Patrick Murray, director of the independent Monmouth University Polling Institute.
About half the Democratic voters polled indicate they initially supported a candidate other than Biden during the 2020 presidential primary season, including 20% who backed Vermont Sen. Bernie Sanders and 11% who supported Massachusetts Sen. Elizabeth Warren. One-third (33%) of Democrats say they backed Biden from the start. Among those who initially supported a candidate other than Biden for the nomination, 44% feel their first-choice candidate would actually have done a better job as president. Another 46% feel their initial preference would have performed about the same as Biden and just 9% feel that candidate would have done a worse job than Biden. Sanders supporters (66%) are much more likely than those who backed Warren (35%) or another candidate (26%) to feel their initial choice would have done a better job than Biden.
The poll also asked Democratic voters about their views of leaders in the party. These opinions are largely positive, with the main difference being varying levels of familiarity and name recognition. The more widely known party leaders, other than Biden, include Sanders (71% favorable and 12% unfavorable), Warren (64%–12%), and Harris (64%–19%). The most highly rated figures are former President Barack Obama (89%–5%) and former First Lady Michelle Obama (86%–4%). Other Democratic officeholders that are familiar to a majority of the party’s electorate include former Georgia legislator Stacey Abrams (64%–6%), Transportation Secretary Pete Buttigieg (58%–10%), Minnesota Sen. Amy Klobuchar (48%–12%), California Gov. Gavin Newsom (47%–13%), and Michigan Gov. Gretchen Whitmer (46%–9%). Only 1 in 4 voters can rate Illinois Gov. J.B. Pritzker (18%–6%). Author Marianne Williamson, who ran in 2020 and has announced her intention to run again in 2024, is also known by just 1 in 4 voters and has a net negative rating of 11% favorable and 16% unfavorable.
The Monmouth University Poll was conducted by telephone and online from March 16 to 20, 2023 with 542 Democrat and Democrat leaning voters in the United States. The question results in this release have a margin of error of +/- 6.3 percentage points for the full sample. The poll was conducted by the Monmouth University Polling Institute in West Long Branch, NJ.
QUESTIONS AND RESULTS
(* Some columns may not add to 100% due to rounding.)
[Q1-7 held for future release.]
8.Looking ahead to the 2024 presidential election and the Democratic nomination, what would you prefer to see happen if the choice was up to you? Would you prefer to see Joe Biden run for a second term, or would you prefer to see Joe Biden step aside so someone else can run as the Democrat, or do you have no preference either way?
| Response: | March 2023 |
|---|---|
| Prefer to see Joe Biden run for a second term | 25% |
| Prefer to see Joe Biden step aside so someone else can run as the Democrat | 44% |
| Have no preference either way | 30% |
| (VOL) Don’t know | 1% |
| (n) | (542) |
8A.If Joe Biden decides not to run, who would you like to see as the Democratic nominee for president? [LIST WAS NOT READ]
| Response: | March 2023 |
|---|---|
| Kamala Harris | 13% |
| Bernie Sanders | 6% |
| Elizabeth Warren | 4% |
| Pete Buttigieg | 6% |
| Michelle Obama | 1% |
| Marianne Williamson | 1% |
| Gavin Newsom | 3% |
| J.B. Pritzker | 1% |
| Tulsi Gabbard | 1% |
| Gretchen Whitmer | 1% |
| Amy Klobuchar | 1% |
| Hillary Clinton | 1% |
| Hakeem Jeffries | 1% |
| Cory Booker | 1% |
| Katie Porter | 1% |
| Barack Obama | 1% |
| Other | 6% |
| (VOL) Don’t know | 51% |
| (n) | (542) |
9.I’m going to read you the names of some leaders in the Democratic Party. Please tell me if your general impression of each is favorable or unfavorable, or if you don’t really have an opinion. If you have not heard of the person, just let me know. First, [READ NAME]. [NAMES WERE ROTATED]
| Response: | Favorable | Unfavorable | No opinion | Not heard of | (n) |
|---|---|---|---|---|---|
| President Joe Biden | 74% | 14% | 11% | 1% | (542) |
| Vice President Kamala Harris | 64% | 19% | 15% | 1% | (542) |
| Author Marianne Williamson | 11% | 16% | 21% | 52% | (542) |
| Former Georgia legislator Stacey Abrams | 64% | 6% | 17% | 13% | (542) |
| Transportation Secretary Pete Buttigieg | 58% | 10% | 19% | 13% | (542) |
| Illinois Governor J.B. Pritzker | 18% | 6% | 27% | 49% | (542) |
| Michigan Governor Gretchen Whitmer | 46% | 9% | 23% | 22% | (542) |
| Minnesota Senator Amy Klobuchar | 48% | 12% | 19% | 20% | (542) |
| California Governor Gavin Newsom | 47% | 13% | 28% | 12% | (542) |
| Vermont Senator Bernie Sanders | 71% | 12% | 13% | 3% | (542) |
| Massachusetts Senator Elizabeth Warren | 64% | 12% | 18% | 7% | (542) |
| Former President Barack Obama | 89% | 5% | 5% | 0% | (542) |
| Former First Lady Michelle Obama | 86% | 4% | 10% | 0% | (542) |
10.As you may recall, a number of Democratic candidates received support for president in 2020 before Joe Biden won the nomination. Who did you initially support for the nomination in 2020? [LIST WAS READ ONLY IF NEEDED]
| Response: | March 2023 |
|---|---|
| Joe Biden | 33% |
| Bernie Sanders | 20% |
| Elizabeth Warren | 11% |
| Amy Klobuchar | 3% |
| Pete Buttigieg | 8% |
| Kamala Harris | 4% |
| Mike Bloomberg | 1% |
| Cory Booker | 1% |
| Someone else | 1% |
| No one | 6% |
| Do not remember | 12% |
| (n) | (542) |
[Question 11 was asked only of those who named a candidate other than Biden in Q10: n=287, moe=+/-8.7%]
11.Looking back over the past two years, do you think the candidate you initially supported for president would have done a better job than Joe Biden has done, would have done a worse job than Joe Biden has done, or would have performed about the same as Joe Biden has done as president?
| Response: | March 2023 |
|---|---|
| Better than Biden | 44% |
| Worse than Biden | 9% |
| About the same as Biden | 46% |
| (VOL) Don’t know | 1% |
| (n) | (287) |
Methodology
The Monmouth University Poll was sponsored and conducted by the Monmouth University Polling Institute from March 16 to 20, 2023 with a probability-based national random sample of 542 registered voters who identify with or lean toward the Democrat Party. Interviews were conducted in English, and included 151 live landline telephone interviews, 229 live cell phone interviews, and 162 online surveys via a cell phone text invitation. Telephone numbers were selected through a mix of random digit dialing and list-based sampling. Landline respondents were selected with a modified Troldahl-Carter youngest adult household screen. Interviewing services were provided by Braun Research, with sample obtained from Dynata (RDD, n= 189), Aristotle (list, n= 260) and a panel of prior Monmouth poll participants (n= 93). Monmouth is responsible for all aspects of the survey design, data weighting and analysis. The full sample is weighted for region, age, education, gender and race based on voter list and US Census information (ACS 2021 one-year survey). For results based on this sample, one can say with 95% confidence that the error attributable to sampling has a maximum margin of plus or minus 6.3 percentage points, adjusted for sample design effects (1.50). Sampling error can be larger for sub-groups (see table below). In addition to sampling error, one should bear in mind that question wording and practical difficulties in conducting surveys can introduce error or bias into the findings of opinion polls.
DEMOGRAPHICS (weighted) |
| Self-Reported |
| 52% Strong Democrat |
| 21% Democrat, not strong |
| 27% Independent, lean Dem. |
| 42% Male |
| 58% Female |
| 23% 18-34 |
| 23% 35-49 |
| 26% 50-64 |
| 28% 65+ |
| 55% White |
| 22% Black |
| 16% Hispanic |
| 7% Asian/Other |
| 30% High school or less |
| 31% Some college |
| 39% 4 year degree |
Click on pdf file link below for full methodology and crosstabs by key demographic groups.


