
West Long Branch, NJ – The nation’s governors get better marks than the President for handling the COVID-19 outbreak, according to the Monmouth (“Mon-muth”) University Poll. Still, Donald Trump receives a net positive rating for his actions around the pandemic and his overall job rating has improved slightly since last month. Federal health agencies garner better marks than either the president or Congress for dealing with the crisis, but reviews are more mixed for how the media and the American public as a whole have handled it. Most Americans report experiencing a major impact from the coronavirus situation, with one-third saying they have suffered a loss in income.
More Americans say President Trump has done a good job (50%) rather than bad job (45%) dealing with the coronavirus outbreak. Governors, though, get even better ratings for handling the outbreak, with 72% of the public saying their state’s governor has done a good job to just 18% a bad job. Opinion of how Trump has dealt with the crisis is decidedly partisan, with the number saying he has done a good job ranging from 89% of Republicans to 48% of independents and 19% of Democrats. Public praise for the nations’ governors is much more bipartisan at 76% of Democrats, 73% of Republicans, and 67% of independents saying their governor has done a good job dealing with the situation.
Positive reviews for governors are fairly consistent regardless of how widespread the outbreak is in the various states. In the four states with the highest number of reported COVID-19 cases (see note*), 74% say their governor has done a good job. The same is true in states with a moderately low to moderately high number of cases (between 71% and 73% good job). Americans living in 16 states with the fewest reported cases are also positive about their governor’s response, but slightly less so at 61% good job. There also is less evidence of partisanship in these views within the states than there is for opinion of the president. In states with a Republican governor, 87% of Republicans who give their state’s chief executive positive marks are joined by 63% of independents and 61% of Democrats. In states under Democratic gubernatorial control, 87% of Democrats who say their governor is doing a good job are joined by 70% of independents and 62% of Republicans.
“The president gets more positive than negative marks for his handling of the COVID outbreak but his numbers are still driven by the nation’s typical partisan divide. Governors, on the other hand, seem to be emerging as the most trusted official voice in this crisis across the board,” said Patrick Murray, director of the independent Monmouth University Polling Institute.
Public opinion on the overall job Trump has done as president has ticked up since last month. His job rating now stands at 46% approve and 48% disapprove compared to 44% approve and 50% disapprove in February. He currently has a 91% approve to 5% disapprove rating among Republicans, 44% to 48% among independents, and 11% to 85% among Democrats. Changes over the past few months have been small, but of note, the 85% disapprove rating among Democrats marks the first time since the impeachment process started last summer that this number has been below 90%. The results for Republicans and independents are about where they have been since the start of this year.
“Trump has cast himself as a wartime president, but the small increase in his current job rating falls far short of the ‘rally round the flag’ effect past presidents have experienced,” said Murray. For example, George W. Bush’s job rating jumped nearly 30 points after 9/11 and John F. Kennedy’s approvals went up by about 10 points during the Cuban Missile Crisis.
Six in ten (62%) Americans say the steps taken by their individual states to slow the spread of the virus have been appropriate while 25% say they have not gone far enough. Another 9% say their state has gone too far. Americans are less satisfied with the actions of their federal government, with just under half (47%) saying federal measures have been appropriate and a similar number (45%) saying they have not gone far enough. Another 6% say the federal government has gone too far.
“Ambivalence toward the federal government’s response seems to be focused more on elected officials than on the civil servants who work in key agencies,” said Murray.
Health agencies within the federal government get largely positive marks of 65% good job and 24% bad job for their handling of the outbreak, making them second positive views to governors among the different entities asked about in the poll. That rating is better than views of the legislative branch, with 42% saying Congress has done a good job and 37% saying it has done a bad job. The media reporting about the outbreak gets a divided review of 45% good job and 43% bad job. The worst reviews among poll respondents are directed at their fellow citizens – 38% say the American public has done a good job dealing with the outbreak but 45% say it has done a bad job.
The poll finds that the pandemic has become the most influential factor in Americans’ lives right now. Without prompting, nearly 6 in 10 Americans (57%) name the coronavirus outbreak as the biggest concern currently facing their family. This sentiment is widespread, with the poll finding only minimal differences by demographic group in the number of people who name this as their family’s top concern. Other issues are named by far fewer people, including employment and job security (7%, compared to 7% in April 2019), paying everyday bills (6%, was 8%), the economy (5%, was 6%), and health care costs (5%, was 19%).
“The coronavirus outbreak has probably heightened the economic and health care anxieties we usually see at the top of this list. But the huge number of people who name COVID-19 as their top concern on this standard polling question illustrates just how all-consuming this pandemic has become in Americans’ daily lives,” said Murray.
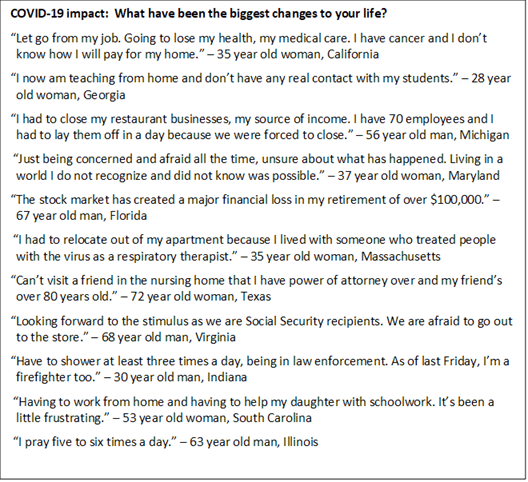
The poll finds that 53% of Americans report that the outbreak has had a major impact on their own daily lives. Another 32% say it has had a minor impact and 15% say it has had no real impact. Among those who say they have felt a major impact, nearly one-third (31%) report the biggest change has been cuts to their work hours or layoffs. Another 8% say the biggest change is working from home, 4% report an increase in their work load because of the outbreak and 9% report nonspecific work issues. Changes to social interactions are also among the major impacts mentioned, including being isolated or self-quarantined (13%), not being able to go out to public places (17%), and not being able to see family or friends (9%). Child-related issues are also present, with 11% saying having their school age children at home has been one of the biggest changes in their lives and 6% reporting that the closure of colleges and universities is the biggest impact. Other big changes reported are the shortage of food and supplies (13%) and a growing sense of fear, stress, and distrust (9%).
The poll specifically asked about seven potential impacts on Americans’ lives because of the COVID-19 outbreak. The most widely experienced impacts include not going out to stores and businesses as often as usual (66%) and spending more time watching TV and movies (57%). One-third (35%) of the public reports having experienced a loss in income, while one-fifth (20%) say they have started working from home for the first time. Other changes in habits include 22% who are spending more time shopping online, 12% who have started getting their groceries delivered, and 7% who have had problems getting child care (representing 18% of those who have minor children at home). Younger adults aged 18 to 34 years old (49%) are the most likely to report a loss of income when compared to those aged 35 to 54 (35%) and those aged 55 or over (23%). Those without a college degree (38%) are more likely than college graduates (29%) to report losing income due to the crisis.
Seven in ten Americans are concerned that someone in their family will become seriously ill from the coronavirus outbreak, including 38% who are very concerned and 32% who are somewhat concerned. Another 18% are not too concerned and 12% are not at all concerned. Those aged 55 and older (49%) are more likely to be very concerned about this than those 35 to 54 years old (38%) and those 18 to 34 years old (27%). Women (45%) and Americans who are Black, Latino, Asian or of other races (52%) are more likely than men (31%) and those who are white (31%) to be very concerned. More Democrats (58%) are very concerned than independents (31%) and Republicans (24%).
At the same time, the majority of Americans are either very confident (25%) or somewhat confident (37%) that the country will be able to limit the impact of the outbreak over the next few weeks. Another 21% are not too confident and 15% are not at all confident. Republicans (43%) are more likely than independents (22%) and Democrats (13%) to feel very confident about this.
Currently, 39% of the public says the country is headed in the right direction while 54% say it is on the wrong track. Last month’s poll results stood at 37% right direction and 57% wrong track.
The Monmouth University Poll was conducted by telephone from March 18 to 22, 2020 with 851 adults in the United States. The question results in this release have a margin of error of +/- 3.4 percentage points. The poll was conducted by the Monmouth University Polling Institute in West Long Branch, NJ.
* NOTE: COVID-19 spread by state is based on public reports and is divided into five relative categories. Note this is not an official definition, but is used only for purposes of making comparisons in the poll results:
–high (CA/NJ/NY/WA)
–moderately high (CO/FL/GA/IL/LA/MD/MA/NC/PA/TN/WI)
–moderate (MI/MN/NV/OH/OR/TX/VA)
–moderately low (AL/AR/CT/IN/IA/KY/ME/MS/NH/RI/SC/UT)
–low (AK/AZ/DE/HI/ID/KS/MO/MT/NE/NM/ND/OK/SD/VT/WV/WY)
QUESTIONS AND RESULTS
(* Some columns may not add to 100% due to rounding.)
1. Do you approve or disapprove of the job Donald Trump is doing as president?
| TREND: |
March 2020 | Feb. 2020 | Jan. 2020 | Dec. 2019 | Nov. 2019 | Sept. 2019 | Aug. 2019 | June 2019 | May 2019 | April 2019 | March 2019 | Jan. 2019 |
| Approve | 46% | 44% | 43% | 43% | 43% | 41% | 40% | 41% | 40% | 40% | 44% | 41% |
| Disapprove | 48% | 50% | 52% | 50% | 51% | 53% | 53% | 50% | 52% | 54% | 51% | 54% |
| (VOL) No opinion | 6% | 5% | 5% | 8% | 6% | 6% | 7% | 9% | 8% | 6% | 5% | 5% |
| (n) | (851) | (902) | (903) | (903) | (908) | (1,161) | (800) | (751) | (802) | (801) | (802) | (805) |
| TREND: Continued | Nov. 2018 | Aug. 2018 | June 2018 | April 2018 | March 2018 | Jan. 2018 | Dec. 2017 | Sept. 2017 | Aug. 2017 | July 2017 | May 2017 | March 2017 |
| Approve | 43% | 43% | 43% | 41% | 39% | 42% | 32% | 40% | 41% | 39% | 39% | 43% |
| Disapprove | 49% | 50% | 46% | 50% | 54% | 50% | 56% | 49% | 49% | 52% | 53% | 46% |
| (VOL) No opinion | 8% | 7% | 11% | 9% | 8% | 8% | 12% | 11% | 10% | 9% | 8% | 11% |
| (n) | (802) | (805) | (806) | (803) | (803) | (806) | (806) | (1,009) | (805) | (800) | (1,002) | (801) |
2. Would you say things in the country are going in the right direction, or have they gotten off on the wrong track?
| TREND: |
March 2020 |
Feb. 2020 |
Jan. 2020 |
Dec. 2019 |
Nov. 2019 |
Sept. 2019 |
Aug. 2019 |
June 2019 |
May 2019 |
April 2019 |
March 2019 |
| Right direction | 39% | 37% | 37% | 32% | 30% | 30% | 28% | 31% | 29% | 28% | 29% |
| Wrong track | 54% | 57% | 56% | 56% | 61% | 61% | 62% | 62% | 63% | 62% | 63% |
| (VOL) Depends | 4% | 6% | 6% | 8% | 7% | 6% | 8% | 6% | 4% | 7% | 6% |
| (VOL) Don’t know | 3% | 1% | 1% | 4% | 2% | 2% | 2% | 2% | 3% | 3% | 2% |
| (n) | (851) | (902) | (903) | (903) | (908) | (1,161) | (800) | (751) | (802) | (801) | (802) |
| TREND: Continued |
Nov. 2018 |
Aug. 2018 |
June 2018 |
April 2018 |
March 2018 |
Jan. 2018 |
Dec. 2017 |
Aug. 2017 |
May 2017 |
March 2017 |
Jan. 2017 |
| Right direction | 35% | 35% | 40% | 33% | 31% | 37% | 24% | 32% | 31% | 35% | 29% |
| Wrong track | 55% | 57% | 53% | 58% | 61% | 57% | 66% | 58% | 61% | 56% | 65% |
| (VOL) Depends | 7% | 6% | 3% | 5% | 6% | 3% | 7% | 4% | 5% | 4% | 4% |
| (VOL) Don’t know | 3% | 3% | 3% | 4% | 1% | 3% | 3% | 5% | 3% | 5% | 2% |
| (n) | (802) | (805) | (806) | (803) | (803) | (806) | (806) | (805) | (1,002) | (801) | (801) |
| TREND: Continued |
Aug. 2016* |
Oct. 2015 |
July 2015 |
June 2015 |
April 2015 |
Dec. 2014 |
July 2013 |
| Right direction | 30% | 24% | 28% | 23% | 27% | 23% | 28% |
| Wrong track | 65% | 66% | 63% | 68% | 66% | 69% | 63% |
| (VOL) Depends | 2% | 6% | 5% | 5% | 5% | 5% | 5% |
| (VOL) Don’t know | 3% | 4% | 3% | 3% | 2% | 3% | 4% |
| (n) | (803) | (1,012) | (1,001) | (1,002) | (1,005) | (1,008) | (1,012) |
* Registered voters
3. Turning to issues closer to home, what is the biggest concern facing your family right now? [LIST WAS NOT READ]
|
TREND: |
March 2020 |
April 2019 |
April 2018 |
Jan. 2017 |
Jan. 2015 |
| Coronavirus/COVID-19 | 57% | n/a | n/a | n/a | n/a |
| Job security, unemployment | 7% | 7% | 9% | 14% | 16% |
| Everyday bills, groceries, etc. | 6% | 8% | 12% | 12% | 16% |
| The economy | 5% | 6% | 3% | 3% | 2% |
| Health care costs | 5% | 19% | 13% | 25% | 15% |
| Family illness, health | 3% | 3% | 3% | 3% | 4% |
| Climate change, environment | 1% | 3% | 1% | 1% | n/a |
| Education policy | 1% | 2% | 2% | 1% | 2% |
| Housing, mortgage, rent | 1% | 2% | 4% | 3% | 4% |
| Safety, crime | 1% | 3% | 3% | 3% | 2% |
| Taxes | 1% | 9% | 7% | 4% | 7% |
| Trump as president | 1% | 1% | 1% | 1% | n/a |
| Civil rights | 0% | 3% | 1% | 3% | n/a |
| College tuition, school costs | 0% | 3% | 4% | 4% | 10% |
| Guns, gun ownership | 0% | 1% | 2% | n/a | n/a |
| Immigration | 0% | 5% | 4% | 3% | 1% |
| Quality of government | 0% | 2% | 3% | 1% | 2% |
| Retirement saving | 0% | 0% | 1% | 2% | 3% |
| Social Security, seniors | 0% | 3% | 3% | 3% | 2% |
| Terrorism, national security | 0% | 1% | 2% | 2% | 1% |
| Other | 2% | 5% | 5% | 2% | 4% |
| Don’t know/No answer | 9% | 16% | 15% | 10% | 8% |
| (n) | (851) | (801) | (803) | (801) | (1,003) |
4. How concerned are you about someone in your family becoming seriously ill from the coronavirus outbreak – very concerned, somewhat concerned, not too concerned, or not at all concerned?
|
March 2020 | |
| Very concerned | 38% |
| Somewhat concerned | 32% |
| Not too concerned | 18% |
| Not at all concerned | 12% |
| (VOL) Don’t know | 0% |
| (n) | (851) |
5. How confident are you that the country will be able to limit the impact of the outbreak over the next few weeks – very confident, somewhat confident, not too confident, or not at all confident?
|
March 2020 | |
| Very confident | 25% |
| Somewhat confident | 37% |
| Not too confident | 21% |
| Not at all confident | 15% |
| (VOL) Don’t know | 2% |
| (n) | (851) |
6. Please tell me if each of the following has done a good job or bad job dealing with the coronavirus outbreak. [ITEMS WERE ROTATED]
| Good Job | Bad job | (VOL) Mixed, depends | (VOL) Don’t know | (n) | |
| Health agencies in the federal government | 65% | 24% | 8% | 4% | (851) |
| President Trump | 50% | 45% | 3% | 1% | (851) |
| Your state’s governor | 72% | 18% | 4% | 6% | (851) |
| The media reporting about the outbreak | 45% | 43% | 10% | 3% | (851) |
| The American public | 38% | 45% | 14% | 3% | (851) |
| Congress | 42% | 37% | 10% | 10% | (851) |
[QUESTIONS 7 & 8 WERE ROTATED]
7. Have the measures taken by the federal government to slow the spread of the virus been appropriate, have they gone too far, or have they not gone far enough?
|
March 2020 | |
| Appropriate | 47% |
| Gone too far | 6% |
| Not gone far enough | 45% |
| (VOL) Don’t know | 2% |
| (n) | (851) |
8. Have the measures taken by your state government to slow the spread of the virus been appropriate, have they gone too far, or have they not gone far enough?
|
March 2020 | |
| Appropriate | 62% |
| Gone too far | 9% |
| Not gone far enough | 25% |
| (VOL) Don’t know | 4% |
| (n) | (851) |
9. Thinking about you personally, has the coronavirus outbreak had a major impact, minor impact, or no real impact on your own daily life?
|
March 2020 | |
| Major impact | 53% |
| Minor impact | 32% |
| No impact | 15% |
| (VOL) Don’t know | 0% |
| (n) | (851) |
[Q9A was asked only of those who said “MAJOR IMPACT” to Q9; n=468, moe=+/– 4.5%.]
9A. What have been the biggest changes to your life? [LIST WAS NOT READ]
[Note: Results add to more than 100% because multiple responses were accepted]
|
March 2020 | |
| Working from home | 8% |
| Less work/income | 31% |
| Increased work load | 4% |
| Work issues (not specific) | 9% |
| College closed/online | 6% |
| Kids home from school | 11% |
| Cannot go out (restaurants, church, gym, etc.) | 17% |
| Cannot visit family, friends | 9% |
| Self-isolation, quarantine | 13% |
| Change travel plans, ability | 5% |
| Shortages (food, supplies) | 13% |
| Fear, stress, lack of trust in system | 9% |
| Other | 7% |
| (VOL) Don’t know | 0% |
| (n) | (468) |
10. Have you personally done any of the following or had any of the following happen because of the coronavirus outbreak? [ITEMS WERE ROTATED]
| Yes, have done/has happened | No, have not done/has not happened | (VOL) Don’t know | (n) | |
| Started to work from home for the first time | 20% | 79% | 1% | (851) |
| Lost income due to a decrease in work hours or less business | 35% | 64% | 1% | (851) |
| Had problems finding child care | 7% | 89% | 4% | (851) |
| Started getting your groceries delivered | 12% | 87% | 1% | (851) |
| Spent more time shopping online | 22% | 78% | 0% | (851) |
| Spent more time watching TV and movies | 57% | 42% | 1% | (851) |
| Have not gone out to stores and businesses as often as you usually do | 66% | 33% | 0% | (851) |
[Q11-19 held for future release.]
METHODOLOGY
The Monmouth University Poll was sponsored and conducted by the Monmouth University Polling Institute from March 18 to 22, 2020 with a national random sample of 851 adults age 18 and older. This includes 340 contacted by a live interviewer on a landline telephone and 511 contacted by a live interviewer on a cell phone, in English. Telephone numbers were selected through random digit dialing and landline respondents were selected with a modified Troldahl-Carter youngest adult household screen. Monmouth is responsible for all aspects of the survey design, data weighting and analysis. The full sample is weighted for region, age, education, gender and race based on US Census information (CPS 2018 supplement). Data collection support provided by Braun Research (field) and Dynata (RDD sample). For results based on this sample, one can say with 95% confidence that the error attributable to sampling has a maximum margin of plus or minus 3.4 percentage points (unadjusted for sample design). Sampling error can be larger for sub-groups (see table below). In addition to sampling error, one should bear in mind that question wording and practical difficulties in conducting surveys can introduce error or bias into the findings of opinion polls.
| DEMOGRAPHICS (weighted) |
| Self-Reported |
| 28% Republican |
| 38% Independent |
| 34% Democrat |
| 49% Male |
| 51% Female |
| 31% 18-34 |
| 33% 35-54 |
| 36% 55+ |
| 64% White |
| 12% Black |
| 16% Hispanic |
| 8% Asian/Other |
| 68% No degree |
| 32% 4 year degree |
Click on pdf file link below for full methodology and crosstabs by key demographic groups.


