
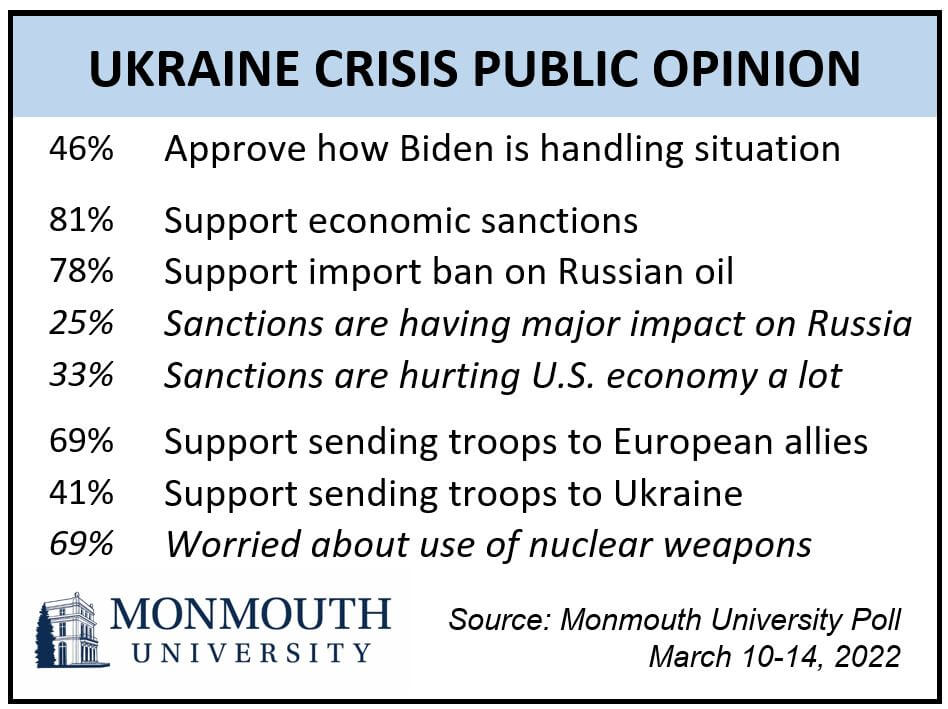
West Long Branch, NJ – Americans of all partisan stripes broadly favor imposing sanctions – including a fuel import ban – on Russia in response to its invasion of Ukraine. This support comes even though the public is about as likely to say that sanctions are hurting the U.S. economy as they are hindering Russia’s military operation. The Monmouth (“Mon-muth”) University Poll also finds widespread support for bolstering the security of our European allies with U.S. troops. However, public opinion is not as favorable toward the idea of sending American forces into Ukraine itself. Most Americans worry about the potential use of nuclear weapons in the conflict.
About 8 in 10 Americans (81%) support economic sanctions imposed by the United States in response to the invasion of Ukraine, including a ban on Russian gas and oil imports (78%). At least three-quarters of Republicans, Democrats, and independents alike support these actions.
Most Americans believe these sanctions are affecting Russia’s ability to continue its invasion, but only 25% feel they are having a major impact while another 49% say these sanctions are having a minor impact. Just 22% feel they are having no impact. At the same time, most Americans believe these sanctions are hurting the U.S. economy, including 33% who say they are hurting a lot and 39% who say they are hurting a little. Another 25% feel these sanctions are having no impact on the nation’s economy.
“The poll finds widespread bipartisan support for sanctions. Moreover, Americans appear willing to bear some financial burden, at least for the time being, in the hopes of stopping the Russian assault,” said Patrick Murray, director of the independent Monmouth University Polling Institute.
The poll also finds more than 2 in 3 Americans (69%) favor sending U.S. troops to support our European allies as a deterrent to keep Russia from invading those countries. However, just 41% support sending American forces into Ukraine itself, while a majority of 56% oppose such a move. There are only small partisan differences in support for sending troops to our European allies (78% of Democrats and 65% of Republicans) or to Ukraine (46% of Democrats and 37% of Republicans). About 7 in 10 Americans are concerned that the conflict will lead to the use of nuclear weapons, including 22% who are very worried about this and 47% who are somewhat worried.
Public opinion is evenly divided on the way President Joe Biden is handling the Ukraine situation – 46% approve and 48% disapprove. Despite bipartisan support on the sanctions imposed by his administration, just 18% of Republicans give Biden a positive rating for his overall handling of the crisis, compared to 77% of Democrats who approve.
“There was a time when an international crisis would unite the country behind both the federal government’s response as well as its leaders. That time is gone,” said Murray.
In other poll results, few Americans (7%) say that Russia’s actions in Ukraine are justified, while 89% say they are not justified. This belief is about evenly spread among Republicans, Democrats, and independents alike.
“There was a sense early in the conflict that conservative media may have primed a pro-Russia message. If so, it does not appear to have had an appreciable impact on public opinion about who is at fault,” said Murray.
It does not appear that the current situation has shifted public opinion on potential election meddling by Russia. About 2 in 3 say that Russia either definitely (33%) or probably (33%) tried to interfere in the 2020 U.S. election. These results are basically unchanged from two Monmouth polls taken prior to that contest. As in the previous polls, about 8 in 10 Democrats, 6 in 10 independents, and half of Republicans say it is likely Russia tried to interfere in the last presidential election.
The Monmouth University Poll was conducted by telephone from March 10 to 14, 2022 with 809 adults in the United States. The question results in this release have a margin of error of +/- 3.5 percentage points. The poll was conducted by the Monmouth University Polling Institute in West Long Branch, NJ.
QUESTIONS AND RESULTS
(* Some columns may not add to 100% due to rounding.)
[Q1-19 held for future release.]
20.Do you feel Russia’s actions in Ukraine are justified or not justified?
| March 2022 | |
| Justified | 7% |
| Not justified | 89% |
| (VOL) Don’t know | 4% |
| (n) | (809) |
21.Do you approve or disapprove of the way President Biden is handling the Ukraine situation?
| March 2022 | |
| Approve | 46% |
| Disapprove | 48% |
| (VOL) Don’t know | 6% |
| (n) | (809) |
22.The United States imposed economic sanctions on Russia in response to this situation. Do you support or oppose these sanctions?
| March 2022 | |
| Support | 81% |
| Oppose | 16% |
| (VOL) Don’t know | 4% |
| (n) | (809) |
23.Do you think these economic sanctions are having a major impact, minor impact, or no impact on Russia’s ability to continue its invasion of Ukraine?
| March 2022 | |
| Major impact | 25% |
| Minor impact | 49% |
| No impact | 22% |
| (VOL) Don’t know | 5% |
| (n) | (809) |
24.Do you think these sanctions are hurting the U.S. economy or generally having no impact on the U.S. economy? [If HURTING: Are they hurting a lot, or just a little?]
| March 2022 | |
| Hurting, a lot | 33% |
| Hurting, a little | 39% |
| No impact | 25% |
| (VOL) Don’t know | 3% |
| (n) | (809) |
25.Do you support or oppose the recent U.S. ban on Russian gas and oil imports?
| March 2022 | |
| Support | 78% |
| Oppose | 17% |
| (VOL) Don’t know | 5% |
| (n) | (809) |
26.Do you support or oppose the United States sending troops to support our European allies as a deterrent to keep Russia from invading those countries?
| March 2022 | |
| Support | 69% |
| Oppose | 28% |
| (VOL) Don’t know | 3% |
| (n) | (809) |
27.Do you support or oppose the United States sending troops into Ukraine?
| March 2022 | |
| Support | 41% |
| Oppose | 56% |
| (VOL) Don’t know | 4% |
| (n) | (809) |
28.Are you worried that the conflict in Ukraine will lead to the use of nuclear weapons – would you say very worried, somewhat worried, not too worried, or not at all worried?
| March 2022 | |
| Very worried | 22% |
| Somewhat worried | 47% |
| Not too worried | 18% |
| Not at all worried | 12% |
| (VOL) Don’t know | 1% |
| (n) | (809) |
29.Do you think the Russian government tried to interfere in the 2020 presidential election – would you say definitely, probably, probably not, or definitely not?
| TREND: | March 2022 | Sept. 2020* | Dec. 2019** |
| Definitely | 33% | 36% | 37% |
| Probably | 33% | 28% | 28% |
| Probably not | 19% | 21% | 17% |
| Definitely not | 13% | 10% | 13% |
| (VOL) Don’t know | 3% | 4% | 5% |
| (n) | (809) | (758) | (903) |
* Question wording in 2020 was “is trying to interfere” and was asked of registered voters only.
** Question wording in 2019 was “will try to interfere”.
[Q30-39 held for future release.]
[Q40 previously released.]
METHODOLOGY
The Monmouth University Poll was sponsored and conducted by the Monmouth University Polling Institute from March 10 to 14, 2022 with a probability-based national random sample of 809 adults age 18 and older. This includes 278 contacted by a live interviewer on a landline telephone and 531 contacted by a live interviewer on a cell phone, in English. Telephone numbers were selected through a mix of random digit dialing and list-based sampling. Landline respondents were selected with a modified Troldahl-Carter youngest adult household screen. Interviewing services were provided by Braun Research, with sample obtained from Dynata (RDD, n=545), Aristotle (list, n=140) and a panel of prior Monmouth poll participants (n=124). Monmouth is responsible for all aspects of the survey design, data weighting and analysis. The full sample is weighted for region, age, education, gender and race based on US Census information (ACS 2018 one-year survey). For results based on this sample, one can say with 95% confidence that the error attributable to sampling has a maximum margin of plus or minus 3.5 percentage points (unadjusted for sample design). Sampling error can be larger for sub-groups (see table below). In addition to sampling error, one should bear in mind that question wording and practical difficulties in conducting surveys can introduce error or bias into the findings of opinion polls.
| DEMOGRAPHICS (weighted) |
| Self-Reported |
| 29% Republican |
| 43% Independent |
| 28% Democrat |
| 49% Male |
| 51% Female |
| 30% 18-34 |
| 32% 35-54 |
| 38% 55+ |
| 63% White |
| 13% Black |
| 16% Hispanic |
| 8% Asian/Other |
| 70% No degree |
| 30% 4 year degree |
Click on pdf file link below for full methodology and crosstabs by key demographic groups.


