West Long Branch, NJ – Looking ahead to a second term, President Donald Trump has a significant deficit in the swing counties that were crucial to his 2016 victory. Still, a majority of Republican voters continue to back the incumbent over a couple of potential challengers for the GOP nomination. The Monmouth University Poll also finds little has changed in the status of the Democratic contest. Sen. Bernie Sanders has made some gains but he still holds onto only about half the voters who supported him in 2016.
Just under 4-in-10 registered voters (38%) say that Trump should be re-elected in 2020. A majority of 57% say it is time to have someone new in the Oval Office. These results are identical to a Monmouth poll taken in January and nearly identical to one taken in November.
Looking at Trump’s re-election prospects by key parts of the country suggests there may be trouble ahead in areas that were critical to his victory three years ago. In approximately 300 “swing” counties, accounting for about one-fifth of the total U.S. electorate, only 33% back the incumbent’s re-election compared with 61% who want a change in the Oval Office. In 2016, Hillary Clinton won the cumulative vote in these counties by just a single percentage point.
In the nearly 2,500 “red” counties that Trump won by an average of 36 points in 2016, his current standing is a comparatively narrower 58% for re-election and 39% for someone new. In the remaining 360 “blue” counties that Clinton won by about 35 points on average, only 21% of voters support Trump for a second term while 74% want someone new.
“Trump maintains his core base of support, but it’s not clear that he can still count on those swing voters that helped put him over the top in the Electoral College,” said Patrick Murray, director of the independent Monmouth University Polling Institute.
Republican voters and independents who lean Republican have become a little more likely to rally behind Trump’s re-nomination in 2020. Just over half (53%) would prefer to see Trump run unopposed, which is up from 49% who said the same in January. Another 40% would like to see Trump face a primary challenge, which is down slightly from 43% two months ago. Republicans who are under 50 years old are more likely to prefer a contested nomination battle (51%) than are GOP voters aged 50 and older (30%).
Importantly, most GOP voters say they stand firmly with Trump in a couple of potential matchups. Trump claims a majority base of support (54%) against former Massachusetts Gov. William Weld, who recently launched a presidential exploratory committee. Another 20% say they are with Trump now, but could possibly be swayed to support Weld. Only 8% say that they would vote for Weld now and another 10% are uncommitted but could possibly support Weld. The incumbent has a similarly firm 55% base of support against current Maryland Gov. Larry Hogan, who has been mentioned as a potential challenger. Another 20% of Republicans say they are with Trump now but could possibly be swayed to support Hogan. Only 6% say that they would vote for Hogan now and another 11% are uncommitted but could possibly support Hogan.
“Republican voters appear to say ‘no thanks’ as the potential for a nomination challenge to Trump becomes more real,” said Murray.
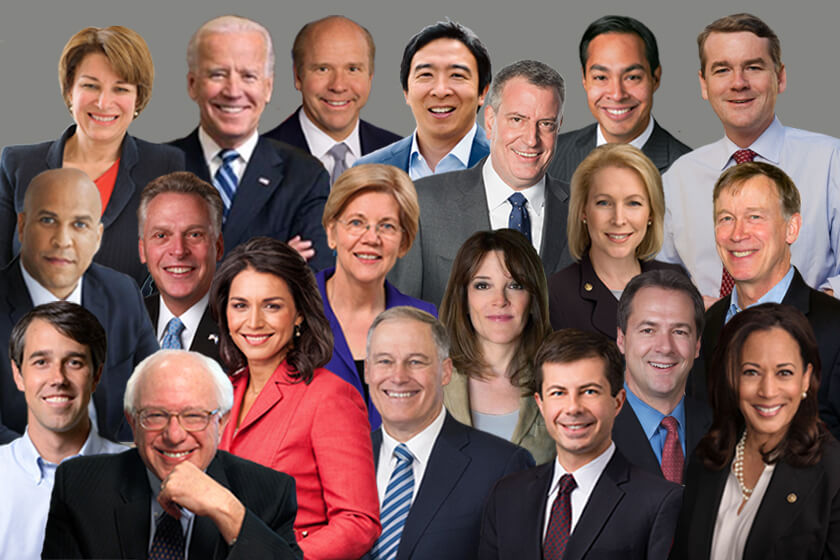
The poll also asked registered Democrats and Democratic-leaning independents about their party’s nomination process. Among a possible field of 23 announced and potential contenders, former Vice President Joe Biden currently has the support of 28% of Democratic voters (similar to his 29% support in January), closely followed by Vermont’s Sanders at 25% (up from 16% in January). Other candidate support remains largely unchanged from January, including California Sen. Kamala Harris (10%), Massachusetts Sen. Elizabeth Warren (8%), former Texas Congressman Beto O’Rourke (6%), New Jersey Sen. Cory Booker (5%), and Minnesota Sen. Amy Klobuchar (3%). Former New York City Mayor Mike Bloomberg, who announced he would not run after the poll was conducted, registers 2%. The remaining 15 names asked about in the survey receive support from no more than 1% of Democratic voters at this time.
Sanders holds onto about half (46%) of the Democrats who backed him in his 2016 run and he gets 14% of those who were with Clinton in the last nomination contest. The remainder of Sanders’s past supporters are divided among Biden (15%), Harris (8%), Warren (6%), New York City Mayor Bill de Blasio (4%), Klobuchar (3%), Booker (3%), and a number of other contenders.
If Biden chooses not to run, about a quarter of his support would go to Sanders, with Harris being the second beneficiary. Recalculating current Democratic support using the second choice of Biden voters gives Sanders a total of 32%, Harris 15%, Warren 10%, O’Rourke 7%, Booker 6%, and Klobuchar 3%.
“Without Biden in the race, Sanders could replicate the level of national support he had in 2016. But it’s not clear how much more he can build on that with so many fresh faces in the field,” said Murray. In the current poll, 61% of Democrats say they supported Clinton in 2016 and 34% say they backed Sanders. A March 2016 poll – the last time Monmouth conducted a national preference poll of the Democratic nomination that year – had party support for Clinton at 55% and Sanders at 37%.
| 2020 DEMOCRATIC FIELD – PARTY VOTER OPINION | ||||
|
Total w/ | Net rating | Favorable |
| |
|
89 | Joe Biden |
+63 | 76 |
13 |
|
87 | Bernie Sanders |
+53 | 70 |
17 |
|
68 | Elizabeth Warren |
+30 | 49 |
19 |
|
64 | Kamala Harris |
+42 | 53 |
11 |
|
55 | Cory Booker |
+31 | 43 |
12 |
|
50 | Beto O’Rourke |
+26 | 38 |
12 |
|
42 | Bill de Blasio |
-6 | 18 |
24 |
|
39 | Amy Klobuchar |
+13 | 26 |
13 |
|
20 | Michael Bennet |
+6 | 13 |
7 |
|
19 | Jay Inslee |
+7 | 13 |
6 |
|
12 | Steve Bullock |
0 | 6 |
6 |
|
12 | Marianne Williamson |
+4 | 8 |
4 |
|
| ||||
There has been little movement in voter opinion of nine Democratic candidates and potential presidential contenders who were included in Monmouth’s polling in both January and March. Biden and Sanders continue to be the best known. Biden’s favorability rating remains the strongest in the field at a net +63 (76% favorable and 13% unfavorable), but this has declined slightly from his net +71 rating earlier in the year (80%-9%). Sanders’s rating has basically held steady at +53 (70%-17%), which is similar to his +49 net rating in January (68%-19%).
Harris’s rating has improved from a net +33 in January (46% favorable and 13% unfavorable) to a net +42 now (53%-11%), while Warren’s rating has declined from a net +40 (57%-17%) to a net +30 (49%-19%). O’Rourke has also seen his rating slip a bit from a net +32 in January (41%-19%) to a net +26 (38%-12%). Booker’s rating has remained stable, going from +33 (44%-11%) to +31 (43%-12%). Klobuchar’s net rating has also remained steady – from +15 (23%-8%) to +13 (26%-13%), but with an 8 point uptick in her name awareness since she launched her campaign. Inslee, who announced his candidacy just before this poll commenced, has gone from a +3 net rating (11%-8%) to a +7 net rating (13%-6%), with no change in his low name recognition nationally.
For the record, Bloomberg’s rating stands at a net +1 among Democrats (27%-26%), which is down from a net +10 in January (35%-25%). Among four new names included the latest Monmouth poll, Blooomberg’s city hall successor gets a net negative rating from fellow Democrats. Just 18% have a favorable view of de Blasio while 24% have an unfavorable opinion of him. De Blasio’s is the only name among 23 candidates or potential candidates who have been tested in Monmouth’s polling this year to earn a net negative rating among Democrats.
None of the other three new names included in the current poll are particularly well known. Colorado Sen. Michael Bennet gets a 13% favorable and 7% unfavorable rating, Montana Gov. Steve Bullock gets a 6% favorable and 6% unfavorable rating, and author Marianne Williamson gets an 8% favorable and 4% unfavorable rating.
Note from poll director Patrick Murray on Monmouth’s approach to the 2020 Democratic field:
“The recently announced DNC debate rules have once again put a sharp focus on public polling’s role in the presidential nomination process. In 2015, the RNC used polling to determine which candidates would make it into the ‘primetime’ debate and which would be relegated to the undercard. This time, the Democrats are using polls to determine who can make it into the debates at all, with such a low threshold that it really comes down to whether a pollster simply chooses to include a candidate’s name.
“Monmouth’s experience polling the Republican nomination contest in the last cycle demonstrated we could poll a large field with reasonable accuracy. We maxed out at 17 names in that contest. Our initial poll of the 2020 race in January included 19 declared and potential candidates for the Democratic nomination. After the DNC announcement, we expanded that to 23 names.
“In the 2016 GOP contest, polling was used to separate the field into two tiers of viability. The problem then was that the margin of error inherent in polling could end up relegating a candidate to the lower-tier debate. The Democrats have attempted to overcome that problem by doing away with the tiered debate structure in favor of random assignment. Any candidate who gets at least one percent in three separate polls will qualify for the debates as long as there are no more than 20 candidates.
“Four years ago, pollsters were concerned that the determination of whether a candidate could take the main stage conferred too much precision on poll results. In 2019, we are faced with a different problem. The main thing standing between a candidate registering one percent and zero percent in any particular poll is each pollster’s decision of whom to include. This places an undue editorial burden on public polling outfits.
“With this responsibility in mind, Monmouth will attempt to be as inclusive as possible in its polling of the Democratic field in these early stages of the campaign. In general, we will include any declared candidate who has held federal or statewide office. We will also include those who have shown fundraising ability, such as Andrew Yang, as well as those who may have the potential to register support in early states based on other metrics. For example, Marianne Williamson is included in the current poll because she has paid staff in Iowa and raised over a million dollars in a prior House run. These are necessarily judgment calls, but we would rather err on the side of inclusion given the DNC debate criteria.
“For the record, declared candidates Booker, Harris, Klobuchar, Sanders, and Warren have all cleared the one percent threshold in Monmouth’s polls this year. Julián Castro, Tulsi Gabbard, Kirsten Gillibrand, John Hickenlooper, and Yang have all reached one percent. Those who have yet to score one percent after rounding in Monmouth’s polls are Pete Buttigieg, John Delaney, Jay Inslee, and Williamson.”
The Monmouth University Poll was conducted by telephone from March 1 to 4, 2019 with 746 registered voters in the United States, which has a +/- 3.6 percentage point sampling margin of error. The results in this release based on 339 registered Republicans and leaning Republican voters have a margin of error of +/- 5.3 percentage points. The results in this release based on 310 registered Democrats and leaning Democratic voters have a margin of error of +/- 5.6 percentage points. The poll was conducted by the Monmouth University Polling Institute in West Long Branch, NJ.
QUESTIONS AND RESULTS
(* Some columns may not add to 100% due to rounding.)
[Q1-8 previously released.]
9. Looking ahead to the 2020 election for President, do you think that Donald Trump should be re-elected, or do you think that it is time to have someone else in office?
| TREND: | March 2019 | Jan. 2019 | Nov. 2018 |
| Should be re-elected | 38% | 38% | 37% |
| Time to have someone else | 57% | 57% | 58% |
| (VOL) Don’t know | 5% | 5% | 4% |
| (n) | (746) | (735) | (716) |
[Questions 10 through 12 were asked of registered Republicans / leaning Republican voters; n=339, moe= +/- 5.3%]
10. I know the 2020 election is far away, but would you prefer that Donald Trump run unopposed for the Republican nomination or would you prefer to see him face a primary challenge in 2020?
| TREND: | March 2019 | Jan. 2019 |
| Trump run unopposed | 53% | 49% |
| Face a primary challenge | 40% | 43% |
| (VOL) Don’t know | 7% | 8% |
| (n) | (339) | (335) |
[QUESTIONS 11 & 12 WERE ROTATED]
11. Who would you support if the 2020 Republican nomination contest was between Donald Trump and former Massachusetts governor William Weld? [If TRUMP or UNSURE: Is it at least somewhat possible that you would support Weld over Trump a year from now or is it not at all possible?]
| March 2019 | |
| Trump firm | 54% |
| Trump but possible Weld | 20% |
| Weld | 8% |
| Unsure but possible Weld | 10% |
| (VOL) Neither | 0% |
| (VOL) Don’t know | 8% |
| (n) | (339) |
12. Who would you support if the 2020 Republican nomination contest was between Donald Trump and Maryland governor Larry Hogan? [If TRUMP or UNSURE: Is it at least somewhat possible that you would support Hogan over Trump a year from now or is it not at all possible?]
| March 2019 | |
| Trump firm | 55% |
| Trump but possible Hogan | 20% |
| Hogan | 6% |
| Unsure but possible Hogan | 11% |
| (VOL) Neither | 2% |
| (VOL) Don’t know | 5% |
| (n) | (339) |
[Questions 13 through 15 were asked of registered Democrats / leaning Democratic voters; n=310, moe= +/- 5.6%]
13. I know the 2020 election is far away, but who would you support for the Democratic nomination for president if the candidates were the following? [INCLUDES LEANERS] [NAMES WERE ROTATED]
| TREND: (with leaners) | March 2019 | Jan. 2019 |
| Joe Biden | 28% | 29% |
| Bernie Sanders | 25% | 16% |
| Kamala Harris | 10% | 11% |
| Elizabeth Warren | 8% | 8% |
| Beto O’Rourke | 6% | 7% |
| Cory Booker | 5% | 4% |
| Amy Klobuchar | 3% | 2% |
| Mike Bloomberg | 2% | 4% |
| Sherrod Brown | 1% | 1% |
| Julián Castro | 1% | 1% |
| Bill de Blasio | 1% |
n/a |
| John Hickenlooper | 1% | 1% |
| Andrew Yang | 1% | 1% |
| Michael Bennet |
<1% |
n/a |
| Pete Buttigieg |
<1% | 0% |
| Tulsi Gabbard |
<1% | 1% |
| Kirsten Gillibrand |
<1% | 1% |
| Eric Holder |
<1% |
1% |
| Jay Inslee |
<1% |
<1% |
| Terry McAuliffe |
<1% |
<1% |
| Marianne Williamson |
<1% |
n/a |
| Steve Bullock |
0% |
n/a |
| John Delaney | 0% |
<1% |
| (VOL) Other |
<1% | 1% |
| (VOL) No one |
<1% | 3% |
| (VOL) Undecided |
8% | 9% |
| (n) | (310) | (313) |
13B. If Joe Biden does not run for president, who would be your second choice? [Results in table below reflect preferences of all Democrats after Biden supporters’ second choices are reallocated.]
| March 2019 | |
| Bernie Sanders | 32% |
| Kamala Harris | 15% |
| Elizabeth Warren | 10% |
| Beto O’Rourke | 7% |
| Cory Booker | 6% |
| Amy Klobuchar | 3% |
| Mike Bloomberg | 2% |
| Sherrod Brown | 2% |
| Julián Castro | 1% |
| Bill de Blasio | 1% |
| Kirsten Gillibrand | 1% |
| John Hickenlooper | 1% |
| Andrew Yang | 1% |
| Michael Bennet |
<1% |
| Pete Buttigieg |
<1% |
| Tulsi Gabbard |
<1% |
| Eric Holder |
<1% |
| Jay Inslee |
<1% |
| Terry McAuliffe |
<1% |
| Marianne Williamson |
<1% |
| Steve Bullock |
0% |
| John Delaney | 0% |
| (VOL) Other |
<1% |
| (VOL) No one | 2% |
| (VOL) Undecided | 15% |
| (n) | (310) |
14. I’m going to read you the names of some people who are running or might run for president in 2020. Please tell me if your general impression of each is favorable or unfavorable, or if you don’t really have an opinion. If you have not heard of the person, just let me know. [NAMES WERE ROTATED]
|
Favorable | Unfavorable | No opinion | Not heard of |
(n) | |
| Former Vice President Joe Biden | 76% | 13% | 9% | 2% | (310) |
| –January 2019 | 80% | 9% | 8% | 3% | (313) |
| Vermont Senator Bernie Sanders | 70% | 17% | 10% | 3% | (310) |
| — January 2019 | 68% | 19% | 9% | 4% | (313) |
| Massachusetts Senator Elizabeth Warren | 49% | 19% | 15% | 17% | (310) |
| — January 2019 | 57% | 17% | 16% | 11% | (313) |
| Former Texas Congressman Beto O’Rourke | 38% | 12% | 21% | 29% | (310) |
| — January 2019 | 41% | 9% | 23% | 27% | (313) |
| Former New York Mayor Mike Bloomberg | 27% | 26% | 31% | 17% | (310) |
| — January 2019 | 35% | 25% | 33% | 7% | (313) |
| Minnesota Senator Amy Klobuchar | 26% | 13% | 29% | 33% | (310) |
| — January 2019 | 23% | 8% | 30% | 39% | (313) |
| New Jersey Senator Cory Booker | 43% | 12% | 20% | 25% | (310) |
| — January 2019 | 44% | 11% | 20% | 25% | (313) |
| California Senator Kamala Harris | 53% | 11% | 16% | 20% | (310) |
| — January 2019 | 46% | 13% | 21% | 20% | (313) |
| Montana Governor Steve Bullock | 6% | 6% | 30% | 58% | (310) |
| — January 2019 |
–– | — | — | — |
— |
| New York City Mayor Bill de Blasio | 18% | 24% | 35% | 23% | (310) |
| — January 2019 |
— | — | — | — |
— |
| Colorado Senator Michael Bennet | 13% | 7% | 32% | 48% | (310) |
| — January 2019 |
— | — | — | — |
— |
| Author Marianne Williamson | 8% | 4% | 21% | 67% | (310) |
| — January 2019 |
— | — | — | — |
— |
| Washington Governor Jay Inslee | 13% | 6% | 31% | 50% | (310) |
| — January 2019 | 11% | 8% | 35% | 46% | (313) |
15. In the 2016 race for the Democratic nomination, did you support Hillary Clinton or Bernie Sanders?
| March 2019 | |
| Hillary Clinton | 61% |
| Bernie Sanders | 34% |
| (VOL) Other candidate | 1% |
| (VOL) No one | 4% |
| (VOL) Don’t know | 1% |
| (n) | (310) |
[Q16-29 previously released.]
[Q30-36 held for future release.]
METHODOLOGY
The Monmouth University Poll was sponsored and conducted by the Monmouth University Polling Institute from March 1 to 4, 2019 with a national random sample of 802 adults age 18 and older, in English. This includes 322 contacted by a live interviewer on a landline telephone and 480 contacted by a live interviewer on a cell phone. The results in this poll release are based on a subsample of 746 registered voters. Telephone numbers were selected through random digit dialing and landline respondents were selected with a modified Troldahl-Carter youngest adult household screen. Monmouth is responsible for all aspects of the survey design, data weighting and analysis. Final sample is weighted for region, age, education, gender and race based on US Census information. Data collection support provided by Braun Research (field) and SSI (RDD sample). For results based on the registered voter sample, one can say with 95% confidence that the error attributable to sampling has a maximum margin of plus or minus 3.6 percentage points (unadjusted for sample design). Sampling error can be larger for sub-groups (see table below). In addition to sampling error, one should bear in mind that question wording and practical difficulties in conducting surveys can introduce error or bias into the findings of opinion polls.
| DEMOGRAPHICS (weighted) |
| REGISTERED VOTERS |
|
Self-Reported |
| 28% Republican |
| 41% Independent |
| 32% Democrat |
| 47% Male |
| 53% Female |
| 28% 18-34 |
| 35% 35-54 |
| 37% 55+ |
| 65% White |
| 12% Black |
| 15% Hispanic |
|
7% Asian/Other |
| 67% No degree |
| 33% 4 year degree |
Click on pdf file link below for full methodology and crosstabs by key demographic groups.


