
West Long Branch, NJ – In a presidential contest that remains tight, voters are more likely to express concerns about President Joe Biden’s stamina than say the same about former President Donald Trump. The Monmouth (“Mon-muth”) University Poll finds that nearly half the electorate foresees the possibility that Biden may be replaced as the Democratic nominee before November, primarily for health reasons. At the same time, one-third think the Republicans could replace Trump, although in this case it would be due to his legal troubles rather than his physical or mental fitness. The poll also finds that a majority of voters feel that individual states should not be able to remove Trump’s name from the ballot.
In a Biden-Trump rematch, just over 4 in 10 registered voters say they will either definitely (30%) or probably (14%) vote for the Democratic incumbent and, in a separate question, a similar number will definitely (30%) or probably (16%) support the former Republican president. These results have not moved much since the fall, with both candidates seeing statistically insignificant 2 to 4 point increases.
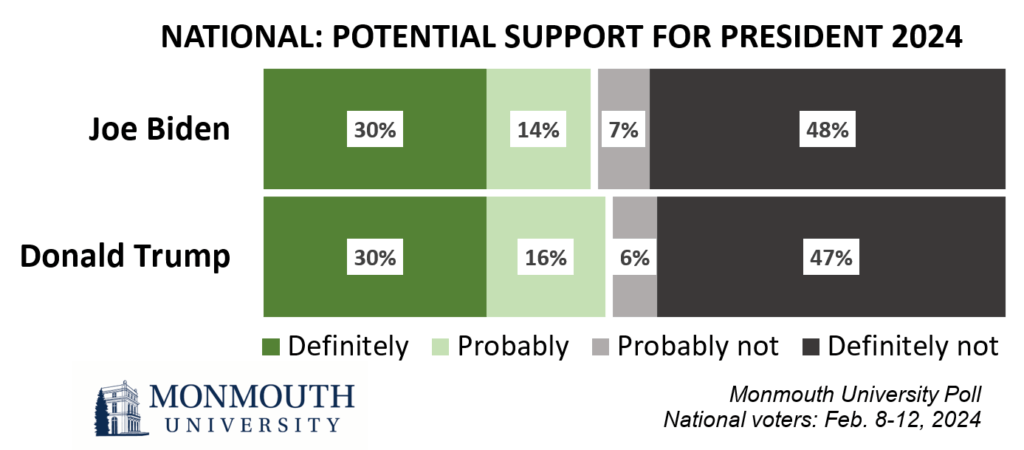
Trump does better with non-Hispanic white voters (51% are definite or probable supporters) than with voters who are Black, Hispanic, Asian, or of another race (37%). The results are flipped for Biden, who gets 53% support from people of color and 38% support from white voters. However, education is a mitigating factor. Biden does better among white college graduates (53%) than he does among whites without a college degree (28%), while it is the opposite for Trump with 63% support among whites without a college degree and 36% among white college graduates. Overall, there are no significant age differences in support. Trump has 49% support and Biden has 46% support among voters age 55 and older, while Trump has 40% support and Biden has 42% support among voters under the age of 35.
“Younger voters have tended to lean more Democratic in recent elections. The fact that there is little difference in candidate preference among them now indicates that other factors are at play. One of these factors may be perceptions of the candidates’ ages, where Biden is seen in a more negative light than Trump,” said Patrick Murray, director of the independent Monmouth University Polling Institute.
Overall, 51% of voters are at least somewhat confident that Trump has the mental and physical stamina necessary to carry out the job of president. Just 32% say the same about Biden. This is a significant shift in attitudes from four years ago toward these two men, especially for Biden. In the summer of 2020, 45% of voters were confident in Trump’s stamina (6 points lower than now) and 52% were confident in Biden’s stamina (a significant 20 points higher than now). The decline in views about Biden’s abilities have come from Democrats (72% confident, down from 91% in 2020), independents (20%, down from 48%), and Republicans (2%, down from 14%) alike.
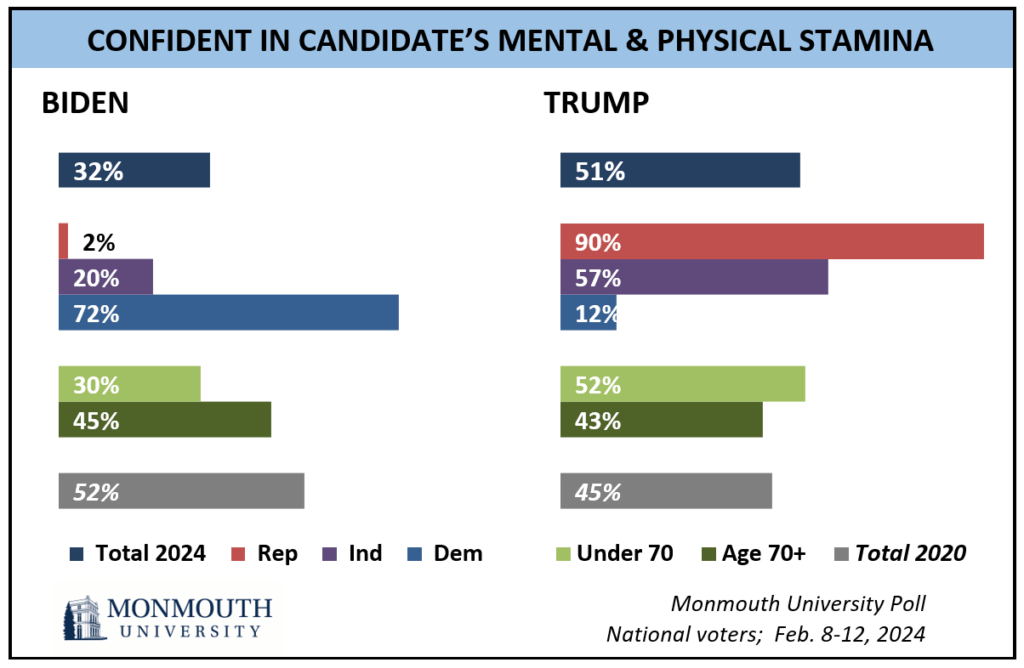
There is a counterfactual finding to these concerns in the current poll. To the extent there are variations in seeing Trump as being more physically and mentally fit than Biden, those differing views come from voters under 70 years old rather than voters in the same age bracket as the two candidates. Specifically, 45% of those age 70 and older are at least somewhat confident about Biden’s stamina and a nearly identical 43% say the same about Trump. Conversely, 52% are not confident about Biden’s health and 53% say the same about Trump. Among those under the age of 70, though, there is a sizable difference between confidence in Trump’s stamina (52%) and Biden’s stamina (30%).
“It’s interesting that voters in the same age bracket as both candidates don’t see much of a difference in terms of their stamina. But younger voters clearly have different perceptions of the two. This is probably one reason why many think Biden’s name may not be on the ballot in the fall – more than say the same about Trump,” said Murray.
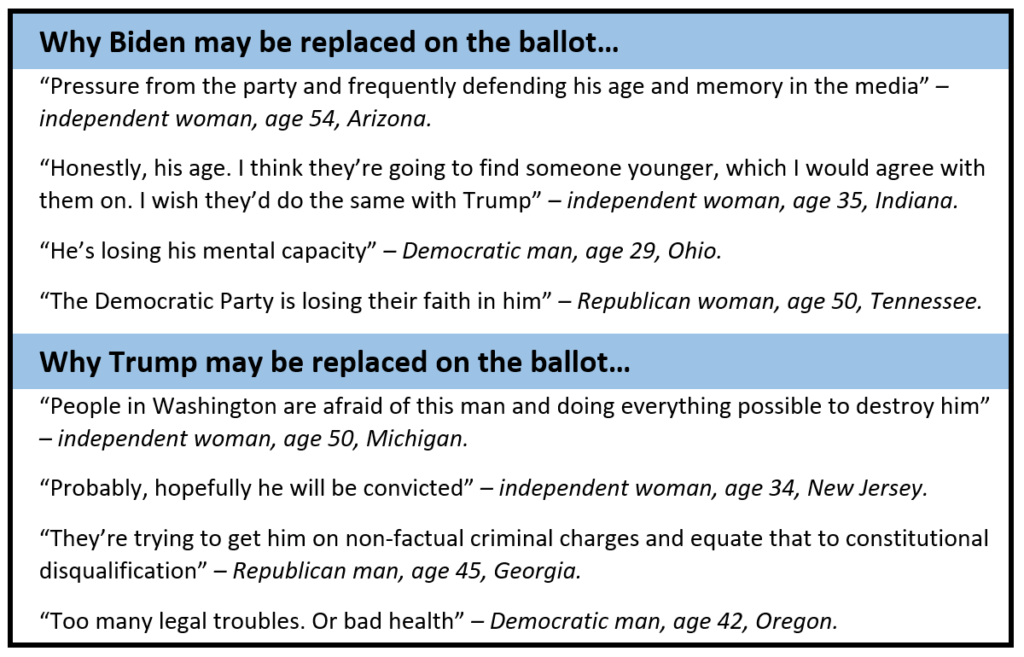
Nearly half of the electorate thinks it is either very (20%) or somewhat (28%) likely that Biden will be replaced as the Democratic nominee on the presidential ballot in November. By comparison, one-third (10% very and 22% somewhat likely) think it is possible that Trump will be replaced as the Republican nominee. In a follow-up question, those who think Biden will be replaced generally mention his age, physical health or mental facilities as reasons he will be replaced as the Democrats’ standard bearer. Some others, mainly Republicans, feel he will be pushed aside by his party. Among those who feel Trump could be replaced as the GOP nominee, most cite his legal troubles – with some Republicans in this group stipulating that the charges are false – while just a few mention Trump’s health as the issue that could push him off the ticket.
When asked about Trump’s response to the 2020 election outcome, more than 4 in 10 voters (45%) maintain that his actions were criminal, while another 25% say he did something wrong but not criminal and 29% say Trump did nothing wrong. Turning to Biden, who is facing a House inquiry, 32% say he should be impeached, 18% say he may have violated his oath of office but should not be impeached, and 46% say he has not violated his oath. Most Democrats (86%) say Trump committed a crime related to the 2020 election and most Republicans (66%) say Biden should be impeached. These findings are basically unchanged from September.
After the special counsel Robert Hur released a report on Biden’s handling of classified documents, the Monmouth poll added a series of questions that were first asked a year ago when news emerged about Biden having these documents in his home. The findings suggest the report has not moved public opinion on this issue. Currently, 63% of voters believe Biden knew about these documents being in his home – which is only slightly higher than in January 2023 (58%). Just 36% are very concerned that the documents found in Biden’s home would pose a threat to national security if they fell into the wrong hands – similar to 39% who said the same a year ago. Turning to the Republican former president, who is currently facing criminal charges for his handling of classified documents, 83% of voters think Trump knew about their presence in his home (similar to 80% in 2023) and 43% are very concerned that the release of these documents would pose a national security threat (similar to 41% in 2023).
“The Hur report doesn’t seem to have shifted public opinion on whether Biden mishandled classified documents. At the same time, it probably has done more to reinforce existing views of Biden’s physical and mental vigor. When we asked a different question about each candidate’s age back in the fall, there was already a wide gap in concern about Biden compared with Trump,” said Murray.
Overall, 40% of voters are at least somewhat enthusiastic about Trump being the Republican nominee for president, while fewer (32%) feel the same about Biden being the Democratic nominee. While this latter group includes a majority of Democratic voters who are enthusiastic about Biden (62%), it is a smaller majority than Republicans who are enthusiastic about Trump being their nominee (80%). Among Democrats, more partisans age 50 and older (76%) are enthusiastic about Biden running again than are Democrats younger than 50 years old (47%). There are no significant age-based differences among Republicans in their enthusiasm for another run by Trump.
The poll also asked about states removing Trump from the ballot, which is currently being considered by the U.S. Supreme Court. While 41% of voters say that individual states should be able to remove Trump’s name for engaging in insurrection, a majority of 56% say they should not be able to do this. Not surprisingly, 76% of Democrats say states should have this power while 90% of Republicans say they should not. Among independents, 35% would give states this power while 62% would not.
The Monmouth University Poll was conducted by telephone from February 8 to 12, 2024 with 902 adults in the United States. The question results in this release are based on 822 registered voters and have a margin of error +/- 4.3 percentage points. The poll was conducted by the Monmouth University Polling Institute in West Long Branch, NJ.
QUESTIONS AND RESULTS
(* Some columns may not add to 100% due to rounding.)
[Q1-17 held for future release.]
Look ahead to this year’s presidential election, assuming the nominees will be Democrat Joe Biden and Republican Donald Trump.
[QUESTIONS 18 & 19 WERE ROTATED]
18.How likely are you to vote for Donald Trump – will you definitely vote for him, probably vote for him, probably not vote for him, or definitely not vote for him?
| Trend: Registered voters | Feb. 2024 | Dec. 2023 | Sept. 2023 | July 2023 | May 2023 |
|---|---|---|---|---|---|
| Definitely | 30% | 29% | 31% | 26% | 29% |
| Probably | 16% | 13% | 12% | 14% | 12% |
| Probably not | 6% | 8% | 8% | 8% | 8% |
| Definitely not | 47% | 48% | 48% | 50% | 46% |
| (VOL) Don’t know | 1% | 2% | 1% | 1% | 4% |
| (n) | (822) | (743) | (737) | (840) | (907) |
19.How likely are you to vote for Joe Biden – will you definitely vote for him, probably vote for him, probably not vote for him, or definitely not vote for him?
| Trend: Registered voters | Feb. 2024 | Dec. 2023 | Sept. 2023 | July 2023 | May 2023 |
|---|---|---|---|---|---|
| Definitely | 30% | 31% | 31% | 36% | 32% |
| Probably | 14% | 11% | 11% | 11% | 13% |
| Probably not | 7% | 7% | 6% | 6% | 7% |
| Definitely not | 48% | 49% | 51% | 46% | 45% |
| (VOL) Don’t know | 1% | 1% | 1% | 1% | 3% |
| (n) | (822) | (743) | (737) | (840) | (907) |
[QUESTIONS 20 & 21 WERE ROTATED]
20.How do you feel about Donald Trump being the Republican Party’s nominee for president in 2024 – are you very enthusiastic, somewhat enthusiastic, not too enthusiastic, or not at all enthusiastic?
| Trend: Registered voters | Feb. 2024 | Sept. 2023* |
|---|---|---|
| Very enthusiastic | 22% | 19% |
| Somewhat enthusiastic | 18% | 18% |
| Not too enthusiastic | 10% | 10% |
| Not at all enthusiastic | 49% | 52% |
| (VOL) Don’t know | 1% | 1% |
| (n) | (822) | (737) |
21.How do you feel about Joe Biden being the Democratic Party’s nominee for president in 2024 – are you very enthusiastic, somewhat enthusiastic, not too enthusiastic, or not at all enthusiastic?
| Trend: Registered voters | Feb. 2024 | Sept. 2023* |
|---|---|---|
| Very enthusiastic | 14% | 14% |
| Somewhat enthusiastic | 18% | 18% |
| Not too enthusiastic | 16% | 15% |
| Not at all enthusiastic | 51% | 53% |
| (VOL) Don’t know | 1% | 1% |
| (n) | (822) | (737) |
There is the possibility that a candidate who wins the presidential primaries might end up being replaced as the party’s nominee before the general election.
[QUESTIONS 22 & 23 WERE ROTATED]
22.How likely do you think it is that Donald Trump will be replaced as the Republican nominee on the presidential ballot in November? Is this very likely, somewhat likely, not too likely, or not at all likely to happen?
| Registered voters | Feb. 2024 |
|---|---|
| Very likely | 10% |
| Somewhat likely | 22% |
| Not too likely | 26% |
| Not at all likely | 40% |
| (VOL) Don’t know | 2% |
| (n) | (822) |
23.How likely do you think it is that Joe Biden will be replaced as the Democratic nominee on the presidential ballot in November? Is this very likely, somewhat likely, not too likely, or not at all likely to happen?
| Registered voters | Feb. 2024 |
|---|---|
| Very likely | 20% |
| Somewhat likely | 28% |
| Not too likely | 23% |
| Not at all likely | 27% |
| (VOL) Don’t know | 1% |
| (n) | (822) |
[QUESTIONS 24 & 25 WERE ROTATED]
24.How confident are you that Donald Trump has the mental and physical stamina necessary to carry out the job of president – very confident, somewhat confident, not too confident, or not at all confident?
Trend: Registered voters | Feb. 2024 | June 2020 |
|---|---|---|
| Very confident | 36% | 33% |
| Somewhat confident | 15% | 12% |
| Not too confident | 10% | 11% |
| Not at all confident | 38% | 43% |
| (VOL) Don’t know | 1% | 1% |
| (n) | (822) | (733) |
25.How confident are you that Joe Biden has the mental and physical stamina necessary to carry out the job of president – very confident, somewhat confident, not too confident, or not at all confident?
| Trend: Registered voters | Feb. 2024 | June 2020 |
|---|---|---|
| Very confident | 12% | 23% |
| Somewhat confident | 20% | 29% |
| Not too confident | 15% | 11% |
| Not at all confident | 52% | 34% |
| (VOL) Don’t know | 1% | 3% |
| (n) | (822) | (733) |
[QUESTIONS 26 & 27 WERE ROTATED]
26.Thinking about Joe Biden’s actions as president so far, do you think Biden… should be impeached, may have violated his oath of office but should not be impeached, or (has not violated his oath of office? [CHOICES WERE READ IN REVERSE ORDER FOR A RANDOM HALF SAMPLE]
| Trend: Registered voters | Feb. 2024 | Sept. 2023 |
|---|---|---|
| Should be impeached | 32% | 34% |
| May have violated oath, but not impeached | 18% | 16% |
| Has not violated his oath | 46% | 43% |
| (VOL) Don’t know | 3% | 7% |
| (n) | (822) | (737) |
27.Thinking back to the way Donald Trump responded to the 2020 presidential election outcome, do you think Trump… committed a crime, did something wrong but not criminal, or did nothing wrong? [CHOICES WERE READ IN REVERSE ORDER FOR A RANDOM HALF SAMPLE]
| Trend: Registered voters | Feb. 2024 | Sept. 2023 |
|---|---|---|
| Committed a crime | 45% | 46% |
| Did something wrong but not criminal | 25% | 22% |
| Did nothing wrong | 29% | 29% |
| (VOL) Don’t know | 2% | 3% |
| (n) | (822) | (737) |
28A.If Donald Trump wins the Republican nomination, but is convicted of a crime before the party convention this summer, do you think the Republican Party should keep Trump or replace Trump as their presidential candidate? [CHOICES WERE ROTATED]
| Registered voters | Feb. 2024 |
|---|---|
| Keep Trump | 38% |
| Replace Trump | 58% |
| (VOL) Don’t know | 4% |
| (n) | (822) |
28B.Should individual states be able to remove Donald Trump’s name from the presidential ballot for engaging in insurrection, or should states not be able to do this?
| Registered voters | Feb. 2024 |
|---|---|
| Should be able to remove | 41% |
| Should not be able to remove | 56% |
| (VOL) Don’t know | 3% |
| (n) | (822) |
[Note: Questions 28C-F were added on 2/9 thru 2/12; n=483, m.o.e. = +/-5.6%]
Reports have come out about classified documents that were found at the homes of President Biden and former President Trump.
[QUESTIONS 28C & 28D WERE ROTATED]
28C.Do you think Joe Biden did or did not know there were classified documents in his home?
| Trend: Registered voters | Feb. 2024 | Jan. 2023 |
|---|---|---|
| Did know | 63% | 58% |
| Did not know | 27% | 33% |
| (VOL) Don’t know | 10% | 10% |
| (n) | (483) | (757) |
28D.Do you think Donald Trump did or did not know there were classified documents in his home?
| Trend: Registered voters | Feb. 2024 | Jan. 2023 |
|---|---|---|
| Did know | 83% | 80% |
| Did not know | 8% | 12% |
| (VOL) Don’t know | 10% | 8% |
| (n) | (483) | (757) |
[QUESTIONS 28E & 28F WERE ROTATED]
28E.Are you very concerned, somewhat concerned, or not too concerned that the classified documents found in Joe Biden’s home would pose a threat to national security if they fell into the wrong hands?
| Trend: Registered voters | Feb. 2024 | Jan. 2023 |
|---|---|---|
| Very concerned | 36% | 39% |
| Somewhat concerned | 27% | 29% |
| Not too concerned | 29% | 29% |
| (VOL) Don’t know | 8% | 4% |
| (n) | (483) | (757) |
28F.Are you very concerned, somewhat concerned, or not too concerned that the classified documents found in Donald Trump’s home would pose a threat to national security if they fell into the wrong hands?
| Trend: Registered voters | Feb. 2024 | Jan. 2023 |
|---|---|---|
| Very concerned | 43% | 41% |
| Somewhat concerned | 24% | 27% |
| Not too concerned | 26% | 30% |
| (VOL) Don’t know | 8% | 3% |
| (n) | (483) | (757) |
29.Did you vote in the 2020 presidential election, or did you not vote for whatever reason? [If YES:] Who did you vote for – Donald Trump, Joe Biden, or another candidate? [NAMES WERE ROTATED]
| Trend: Registered voters | Feb. 2024 | Dec. 2023 |
|---|---|---|
| Donald Trump | 41% | 40% |
| Joe Biden | 46% | 45% |
| Another candidate | 4% | 4% |
| Voted, refused to name candidate | 2% | 2% |
| Did not vote | 7% | 9% |
| (n) | (822) | (743) |
30.Do you believe Joe Biden won the 2020 election fair and square or do you believe that he only won it due to voter fraud?
| Trend: Registered voters | Feb. 2024 | May 2023 | Sept. 2022 | Aug. 2022 | June 2022 | Jan. 2022 | Nov. 2021 | June 2021 | March 2021 | Jan. 2021 | Nov. 2020 |
|---|---|---|---|---|---|---|---|---|---|---|---|
| Fair and square | 60% | 60% | 62% | 62% | 62% | 60% | 63% | 60% | 62% | 64% | 59% |
| Due to voter fraud | 35% | 31% | 30% | 31% | 30% | 32% | 33% | 33% | 33% | 33% | 33% |
| (VOL) Don’t know | 5% | 9% | 8% | 7% | 9% | 7% | 5% | 7% | 6% | 3% | 8%* |
| (n) | (822) | (907) | (750) | (751) | (910) | (735) | (726) | (758) | (731) | (736) | (749) |
[Q31-34 previously released.]
[Q35-37 held for future release.]
METHODOLOGY
The Monmouth University Poll was sponsored and conducted by the Monmouth University Polling Institute from February 8 to 12, 2024 with a probability-based national random sample of 902 adults age 18 and older. Interviews were conducted in English, and included 183 live landline telephone interviews, 362 live cell phone interviews, and 357 online surveys via a cell phone text invitation. Telephone numbers were selected through a mix of random digit dialing and list-based sampling. Landline respondents were selected with a modified Troldahl-Carter youngest adult household screen. Interviewing services were provided by Braun Research, with sample obtained from Dynata (RDD, n= 557), Aristotle (list, n= 152) and a panel of prior Monmouth poll participants (n= 193). Monmouth is responsible for all aspects of the survey design, data weighting and analysis. The full sample is weighted for region, age, education, gender and race based on US Census information (ACS 2021 one-year survey). The results in this poll release are based on a subsample of 822 registered voters. For results based on the sample of registered voters, one can say with 95% confidence that the error attributable to sampling has a maximum margin of plus or minus 4.3 percentage points adjusted for sample design effects (1.55). Sampling error can be larger for sub-groups (see table below). In addition to sampling error, one should bear in mind that question wording and practical difficulties in conducting surveys can introduce error or bias into the findings of opinion polls.
Demographics (weighted)
Party (self-reported): 30% Republican, 36% Independent, 34% Democrat
Sex: 48% male, 51% female, 1% other
Age: 24% 18-34, 35% 35-54, 41% 55+
Race: 63% White, 13% Black, 15% Hispanic, 9% Asian/other
Education: 33% high school or less, 29% some college, 21% 4 year degree, 16% graduate degree
Click on pdf file link below for full methodology and crosstabs by key demographic groups.


