West Long Branch, NJ – Would the country be better or worse off if Donald Trump beat Joe Biden in 2020? The nation is evenly divided on this hypothetical question, according to the Monmouth (“Mon-muth”) University Poll. Moreover, about 1 in 8 Americans believe both that Biden’s victory was only due to fraud and that there is still a path to overturn those results and reinstate Trump in the Oval Office. The poll finds broad support, at least in the abstract, for measures that would standardize processes around both election integrity and voting access. However, support for those actions run up against mixed opinion of processes like the filibuster, producing some inconsistencies in overall public attitudes.
The American public is evenly divided on whether the current state of the country would be better off (42%) or worse off (40%) if Trump won the presidency in 2020 rather than Biden. Few (16%) say things would be about the same if the result had been different. Most demographic groups (e.g. age, gender) are divided on this question; and even though people of color (36% better and 42% worse) break in a different direction than white Americans (47% better and 39% worse), there are significant proportions in each group who land on either side of this “what if” question. The only demographic characteristic that shows a more decisive split is educational attainment. Those without a four-year college degree are more likely to feel the country would be better off (48%) than worse off (32%) under Trump. College graduates feel the opposite (56% worse off and 31% better off).
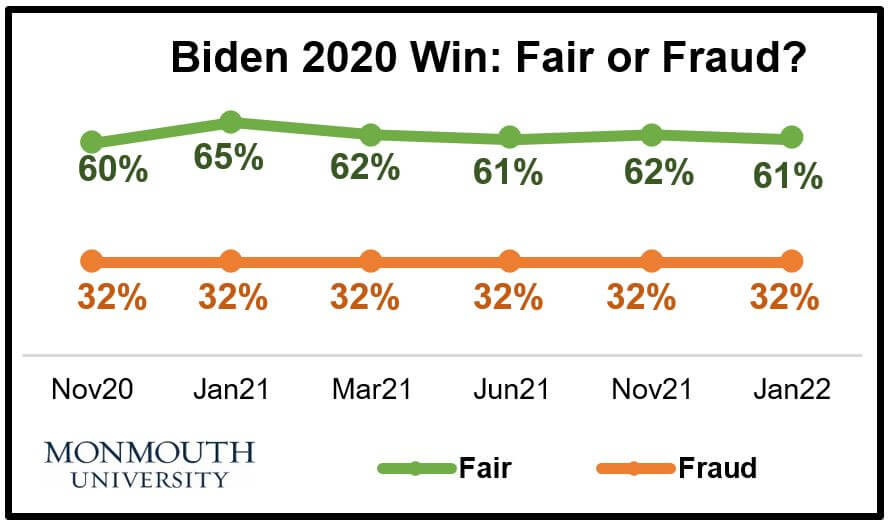
One-third of Americans continue to believe that Biden’s 2020 victory was the result of voter fraud. In a trend that tests the definition of statistical coincidence, this result has been 32% every time Monmouth has asked this question since November 2020. The current poll also finds that 17% of the public thinks there is still a path to reverse the electoral vote count and replace Biden with Trump before the next presidential election (6% definitely and 11% probably). This belief is held by 30% of Republicans, 15% of independents, and 5% of Democrats. Taken together, about 1 in 8 Americans (12%) believe that Biden stole the election and that there is still a chance to overturn the 2020 result.
“The persistence of the ‘big lie’ continues to be a warning sign. It is being fed and nurtured by messages that tout the possibility of overturning the 2020 result even though no such legal mechanism exists. While the number who hold this view might not sound like a lot right now, it’s important to remember that it doesn’t take an outright majority to destabilize institutions,” said Patrick Murray, director of the independent Monmouth University Polling Institute.
There has been a slight uptick in the number of people who believe that voter fraud is a major problem in the United States (41%, up from 37% in June 2021). A somewhat larger number, though, believe that voter disenfranchisement is a major problem (49%, similar to 50% in June). Majorities of Democrats say disenfranchisement is a major problem (59%) and that fraud is not a problem (54%). By comparison, most Republicans believe voter fraud is a major problem (62%) but a plurality also feel disenfranchisement is a major problem (42%).
Overall, 80% of the public supports requiring voters to show a photo ID in order to vote (identical to 80% in June) and 63% support establishing national guidelines to allow vote by mail and in-person early voting in federal elections in each state (down slightly from 69% in June). In a new question, 73% support establishing national guidelines for each state to follow when counting votes in federal elections. Voter ID requirements are supported by nearly all Republicans and 6 in 10 Democrats. Standardizing vote by mail and early voting access is supported by 9 in 10 Democrats and 4 in 10 Republicans. National vote-counting guidelines are supported by 8 in 10 Democrats and 2 in 3 Republicans. Of note, though, Republicans who thought the 2020 election was decided by fraud are much less supportive of regularizing vote by mail and early voting (37%) than Republicans who feel Biden won fairly (56%). Interestingly, opinion about the 2020 result’s validity has little impact on Republican opinion of standardizing vote counting procedures.
“Voting access and election integrity are two sides of the same coin. Most Americans would like to see both issues addressed,” said Murray, adding, “It’s interesting that, in a vacuum, many Republicans support the idea of creating national election guidelines. The question is whether their concept of what those national guidelines should be are inherently different from other Americans or simply that partisan tribalism alters your position once the issue hits the public sphere.”
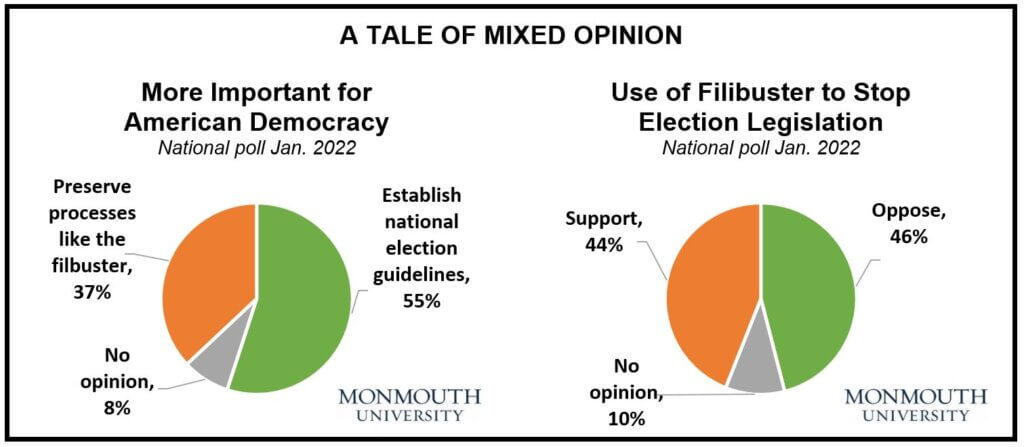
Overall, 26% of the public reports supporting the failed voting rights bill, 24% opposed it, 19% had no opinion of it, and the remaining 31% were not aware of it. The bill was stopped by a filibuster in the Senate. A majority of the public (55%) feels it is more important for American democracy to establish national guidelines for election rules and voting rights than it is to preserve traditional legislative processes like the filibuster (37% think the latter is more important). At the same time, 44% of Americans support allowing the filibuster to be used to stop bills on election rules and voting rights, while 46% oppose this – a result that is practically identical to a Monmouth poll taken last April (46% support and 46% oppose).
In general, 41% of Americans approve of the Senate filibuster process while 31% disapprove and 28% have no opinion. Public opinion was more evenly divided last year at 34% approve, 34% disapprove and 33% no opinion. When asked about potential changes to the process, 43% want to keep the filibuster as it is with no changes (up from 38% in April 2021) and just 17% want to get rid of it entirely. Another 35% would keep the filibuster but reform how it can be used.
“Public opinion lacks clarity on this issue. A majority say that election rules and voting legislation are more important than the filibuster, but nearly half are okay with using the filibuster to stop such a bill. There is not a public consensus that voting rights, or at least what the Senate bill was trying to accomplish, is a fundamental priority for the country as a whole,” said Murray.
The poll also asked about the impact of changes to voting laws that some states are making, such as limiting early voting access. Four in ten Americans (41%) think these changes will make the voting process harder for racial and ethnic groups such as Black and Latino voters. Nearly half (48%) say these changes will have no impact and 8% say they will actually make voting easier for these groups. Among people of color, 46% say these election changes will make it harder for certain racial and ethnic groups to vote, but 39% feel these changes will have no impact and 12% say it will make voting even easier.
“The questions we asked in this poll are about democratic processes where we have the sense they are seen as representing a ‘public good’ but the impacts are not obvious or salient for many people. These results only scratch the surface of where public opinion stands and how it could move. One thing we can probably take away from the voting rights bill’s failure is that proponents did not put this issue into terms that were relevant to a broad segment of the public nor did they reinforce that message consistently throughout the past year, while opponents were successful in framing the bill as driven by partisan motives,” said Murray.
The Monmouth University Poll was conducted by telephone from January 20 to 24, 2022 with 794 adults in the United States. The question results in this release have a margin of error of +/- 3.5 percentage points. The poll was conducted by the Monmouth University Polling Institute in West Long Branch, NJ.
QUESTIONS AND RESULTS
(* Some columns may not add to 100% due to rounding.)
[Q1-11 previously released.]
12.Do you believe Joe Biden won the 2020 election fair and square, or do you believe that he only won it due to voter fraud?
| TREND: | Jan. 2022 | Nov. 2021 | June 2021 | March 2021 | Jan. 2021 | Nov. 2020 |
| Fair and square | 61% | 62% | 61% | 62% | 65% | 60% |
| Due to voter fraud | 32% | 32% | 32% | 32% | 32% | 32% |
| (VOL) Don’t know | 7% | 5% | 7% | 6% | 3% | 8%* |
| (n) | (794) | (811) | (810) | (802) | (809) | (810) |
* Includes 2% who said Biden would not be declared the winner.
13.Do you think the current state of the country would be better off, worse off, or about the same if Donald Trump had been declared the winner instead of Biden?
| Jan. 2022 | |
| Better off | 42% |
| Worse off | 40% |
| About the same | 16% |
| (VOL) Don’t know | 2% |
| (n) | (794) |
14.Some people say there is still a path to reverse the electoral vote count from 2020 and replace Biden with Trump before the next presidential election. Do you feel that there is definitely a path to do this, probably a path, probably not a path, or definitely not a path?
| Jan. 2022 | |
| Definitely | 6% |
| Probably | 11% |
| Probably not | 21% |
| Definitely not | 56% |
| (VOL) Don’t know | 6% |
| (n) | (794) |
[QUESTIONS 15 & 16 WERE ROTATED]
15.How much of a problem is voter fraud in the United States – that is, votes being cast in the name of people who are not eligible to vote? Is it a major problem, minor problem, or not a problem?
| TREND: | Jan. 2022 | June 2021 | Oct. 2012* |
| Major problem | 41% | 37% | 36% |
| Minor problem | 28% | 32% | 33% |
| Not a problem | 29% | 29% | 20% |
| (VOL) Don’t know | 2% | 2% | 12% |
| (n) | (794) | (810) | (1,592) |
* Registered voters
16.How much of a problem is voter disenfranchisement in the United States – that is, eligible voters being prevented from casting their ballots or not having their ballots counted? Is it a major problem, minor problem, or not a problem?
| TREND: | Jan. 2022 | June 2021 |
| Major problem | 49% | 50% |
| Minor problem | 24% | 26% |
| Not a problem | 23% | 20% |
| (VOL) Don’t know | 4% | 4% |
| (n) | (794) | (810) |
[QUESTIONS 17-19 WERE ROTATED]
17.In general, do you support or oppose establishing national guidelines to allow vote by mail and in-person early voting in federal elections in every state?
| TREND: | Jan. 2022 | June 2021 |
| Support | 63% | 69% |
| Oppose | 33% | 25% |
| (VOL) Depends | 2% | 2% |
| (VOL) Don’t know | 2% | 3% |
| (n) | (794) | (810) |
18.In general, do you support or oppose requiring voters to show a photo I.D. in order to vote?
| TREND: | Jan. 2022 | June 2021 |
| Support | 80% | 80% |
| Oppose | 18% | 18% |
| (VOL) Depends | 1% | 2% |
| (VOL) Don’t know | 1% | 1% |
| (n) | (794) | (810) |
19.In general, do you support or oppose establishing national guidelines for each state to follow when counting votes in federal elections?
| Jan. 2022 | |
| Support | 73% |
| Oppose | 22% |
| (VOL) Depends | 1% |
| (VOL) Don’t know | 4% |
| (n) | (794) |
20.How much did you hear about the voting rights bill that was voted on in the U.S. Senate this week but did not pass – a lot, a little, or nothing at all?
| Jan. 2022 | |
| A lot | 35% |
| A little | 34% |
| Nothing at all | 31% |
| (n) | (794) |
20A.Did you support or oppose this voting rights bill, or did you have no opinion on it?
| Jan. 2022 | |
| Support | 26% |
| Oppose | 24% |
| No opinion | 19% |
| Not aware (from Q20) | 31% |
| (n) | (794) |
21.A filibuster is a procedure used in the Senate to block a bill from being put to a vote until a supermajority of 60 senators agree to end debate on it. In general, do you approve or disapprove of the filibuster, or do you have no opinion?
| TREND: | Jan. 2022 | April 2021 |
| Approve | 41% | 34% |
| Disapprove | 31% | 34% |
| No opinion | 28% | 33% |
| (n) | (794) | (800) |
22.Do you think the Senate should get rid of the filibuster entirely, keep it but reform how it can be used, or keep it as is with no changes?
| TREND: | Jan. 2022 | April 2021 |
| Get rid of entirely | 17% | 19% |
| Keep but with reforms | 35% | 38% |
| Keep with no changes | 43% | 38% |
| (VOL) Don’t know | 5% | 6% |
| (n) | (794) | (800) |
23.Do you support or oppose allowing the filibuster to be used to stop a bill on election rules and voting rights?
| TREND: | Jan. 2022 | April 2021 |
| Support | 44% | 46% |
| Oppose | 46% | 46% |
| (VOL) Depends | 2% | 3% |
| (VOL) Don’t know | 8% | 4% |
| (n) | (794) | (800) |
24.If you had to choose, do you think it is more important for American democracy to preserve traditional legislative processes like the filibuster or to establish national guidelines for election rules and voting rights? [CHOICES WERE ROTATED]
| Jan. 2022 | |
| Preserve traditional processes | 37% |
| Establish election guidelines | 55% |
| (VOL) Depends | 1% |
| (VOL) Don’t know | 7% |
| (n) | (794) |
25.A number of states have been making changes to their voting laws, such as limiting early voting and vote by mail. Do you think these changes will make the voting process harder for racial and ethnic groups, such as Black and Latino voters, make the process easier, or will it have no impact on these groups’ ability to vote?
| Jan. 2022 | |
| Harder | 41% |
| Easier | 8% |
| No impact | 48% |
| (VOL) Don’t know | 3% |
| (n) | (794) |
[Q26-42 held for future release.]
METHODOLOGY
The Monmouth University Poll was sponsored and conducted by the Monmouth University Polling Institute from January 20 to 24, 2022 with a probability-based national random sample of 794 adults age 18 and older. This includes 267 contacted by a live interviewer on a landline telephone and 527 contacted by a live interviewer on a cell phone, in English. Telephone numbers were selected through a mix of random digit dialing and list-based sampling. Landline respondents were selected with a modified Troldahl-Carter youngest adult household screen. Interviewing services were provided by Braun Research, with sample obtained from Dynata (RDD, n=476), Aristotle (list, n=119) and a panel of prior Monmouth poll participants (n=199). Monmouth is responsible for all aspects of the survey design, data weighting and analysis. The full sample is weighted for region, age, education, gender and race based on US Census information (ACS 2018 one-year survey). For results based on this sample, one can say with 95% confidence that the error attributable to sampling has a maximum margin of plus or minus 3.5 percentage points (unadjusted for sample design). Sampling error can be larger for sub-groups (see table below). In addition to sampling error, one should bear in mind that question wording and practical difficulties in conducting surveys can introduce error or bias into the findings of opinion polls.
| DEMOGRAPHICS (weighted) |
| Self-Reported |
| 31% Republican |
| 43% Independent |
| 26% Democrat |
| 49% Male |
| 51% Female |
| 30% 18-34 |
| 33% 35-54 |
| 38% 55+ |
| 63% White |
| 12% Black |
| 16% Hispanic |
| 9% Asian/Other |
| 68% No degree |
| 32% 4 year degree |
Click on pdf file link below for full methodology and crosstabs by key demographic groups.


