West Long Branch, NJ – President Joe Biden begins his term with the backing of a majority of Americans. The Monmouth (“Mon-muth”) University Poll finds, though, that ratings for Congress and the direction of the country remain negative, although they are relatively higher than they have been in at least eight years. The public hopes there will be more cooperation with the new administration, but their confidence is muted. The pandemic tops a list of issues Americans want the federal government to tackle. Other top concerns are bread and butter issues like jobs, health care, and education, but also include the rising threat of domestic terrorism.
Biden begins his term with a positive job rating of 54% approve and 30% disapprove. Another 16% have no opinion. The current presidential rating is already higher than it was at any point during Donald Trump’s term in office. Still, opinion of the incumbent is sharply divided along partisan lines – 90% of Democrats, 47% of independents, and just 15% of Republicans approve of Biden.
Six in ten (61%) Americans feel optimistic about the policies Biden will pursue as president, while 35% feel pessimistic. The public is somewhat more positive than it was four years ago as Donald Trump was about to take office, when 50% were optimistic and 43% were pessimistic. Political optimism, however, is a partisan creature. While 95% of Democrats are optimistic about Biden’s policies, just 18% of Republicans feel the same. In the days before Trump was sworn in, 90% of Republicans were optimistic, compared with 18% of Democrats.
“Overall, there seems to be more goodwill for Biden than there was for Trump, but it really breaks down along partisan lines. Right now, more people identify as Democrats than Republicans,” said Patrick Murray, director of the independent Monmouth University Polling Institute.
The poll also finds the job rating for Congress at 35% approve and 51% disapprove and opinion of the nation’s trajectory at 42% the right direction and 51% the wrong track. While the net scores on these questions are negative, they actually represent the most positive marks for both since Monmouth began tracking them nationally in 2013. The prior high Congressional rating was 32% approve and 55% disapprove – in April and May last year during the early days of the coronavirus pandemic. The prior high point for the path the country is on was 40% right direction and 53% wrong track in June 2018.
There have been some shifts on a partisan basis. Currently, 54% of Democrats and 14% of Republicans approve of Congress. Back in April, the approval was more bipartisan at 32% of Democrats and 35% of Republicans. Opinion that the country is currently headed in the right direction is held by 73% of Democrats but only 12% of Republicans. The last time this number reached the 40% mark (June 2018), this view was held by just 10% of Democrats compared to fully 80% of Republicans.
Most Americans (71%) would rather see Republicans in Congress find ways to work together with Biden than to focus on keeping Biden in check (25%). The desire for bipartisan cooperation is higher than it was just after the November election (62%), and includes 41% of Republicans (up from 28% in November) as well as 70% of independents (68%) and 94% of Democrats (92%). The poll finds that 6 in 10 Americans have at least some confidence that Biden will be able to get Washington to be more cooperative, although just 21% are very confident while 39% are somewhat confident. Still, this is slightly better than in November (13% very and 38% somewhat confident).
“Bipartisanship is certainly an aspiration for the Biden era, but public optimism about achieving it is a bit muted,” said Murray.
In terms of expectations for how Biden’s policies will impact the middle class, 30% believe middle class families will benefit a lot, 39% say a little, and 27% say not at all. This is slightly better than expectations for Trump at the outset of his administration (26% a lot, 40% a little, 29% not at all in January 2017). For comparison, the public is now evenly divided on whether Trump’s policies benefited the middle class a lot (32%), a little (33%), or not at all (32%). These numbers for Trump are better than they were just over a year into his term (14% a lot, 45% a little, 36% not at all in April 2018). They are also better than the marks received by former President Barack Obama at the end of his term (24% a lot, 41% a little, 33% not at all in January 2017). As may be expected, there are sharp partisan group divisions in all these results.
Two-thirds (68%) of the public believe it is at least somewhat likely that Biden will actually propose policies to help the middle class. This view is more widely held than it was for Trump as he was about to take office (61%) and Obama a few months into his second term (55%). It is worth noting that a larger number of Democrats feel it is very likely Biden will propose policies to help the middle class (69%) than said the same about Obama eight years ago (47%). Similarly, 58% say it is at least somewhat likely that Congress will enact policies to help the middle class, which is slightly higher than it was in January 2017 (54%) and much higher than in July 2013 (30%).
“Bolstering the middle class is usually considered the backbone of a successful presidency. But Biden probably faces more countervailing pressures on which issues to address than any other president in our lifetimes,” said Murray.
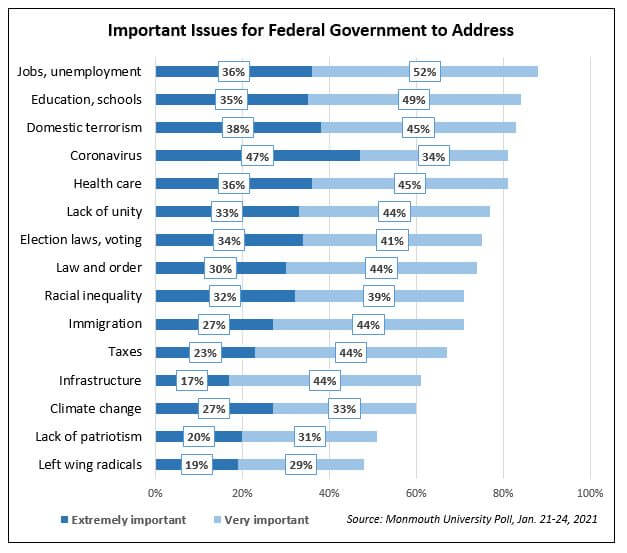
The poll also asked participants to rate the importance of 15 different issue areas in terms of what they want the federal government to address. The top tier of issues – with at least 8 in 10 rating them as important – includes the coronavirus pandemic, with nearly half (47%) of the public saying it is extremely important to address and another 34% saying it is very important. Other top priorities are domestic terrorism and hate groups (38% extremely / 45% very), jobs and unemployment (36% / 52%), health care (36% / 45%), and education and schools (35% / 49%).
The next tier of issues – which at least 7 in 10 Americans see as important – are election laws and voting access (34% extremely / 41% very), a lack of unity in the country (33% / 44%), racial inequality (32% / 39%), law and order (30% / 44%), and immigration (27% / 44%). Six in ten or more Americans rate climate change (27% extremely / 33% very), taxes (23% / 44%), and transportation and energy infrastructure (17% / 44%) as important issues. About half rate a lack of patriotism in the country (20% extremely / 31% very) and left wing radicals and socialists (19% / 29%) as important issues for the federal government to address.
“The top priorities tend to focus on bread and butter issues, with one exception: the growing threat of domestic terrorism posed by hate groups. At the other end of the spectrum, the anarchy of left wing radicals, while important, does not seem to pose quite the same existential threat,” said Murray.
Many of these issue areas are given a high priority by similar numbers of Democrats, Republicans, and independents – although this does not mean they agree on the specific policies to be pursued in those areas. Some issues, though, show stark partisan differences in their perceived importance. Specifically, Democrats are much more likely than Republicans to see the following as extremely important issues for the federal government to address: the coronavirus pandemic (63% Democrat to 27% Republican), racial inequality (46% to 13%), and climate change (44% to 8%).
“One thing that jumps out is the greatest disparity in partisan opinion happens to be on three issues that Biden specifically prioritized in his inaugural address. He’s unlikely to win over Republicans with his approach in these areas, so the question becomes to what extent he can convince independents of their importance,” said Murray.
Overall, the highest priority areas for Democrats – based on the number who say it is extremely important – are the pandemic (63%), domestic terrorism and hate groups (49%), health care (46%), racial inequality (46%), and climate change (44%). For Republicans, the top issues are domestic terrorism (37%), election laws and voting access (37%), and law and order (36%). For independents, the top issues include the pandemic (45%), education (35%), and jobs (34%).
“It’s interesting that domestic terrorism makes it to the top of the list for both Democrats and Republicans and that it is an even bigger concern for the latter group than left wing radicalism. One possible reason is a dawning realization that these hate groups not only threaten American society but could also have a detrimental effect on the GOP brand,” said Murray.
The Monmouth University Poll was conducted by telephone from January 21 to 24, 2021 with 809 adults in the United States. The question results in this release have a margin of error of +/- 3.5 percentage points. The poll was conducted by the Monmouth University Polling Institute in West Long Branch, NJ.
QUESTIONS AND RESULTS
(* Some columns may not add to 100% due to rounding.)
1.Do you approve or disapprove of the job Joe Biden is doing as president?
| Jan. 2021 | |
| Approve | 54% |
| Disapprove | 30% |
| (VOL) No opinion | 16% |
| (n) | (809) |
2.Do you approve or disapprove of the job the U.S. Congress is doing?
| TREND: | Jan. 2021 | Nov. 2020 | Early June 2020 | May 2020 | April 2020 | Feb. 2020 | Jan. 2020 | Dec. 2019 | Nov. 2019 | Sept. 2019 | Aug. 2019 | June 2019 | May 2019 | April 2019 | March 2019 | Jan. 2019 |
| Approve | 35% | 23% | 22% | 32% | 32% | 20% | 24% | 22% | 23% | 21% | 17% | 19% | 20% | 24% | 23% | 18% |
| Disapprove | 51% | 64% | 69% | 55% | 55% | 69% | 62% | 65% | 64% | 68% | 71% | 69% | 71% | 62% | 68% | 72% |
| (VOL) No opinion | 14% | 13% | 9% | 13% | 13% | 11% | 14% | 13% | 13% | 11% | 13% | 12% | 9% | 14% | 9% | 10% |
| (n) | (809) | (810) | (807) | (808) | (857) | (902) | (903) | (903) | (908) | (1,161) | (800) | (751) | (802) | (801) | (802) | (805) |
| TREND: Continued | Nov. 2018 | Aug. 2018 | June 2018 | April 2018 | March 2018 | Jan. 2018 | Dec. 2017 | Sept. 2017 | Aug. 2017 | July 2017 | May 2017 | March 2017 | Jan. 2017 |
| Approve | 23% | 17% | 19% | 17% | 18% | 21% | 16% | 17% | 18% | 19% | 19% | 25% | 23% |
| Disapprove | 63% | 69% | 67% | 71% | 72% | 68% | 65% | 69% | 69% | 70% | 68% | 59% | 66% |
| (VOL) No opinion | 14% | 14% | 14% | 12% | 11% | 11% | 19% | 15% | 13% | 11% | 13% | 16% | 11% |
| (n) | (802) | (805) | (806) | (803) | (803) | (806) | (806) | (1,009) | (805) | (800) | (1,002) | (801) | (801) |
| TREND: Continued | Sept. 2016* | Aug. 2016* | June 2016* | March 2016 | Jan. 2016 | Dec. 2015 | Oct. 2015 | Sept. 2015 | Aug. 2015 | July 2015 | June 2015 | April 2015 | Jan. 2015 | Dec. 2014 | July 2013 |
| Approve | 15% | 14% | 17% | 22% | 17% | 16% | 17% | 19% | 18% | 18% | 19% | 21% | 18% | 17% | 14% |
| Disapprove | 77% | 78% | 76% | 68% | 73% | 73% | 71% | 71% | 72% | 69% | 71% | 67% | 70% | 73% | 76% |
| (VOL) No opinion | 8% | 9% | 7% | 10% | 10% | 10% | 12% | 11% | 11% | 12% | 10% | 12% | 11% | 11% | 10% |
| (n) | (802) | (803) | (803) | (1,008) | (1,003) | (1,006) | (1,012) | (1,009) | (1,203) | (1,001) | (1,002) | (1,005) | (1,003) | (1,008) | (1,012) |
* Registered voters
3.Would you say things in the country are going in the right direction, or have they gotten off on the wrong track?
| TREND: | Jan. 2021 | Nov. 2020 | Early Sept. 2020 | Aug. 2020 | Late June 2020 | Early June 2020 | May 2020 | April 2020 | March 2020 | Feb. 2020 | Jan. 2020 |
| Right direction | 42% | 26% | 27% | 22% | 18% | 21% | 33% | 30% | 39% | 37% | 37% |
| Wrong track | 51% | 68% | 66% | 72% | 74% | 74% | 60% | 61% | 54% | 57% | 56% |
| (VOL) Depends | 3% | 4% | 4% | 4% | 5% | 4% | 4% | 5% | 4% | 6% | 6% |
| (VOL) Don’t know | 4% | 2% | 3% | 2% | 3% | 1% | 3% | 5% | 3% | 1% | 1% |
| (n) | (809) | (810) | (867) | (868) | (867) | (807) | (808) | (857) | (851) | (902) | (903) |
| TREND: Continued | Dec. 2019 | Nov. 2019 | Sept. 2019 | Aug. 2019 | June 2019 | May 2019 | April 2019 | March 2019 | Nov. 2018 | Aug. 2018 | June 2018 | April 2018 | March 2018 | Jan. 2018 |
| Right direction | 32% | 30% | 30% | 28% | 31% | 29% | 28% | 29% | 35% | 35% | 40% | 33% | 31% | 37% |
| Wrong track | 56% | 61% | 61% | 62% | 62% | 63% | 62% | 63% | 55% | 57% | 53% | 58% | 61% | 57% |
| (VOL) Depends | 8% | 7% | 6% | 8% | 6% | 4% | 7% | 6% | 7% | 6% | 3% | 5% | 6% | 3% |
| (VOL) Don’t know | 4% | 2% | 2% | 2% | 2% | 3% | 3% | 2% | 3% | 3% | 3% | 4% | 1% | 3% |
| (n) | (903) | (908) | (1,161) | (800) | (751) | (802) | (801) | (802) | (802) | (805) | (806) | (803) | (803) | (806) |
| TREND: Continued | Dec. 2017 | Aug. 2017 | May 2017 | March 2017 | Jan. 2017 | Aug. 2016* | Oct. 2015 | July 2015 | June 2015 | April 2015 | Dec. 2014 | July 2013 |
| Right direction | 24% | 32% | 31% | 35% | 29% | 30% | 24% | 28% | 23% | 27% | 23% | 28% |
| Wrong track | 66% | 58% | 61% | 56% | 65% | 65% | 66% | 63% | 68% | 66% | 69% | 63% |
| (VOL) Depends | 7% | 4% | 5% | 4% | 4% | 2% | 6% | 5% | 5% | 5% | 5% | 5% |
| (VOL) Don’t know | 3% | 5% | 3% | 5% | 2% | 3% | 4% | 3% | 3% | 2% | 3% | 4% |
| (n) | (806) | (805) | (1,002) | (801) | (801) | (803) | (1,012) | (1,001) | (1,002) | (1,005) | (1,008) | (1,012) |
* Registered voters
4.Thinking about the next few years, do you feel optimistic or pessimistic about the policies President Biden will pursue? [Is that very or somewhat optimistic/pessimistic?]
| COMPARISON: | Expectations for Trump | |
| Jan. 2021 | Jan. 2017 | |
| Very optimistic | 33% | 24% |
| Somewhat optimistic | 28% | 26% |
| Somewhat pessimistic | 9% | 13% |
| Very pessimistic | 26% | 30% |
| (VOL) Don’t know | 5% | 6% |
| (n) | (809) | (801) |
5.Putting aside any policy differences you may have, how confident are you that Joe Biden will be able to get Washington to be more cooperative – very confident, somewhat confident, not too confident, or not at all confident?
| TREND: | Jan. 2021 | Nov. 2020 |
| Very confident | 21% | 13% |
| Somewhat confident | 39% | 38% |
| Not too confident | 14% | 19% |
| Not at all confident | 25% | 27% |
| (VOL) Don’t know | 1% | 2% |
| (n) | (809) | (810) |
6.Do you think it is more important for Republicans in Congress to find ways to work together with Biden or more important for them to keep Biden in check?
| TREND: | Jan. 2021 | Nov. 2020 |
| Find ways to work together with Biden | 71% | 62% |
| Keep Biden in check | 25% | 34% |
| (VOL) Don’t know | 4% | 4% |
| (n) | (809) | (810) |
[Q7 previously released.]
8.How much did middle class families benefit from former President Trump’s policies – a lot, a little, or not at all?
| COMPARISON: | Benefited under Obama | |||||||
| Jan. 2021 | April 2019 | April 2018 | Dec. 2017 | Jan. 2017 | July 2013 | |||
| A lot | 32% | 18% | 14% | 11% | 24% | 12% | ||
| A little | 33% | 37% | 45% | 25% | 41% | 39% | ||
| Not at all | 32% | 36% | 36% | 53% | 33% | 46% | ||
| (VOL) Don’t know | 3% | 9% | 5% | 11% | 2% | 2% | ||
| (n) | (809) | (801) | (803) | (806) | (801) | (1,012) | ||
9.And how much do you think middle class families will benefit from President Biden’s policies – a lot, a little, or not at all?
| COMPARISON: | Expectations for Trump | |||
| Jan. 2021 | Jan. 2017 | |||
| A lot | 30% | 26% | ||
| A little | 39% | 40% | ||
| Not at all | 27% | 29% | ||
| (VOL) Don’t know | 4% | 5% | ||
| (n) | (809) | (801) |
10.How likely is it that President Biden will propose policies to help the middle class – very, somewhat, not too, or not at all likely?
| COMPARISON: | Trump | Obama | |||
| Jan. 2021 | Jan. 2017 | July 2013 | |||
| Very likely | 38% | 28% | 25% | ||
| Somewhat likely | 30% | 33% | 30% | ||
| Not too likely | 11% | 16% | 15% | ||
| Not at all likely | 21% | 21% | 29% | ||
| (VOL) Don’t Know | 1% | 2% | 1% | ||
| (n) | (809) | (801) | (1,012) |
11.How likely is it that Congress will enact policies to help the middle class – very, somewhat, not too, or not at all likely?
| TREND: | Jan. 2021 | Jan. 2017 | July 2013 |
| Very likely | 14% | 18% | 4% |
| Somewhat likely | 44% | 36% | 26% |
| Not too likely | 18% | 20% | 30% |
| Not at all likely | 21% | 24% | 38% |
| (VOL) Don’t Know | 2% | 2% | 2% |
| (n) | (809) | (801) | (1,012) |
12.I am going to read you a number of different issues and want you to tell me how important it is for the federal government to address these issues. For each one, please tell me if you feel it is extremely important, very important, just somewhat important, or not important? [ITEMS WERE ROTATED]
Extremely important | Very important | Just somewhat important | Not important | (VOL) Don’t know | (n) | |
| The coronavirus pandemic | 47% | 34% | 13% | 6% | 1% | (809) |
| Climate change | 27% | 33% | 23% | 16% | 1% | (809) |
| Racial inequality | 32% | 39% | 19% | 8% | 2% | (809) |
| Health care | 36% | 45% | 14% | 4% | 1% | (809) |
| Law and order | 30% | 44% | 20% | 4% | 1% | (809) |
| Taxes | 23% | 44% | 27% | 4% | 1% | (809) |
| Jobs and unemployment | 36% | 52% | 10% | 2% | 1% | (809) |
| Immigration | 27% | 44% | 23% | 5% | 1% | (809) |
| Education and schools | 35% | 49% | 11% | 3% | 1% | (809) |
| Lack of unity in the country | 33% | 44% | 17% | 5% | 1% | (809) |
| Lack of patriotism in the country | 20% | 31% | 30% | 18% | 1% | (809) |
| Domestic terrorism and hate groups | 38% | 45% | 12% | 5% | 0% | (809) |
| Left wing radicals and socialists | 19% | 29% | 27% | 21% | 4% | (809) |
| Election laws and voting access | 34% | 41% | 19% | 5% | 1% | (809) |
| Transportation and energy infrastructure | 17% | 44% | 33% | 5% | 1% | (809) |
[Q13-19 & 26-40 held for future release.]
[Q20-25 previously released.]
METHODOLOGY
The Monmouth University Poll was sponsored and conducted by the Monmouth University Polling Institute from January 21 to 24, 2021 with a national random sample of 809 adults age 18 and older. This includes 298 contacted by a live interviewer on a landline telephone and 511 contacted by a live interviewer on a cell phone, in English. Telephone numbers were selected through random digit dialing and landline respondents were selected with a modified Troldahl-Carter youngest adult household screen. Monmouth is responsible for all aspects of the survey design, data weighting and analysis. The full sample is weighted for region, age, education, gender and race based on US Census information (ACS 2018 one-year survey). Data collection support provided by Braun Research (field) and Dynata (RDD sample). For results based on this sample, one can say with 95% confidence that the error attributable to sampling has a maximum margin of plus or minus 3.5 percentage points (unadjusted for sample design). Sampling error can be larger for sub-groups (see table below). In addition to sampling error, one should bear in mind that question wording and practical difficulties in conducting surveys can introduce error or bias into the findings of opinion polls.
| DEMOGRAPHICS (weighted) |
| Self-Reported |
| 25% Republican |
| 41% Independent |
| 34% Democrat |
| 49% Male |
| 51% Female |
| 30% 18-34 |
| 33% 35-54 |
| 37% 55+ |
| 64% White |
| 12% Black |
| 16% Hispanic |
| 8% Asian/Other |
| 70% No degree |
| 30% 4 year degree |
Click on pdf file link below for full methodology and crosstabs by key demographic groups.


