
West Long Branch, NJ – Pennsylvania voters generally see Josh Shapiro, the Democratic candidate for governor, as being in line with their political views, while Republican Doug Mastriano is seen as out of step. The Monmouth (“Mon-muth”) University Poll finds that support in their respective partisan bases is stronger for Shapiro than it is for Mastriano. Personality seems to matter more than issues in the race for governor, although Shapiro has the advantage on most areas of voter concern.
More than half of potential voters say they will either definitely (40%) or probably (14%) vote for Shapiro in November, while just under 4 in 10 will definitely (24%) or probably (14%) vote for Mastriano. The Republican’s combined 38% support level is about the same as it was three weeks ago (36%), while the Democrat’s support is identical to Monmouth’s last poll (54%). However, Shapiro’s support has become more solid as the number of his “definite” voters has risen from 33% to 40%. “Definite” support for Shapiro comes from 80% of Democrats (a jump from 66% last month), while only 54% of Republicans definitely back Mastriano (up slightly from 47%). Significantly more Pennsylvania voters say they definitely will not vote for Mastriano (45%) than those who completely rule out Shapiro (28%). These numbers have not moved since last month.
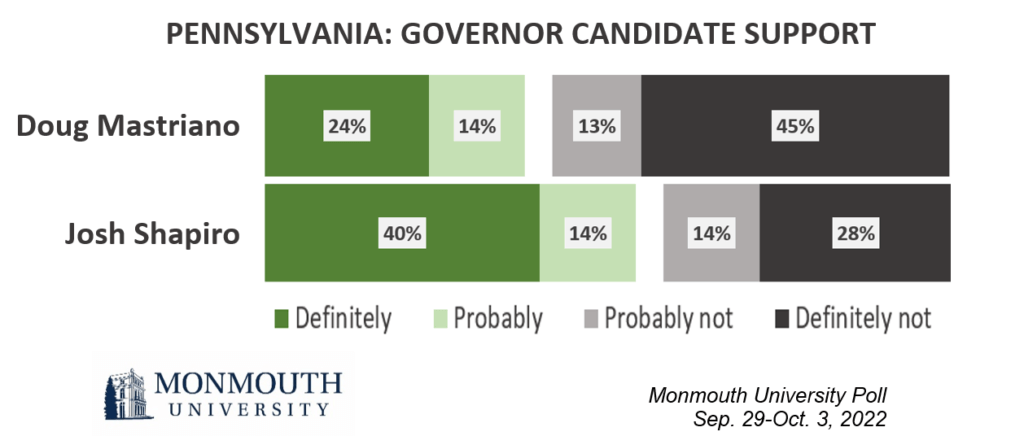
“Shapiro’s support has solidified with Democrats over the past few weeks, but it’s unlikely that Republicans who are unsure about Mastriano will actually switch sides. The bigger question may be whether they will vote at all,” said Patrick Murray, director of the independent Monmouth University Polling Institute. Just 2% of Pennsylvania voters say they will definitely back a third-party candidate in the race for governor.
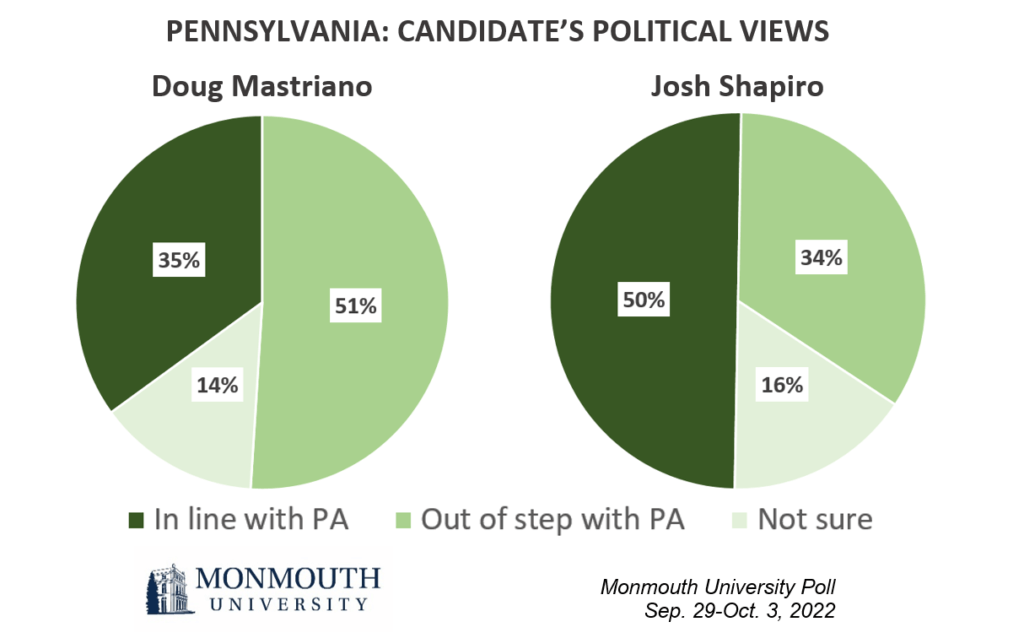
One-third of the electorate (35%) feels Mastriano’s political views are in line with most residents of Pennsylvania while half (51%) say he is out of step with the state. The results for his opponent are a mirror image of these results – 50% say Shapiro’s views are in line with most Pennsylvanians and just 34% say he is out of step.
“The Shapiro campaign appears to be successful in painting Mastriano as outside the Pennsylvania mainstream,” said Murray.
Shapiro has a decidedly positive personal rating of 54% favorable to 35% unfavorable, while Mastriano holds a net negative rating of 37% favorable to 49% unfavorable. These results are nearly identical to Monmouth’s poll three weeks ago. Shapiro continues to enjoy significant backing among people of color (72% will definitely or probably support him compared with 22% support for Mastriano) as well as white college graduates (61% support compared with 32% for Mastriano). The Democrat also holds his own among a key component of the Republican bloc in recent election cycles – white voters who do not hold a four-year college degree (48% support compared with 46% for Mastriano).
The poll asked voters about the importance of seven different issues in deciding who to support for governor. Jobs, the economy and cost of living are nominally the top concern – 40% say this is extremely important to their vote – while immigration is the least crucial (26%). There isn’t a lot of variation among the other five issues polled, with about one-third of voters saying these are extremely important to their vote. More than 4 in 10 Republicans rate economic concerns (50%), crime (48%), defending their values (44%), gun control (42%), and elections and voting (41%) as extremely important, whereas Democrats give similar emphasis to abortion (44%) and gun control (43%). Each of these issues are less important for independents in the governor’s race, with jobs, the economy and cost of living (33%) being only slightly more important than the other concerns. Regardless, Shapiro is seen as more trusted than Mastriano to handle each of these issues, such as the economy (47% to 34%), abortion (50% to 27%), crime (47% to 34%), and gun control (45% to 36%).
“The issue picture for this race is different than it is for the Senate election. The economy is nominally the top issue in both contests, but the governor’s race seems to be more about the candidates’ characteristics than about any particular issue,” said Murray.
Overall, 41% of Pennsylvania voters are very confident that the commonwealth’s election will be conducted fairly and accurately, while another 32% are somewhat confident in this. Democrats (64%) are much more likely than Republicans (13%) to be very confident in how Pennsylvania will run the upcoming election.
The Monmouth University Poll was conducted by telephone from September 29 to October 3, 2022 with 610 Pennsylvania registered voters. The question results in this release have a margin of error of +/- 4.8 percentage points for the full sample. The poll was conducted by the Monmouth University Polling Institute in West Long Branch, NJ.
QUESTIONS AND RESULTS
(* Some columns may not add to 100% due to rounding.)
[Q1-12 previously released.]
13/14.I am going to read you a list of candidates running for Governor in Pennsylvania this year. For each one, please tell me if you have definitely heard of them, not sure if you’ve heard of them, or if you’ve definitely not heard of them?
[If DEFINITELY HEARD OF:] Do you have a very favorable, somewhat favorable, somewhat unfavorable, or very unfavorable opinion of them? [NAMES WERE ROTATED]
| TREND: | Very favorable | Somewhat favorable | Somewhat unfavorable | Very unfavorable | Heard of, no opinion (VOL) | Not sure if heard of | Definitely not heard of | (n) |
| Doug Mastriano, the Republican | 19% | 18% | 8% | 41% | 5% | 2% | 6% | (610) |
| — Sept. 2022 | 18% | 18% | 9% | 39% | 5% | 3% | 9% | (605) |
| Josh Shapiro, the Democrat | 34% | 20% | 15% | 20% | 6% | 3% | 3% | (610) |
| — Sept. 2022 | 30% | 25% | 13% | 20% | 5% | 2% | 6% | (605) |
[QUESTIONS 15 & 16 WERE ROTATED]
15.How likely are you to vote for Doug Mastriano in the election for governor – will you definitely vote for him, probably vote for him, probably not vote for him, or definitely not vote for him?
| TREND: | Oct. 2022 | Sept. 2022 |
| Definitely | 24% | 21% |
| Probably | 14% | 15% |
| Probably not | 13% | 14% |
| Definitely not | 45% | 45% |
| (VOL) Don’t know | 4% | 5% |
| (n) | (610) | (605) |
16.How likely are you to vote for Josh Shapiro in the election for governor – will you definitely vote for him, probably vote for him, probably not vote for him, or definitely not vote for him?
| TREND: | Oct. 2022 | Sept. 2022 |
| Definitely | 40% | 33% |
| Probably | 14% | 21% |
| Probably not | 14% | 14% |
| Definitely not | 28% | 28% |
| (VOL) Don’t know | 4% | 5% |
| (n) | (610) | (605) |
17.How likely are you to vote for one of the third party candidates running for governor this year – will you definitely vote for one of them, probably vote for them, probably not vote for them, or definitely not vote for them?
| Oct. 2022 | |
| Definitely | 2% |
| Probably | 9% |
| Probably not | 30% |
| Definitely not | 55% |
| (VOL) Don’t know | 4% |
| (n) | (610) |
[QUESTIONS 18 & 19 WERE ROTATED]
18.Are Doug Mastriano’s political views in line or out of step with most residents of Pennsylvania?
| Oct. 2022 | |
| In line | 35% |
| Out of step | 51% |
| (VOL) Don’t know | 14% |
| (n) | (610) |
19.Are Josh Shapiro’s political views in line or out of step with most residents of Pennsylvania?
| Oct. 2022 | |
| In line | 50% |
| Out of step | 34% |
| (VOL) Don’t know | 16% |
| (n) | (610) |
20.Please tell me if each of the following issues is extremely important, very important, somewhat important, or not important to you in deciding who to support for governor?[ITEMS WERE ROTATED]
| Extremely important | Very important | Somewhat important | Not important | (VOL) Don’t know | (n) | |
| Immigration | 26% | 38% | 27% | 10% | 0% | (610) |
| Gun control | 36% | 41% | 16% | 6% | 1% | (610) |
| Abortion | 36% | 37% | 18% | 8% | 1% | (610) |
| Jobs, the economy and cost of living | 40% | 47% | 12% | 1% | 0% | (610) |
| Defending your values | 36% | 45% | 15% | 3% | 1% | (610) |
| Crime | 34% | 44% | 20% | 2% | 0% | (610) |
| Elections and voting processes | 36% | 41% | 17% | 5% | 0% | (610) |
21.Who do you trust more on [READ ITEM] – Doug Mastriano, Josh Shapiro, both equally, or neither one? [ITEMS WERE ROTATED] [NAMES WERE ROTATED]
| Doug Mastriano | Josh Shapiro | Both equally | Neither one | (VOL) Don’t know | (n) | |
| Immigration | 34% | 44% | 7% | 12% | 4% | (610) |
| Gun control | 36% | 45% | 6% | 9% | 5% | (610) |
| Abortion | 27% | 50% | 5% | 11% | 6% | (610) |
| Jobs, the economy and cost of living | 34% | 47% | 7% | 8% | 3% | (610) |
| Defending your values | 33% | 47% | 8% | 9% | 3% | (610) |
| Crime | 34% | 47% | 8% | 7% | 3% | (610) |
| Elections and voting processes | 32% | 47% | 8% | 10% | 3% | (610) |
[Q22-26 previously released.]
27.Overall, how confident are you that the election in Pennsylvania will be conducted fairly and accurately – very confident, somewhat confident, not too confident, or not at all confident?
| Oct. 2022 | |
| Very confident | 41% |
| Somewhat confident | 32% |
| Not too confident | 17% |
| Not at all confident | 10% |
| (VOL) Don’t know | 1% |
| (n) | (610) |
28.How will you vote this year – in person on Election Day, in person at an early voting location, by mail ballot, or won’t you vote at all?
| Oct. 2022 | |
| In person on Election Day | 75% |
| In person early | 2% |
| By mail ballot | 21% |
| Won’t vote at all | 1% |
| (VOL) Don’t know | 1% |
| (n) | (610) |
METHODOLOGY
The Monmouth University Poll was sponsored and conducted by the Monmouth University Polling Institute from September 29 to October 3, 2022 with a probability-based random sample of 610 Pennsylvania voters drawn from a list of active registered voters who participated in at least one general election since 2016 or have newly registered since the 2020 election. This includes 184 contacted by a live interviewer on a landline telephone and 426 contacted by a live interviewer on a cell phone, in English. Monmouth is responsible for all aspects of the survey design, data weighting and analysis. The full sample is weighted for party registration, age, gender, race, education, and region based on state voter registration list information and U.S. Census information (CPS 2018 supplement). Data collection support provided by Braun Research (field) and Aristotle (voter sample). For results based on this sample, one can say with 95% confidence that the error attributable to sampling has a maximum margin of plus or minus 4.8 percentage points (adjusted for sample design effects). Sampling error can be larger for sub-groups (see table below). In addition to sampling error, one should bear in mind that question wording and practical difficulties in conducting surveys can introduce error or bias into the findings of opinion polls.
| DEMOGRAPHICS (weighted) |
| REGISTERED VOTERS |
| Party Registration |
| 42% Republican |
| 14% Other/none |
| 44% Democrat |
| Self-Reported Party |
| 35% Republican |
| 27% Independent |
| 38% Democrat |
| 48% Male |
| 52% Female |
| 22% 18-34 |
| 22% 35-49 |
| 29% 50-64 |
| 27% 65+ |
| 84% White, non-Hispanic |
| 10% Black |
| 3% Hispanic |
| 3% Asian/other |
| 63% No degree |
| 37% 4 year degree |
Click on pdf file link below for full methodology and crosstabs by key demographic groups.