West Long Branch, NJ – Democrat John Fetterman is seen as understanding the concerns of ordinary Pennsylvanians more than Republican Mehmet Oz, according to the latest Monmouth (“Mon-muth”) University Poll of the U.S. Senate race. Fetterman maintains an overall advantage on being trusted more to handle key issues, including those prioritized by independents and Republicans.
Fetterman has a personal rating of 48% favorable to 44% unfavorable, which is similar to his 47%–42% rating three weeks ago. Nearly half (48%) of the electorate will either definitely or probably vote for him in November, which is similar to his 49% support level in Monmouth’s prior poll, except that his “definite” support has increased from 32% to 37%. Oz continues to hold a net negative personal rating of 36% favorable to 53% unfavorable, which is similar to three weeks ago (36%–52%). He has seen a slight increase in his support for U.S. Senate from 39% three weeks ago to 43% in the current poll, although only 25% are definitely backing the Republican at this stage. Also, slightly more Pennsylvania voters continue to say they definitely will not vote for Oz (46%) than completely rule out Fetterman (40%).

“Fetterman maintains an edge as his support is starting to solidify. Oz’s higher negatives are driven in large part by the sense that he is out of touch with most Pennsylvanians,” said Patrick Murray, director of the independent Monmouth University Polling Institute.
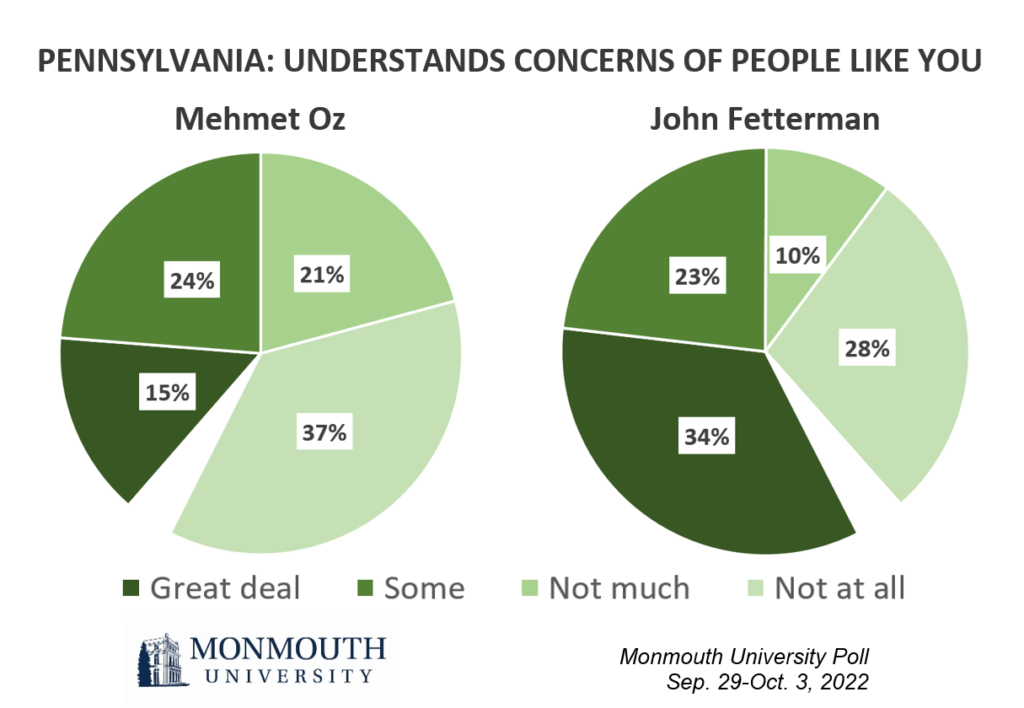
A majority of Pennsylvania voters say Fetterman understands the day-to-day concerns of people like them either a great deal (34%) or some (23%). Only 4 in 10 say the same about Oz (15% great deal and 24% some).
“We asked probable supporters of both candidates why they are not certain about their choice. In most cases, these voters say they simply don’t know enough about general issue stances to fully commit to that candidate yet. However, a number of probable Oz voters in the poll did mention concerns about both his residency status and his conservative bona fides. Few specific reasons emerge in describing reluctance to support the Democrat, but it is worth noting that only one probable Fetterman voter in the poll mentioned health concerns as a reason they might not support him,” said Murray.
Nearly 9 in 10 Pennsylvania voters say jobs, the economy and cost of living concerns are either extremely (39%) or very (48%) important in deciding who to support for U.S. Senate. This ranks as the most important concern among seven issue areas asked about in the poll. About 4 in 10 independents (38%) rate the economy as extremely important to their vote, whereas only about 2 in 10 place similar emphasis on any of the other issues. Republicans also prioritize the economy (45%), along with crime (41%) and defending their values (40%). Democrats, on the other hand, are more likely to focus on abortion as their key issue (44% extremely important).
The poll finds Fetterman holds the advantage on key issues. Currently, 45% of voters say they trust the Democrat more on jobs, the economy, and cost of living while 36% trust Oz. Last month, Fetterman had a 41% to 36% advantage over his opponent on this issue. Fetterman also has an advantage when it comes to handling crime – 45% trust him more on this issue to 38% for Oz. The widest gap is on the issue of abortion, where 48% trust Fetterman and just 29% trust Oz.
“The economy is an issue that has generally helped Republicans in national polling, but Oz has not been able to capitalize on it,” said Murray.
Although Oz has less solid support than Fetterman, he does maintain a small edge in voter motivation. Among “definite” supporters of the two candidates, high motivation stands at 86% for those in the Oz camp and at 82% among those definite for Fetterman. Among those “probably” voting for Oz, 58% say they are extremely motivated to vote this year, which is higher than among Fetterman’s probable supporters (44%). However, because the Democrat starts with more backing overall, Fetterman still retains about 51% support among extremely motivated voters, while Oz has 45% support in this group.
The poll also finds that 4% of registered voters say they definitely will vote for one of the third party candidates running for U.S. Senate this year, and 13% say they will probably support one of these candidates. Given past elections, that level of support is unlikely to happen and most of these voters will either vote for one of the two major party nominees or stay home. Among this group of potential third party supporters, similar numbers say they could vote for Oz (37%) or Fetterman (34%).
Pennsylvania voters are split on their preference for which party controls Congress – 48% choose the Democrats and 47% choose the Republicans. President Joe Biden has a negative rating of 44% favorable and 55% unfavorable, while former President Donald Trump has a slightly worse rating of 40% favorable and 59% unfavorable.
The Monmouth University Poll was conducted by telephone from September 29 to October 3, 2022 with 610 Pennsylvania registered voters. The question results in this release have a margin of error of +/- 4.8 percentage points for the full sample. The poll was conducted by the Monmouth University Polling Institute in West Long Branch, NJ.
QUESTIONS AND RESULTS
(* Some columns may not add to 100% due to rounding.)
1.Would you say things in the country are going in the right direction, or have they gotten off on the wrong track?
| TREND: | Oct. 2022 | Sept. 2022 |
| Right direction | 25% | 24% |
| Wrong track | 67% | 70% |
| (VOL) Depends | 3% | 3% |
| (VOL) Don’t know | 5% | 3% |
| (n) | (610) | (605) |
2.Would you rather see the Republicans or the Democrats in control of Congress, or doesn’t this matter to you? [CHOICES WERE ROTATED] [If DOES NOT MATTER: If you had to lean one way or the other would you pick the Republicans or the Democrats?]
| TREND: | Oct. 2022 | Sept. 2022 |
| Republicans | 41% | 40% |
| Not matter, but lean Rep | 6% | 7% |
| Democrats | 42% | 38% |
| Not matter, but lean Dem | 6% | 8% |
| Does not matter, no lean | 3% | 5% |
| (VOL) Don’t know | 1% | 1% |
| (n) | (610) | (605) |
3.Is it very important, somewhat important, or only a little important to have [Republicans/Democrats] in control of Congress? [CHOICE READ FROM Q2]
| TREND: | Oct. 2022 | Sept. 2022 |
| Very important | 69% | 65% |
| Somewhat important | 18% | 18% |
| Only a little important | 6% | 8% |
| (VOL) Don’t know / Does not matter who controls Congress (from Q2) | 6% | 8% |
| (n) | (610) | (605) |
4/5.I am going to read you a list of candidates running for U.S. Senate in Pennsylvania this year. For each one, please tell me if you have definitely heard of them, not sure if you’ve heard of them, or if you’ve definitely not heard of them?
[If DEFINITELY HEARD OF:] Do you have a very favorable, somewhat favorable, somewhat unfavorable, or very unfavorable opinion of them? [NAMES WERE ROTATED]
| TREND: | Very favorable | Somewhat favorable | Somewhat unfavorable | Very unfavorable | Heard of, no opinion (VOL) | Not sure if heard of | Definitely not heard of | (n) |
| Mehmet Oz, the Republican | 16% | 20% | 13% | 40% | 3% | 0% | 8% | (610) |
| — Sept. 2022 | 16% | 20% | 12% | 40% | 2% | 1% | 9% | (605) |
| John Fetterman, the Democrat | 30% | 18% | 8% | 36% | 3% | 2% | 2% | (610) |
| — Sept. 2022 | 29% | 18% | 11% | 31% | 3% | 1% | 7% | (605) |
[QUESTIONS 6 & 7 WERE ROTATED]
6.How likely are you to vote for Mehmet Oz in the election for U.S. Senate – will you definitely vote for him, probably vote for him, probably not vote for him, or definitely not vote for him?
| TREND: | Oct. 2022 | Sept. 2022 |
| Definitely | 25% | 23% |
| Probably | 18% | 16% |
| Probably not | 8% | 11% |
| Definitely not | 46% | 45% |
| (VOL) Don’t know | 3% | 5% |
| (n) | (610) | (605) |
7.How likely are you to vote for John Fetterman in the election for U.S. Senate – will you definitely vote for him, probably vote for him, probably not vote for him, or definitely not vote for him?
| TREND: | Oct. 2022 | Sept. 2022 |
| Definitely | 37% | 32% |
| Probably | 11% | 17% |
| Probably not | 7% | 9% |
| Definitely not | 40% | 38% |
| (VOL) Don’t know | 4% | 4% |
| (n) | (610) | (605) |
8.How likely are you to vote for one of the third party candidates running for U.S. Senate this year – will you definitely vote for one of them, probably vote for them, probably not vote for them, or definitely not vote for them?
| Oct. 2022 | |
| Definitely | 4% |
| Probably | 13% |
| Probably not | 31% |
| Definitely not | 47% |
| (VOL) Don’t know | 6% |
| (n) | (610) |
[QUESTIONS 9 & 10 WERE ROTATED]
9.How much does Mehmet Oz understand the day to day concerns of people like you – a great deal, some, not much, or not at all?
| Oct. 2022 | |
| Great deal | 15% |
| Some | 24% |
| Not much | 21% |
| Not at all | 37% |
| (VOL) Don’t know | 4% |
| (n) | (610) |
10.How much does John Fetterman understand the day to day concerns of people like you – a great deal, some, not much, or not at all?
| Oct. 2022 | |
| Great deal | 34% |
| Some | 23% |
| Not much | 10% |
| Not at all | 28% |
| (VOL) Don’t know | 4% |
| (n) | (610) |
11.Please tell me if each of the following issues is extremely important, very important, somewhat important, or not important to you in deciding who to support for U.S. Senate? [ITEMS WERE ROTATED]
| Extremely important | Very important | Somewhat important | Not important | (VOL) Don’t know | (n) | |
| Immigration | 25% | 38% | 28% | 9% | 0% | (610) |
| Gun control | 28% | 41% | 21% | 9% | 1% | (610) |
| Abortion | 31% | 39% | 17% | 11% | 2% | (610) |
| Jobs, the economy and cost of living | 39% | 48% | 12% | 1% | 0% | (610) |
| Defending your values | 30% | 45% | 20% | 3% | 1% | (610) |
| Crime | 30% | 45% | 20% | 5% | 0% | (610) |
| Elections and voting processes | 31% | 43% | 19% | 7% | 1% | (610) |
12.Who do you trust more on [READ ITEM] – Mehmet Oz, John Fetterman, both equally, or neither one? [ITEMS WERE ROTATED] [NAMES WERE ROTATED]
| TREND: | Mehmet Oz | John Fetterman | Both equally | Neither one | (VOL) Don’t know | (n) |
| Immigration | 37% | 41% | 5% | 14% | 3% | (610) |
| — Sept. 2022 | 34% | 34% | 4% | 21% | 7% | (605) |
| Gun control | 33% | 43% | 4% | 16% | 4% | (610) |
| — Sept. 2022 | 30% | 40% | 4% | 19% | 7% | (605) |
| Abortion | 29% | 48% | 3% | 16% | 5% | (610) |
| — Sept. 2022 | 26% | 44% | 2% | 21% | 7% | (605) |
| Jobs, the economy and cost of living | 36% | 45% | 5% | 12% | 2% | (610) |
| — Sept. 2022 | 36% | 41% | 4% | 16% | 4% | (605) |
| Defending your values | 34% | 44% | 4% | 16% | 2% | (610) |
| — Sept. 2022 | 34% | 43% | 2% | 17% | 3% | (605) |
| Crime | 38% | 45% | 3% | 11% | 3% | (610) |
| Elections and voting processes | 34% | 44% | 7% | 13% | 2% | (610) |
[Q13-21 held for future release.]
[QUESTIONS 22 & 23 WERE ROTATED]
22.Is your general impression of Donald Trump very favorable, somewhat favorable, somewhat unfavorable, or very unfavorable?
| TREND: | Oct. 2022 | Sept. 2022 |
| Very favorable | 20% | 20% |
| Somewhat favorable | 20% | 23% |
| Somewhat unfavorable | 11% | 7% |
| Very unfavorable | 48% | 49% |
| (VOL) Don’t know | 0% | 1% |
| (n) | (610) | (605) |
23.Is your general impression of Joe Biden very favorable, somewhat favorable, somewhat unfavorable, or very unfavorable?
| TREND: | Oct. 2022 | Sept. 2022 |
| Very favorable | 18% | 16% |
| Somewhat favorable | 26% | 27% |
| Somewhat unfavorable | 13% | 12% |
| Very unfavorable | 42% | 44% |
| (VOL) Don’t know | 0% | 1% |
| (n) | (610) | (605) |
24.How motivated are you to vote in this year’s election – extremely motivated, very motivated, somewhat motivated, or not motivated?
| TREND: | Oct. 2022 | Sept. 2022 |
| Extremely motivated | 70% | 64% |
| Very motivated | 17% | 21% |
| Somewhat motivated | 11% | 10% |
| Not motivated | 2% | 4% |
| (VOL) Don’t know | 0% | 1% |
| (n) | (610) | (605) |
25.Compared to past elections for U.S. Senate and Congress, are you more enthusiastic than usual, less enthusiastic, or about the same as past elections?
| TREND: | Oct. 2022 | Sept. 2022 |
| More enthusiastic | 44% | 42% |
| Less enthusiastic | 10% | 10% |
| About the same | 46% | 48% |
| (VOL) Don’t know | 0% | 1% |
| (n) | (610) | (605) |
26.Do you feel optimistic or pessimistic about the outcome of the upcoming midterm elections? [Is that very or somewhat optimistic/pessimistic?]
| TREND: | Oct. 2022 | Sept. 2022 |
| Very optimistic | 25% | 20% |
| Somewhat optimistic | 45% | 48% |
| Somewhat pessimistic | 21% | 20% |
| Very pessimistic | 6% | 7% |
| (VOL) Don’t know | 3% | 5% |
| (n) | (610) | (605) |
[Q27-28 held for future release.]
METHODOLOGY
The Monmouth University Poll was sponsored and conducted by the Monmouth University Polling Institute from September 29 to October 3, 2022 with a probability-based random sample of 610 Pennsylvania voters drawn from a list of active registered voters who participated in at least one general election since 2016 or have newly registered since the 2020 election. This includes 184 contacted by a live interviewer on a landline telephone and 426 contacted by a live interviewer on a cell phone, in English. Monmouth is responsible for all aspects of the survey design, data weighting and analysis. The full sample is weighted for party registration, age, gender, race, education, and region based on state voter registration list information and U.S. Census information (CPS 2018 supplement). Data collection support provided by Braun Research (field) and Aristotle (voter sample). For results based on this sample, one can say with 95% confidence that the error attributable to sampling has a maximum margin of plus or minus 4.8 percentage points (adjusted for sample design effects). Sampling error can be larger for sub-groups (see table below). In addition to sampling error, one should bear in mind that question wording and practical difficulties in conducting surveys can introduce error or bias into the findings of opinion polls.
| DEMOGRAPHICS (weighted) |
| REGISTERED VOTERS |
| Party Registration |
| 42% Republican |
| 14% Other/none |
| 44% Democrat |
| Self-Reported Party |
| 35% Republican |
| 27% Independent |
| 38% Democrat |
| 48% Male |
| 52% Female |
| 22% 18-34 |
| 22% 35-49 |
| 29% 50-64 |
| 27% 65+ |
| 84% White, non-Hispanic |
| 10% Black |
| 3% Hispanic |
| 3% Asian/other |
| 63% No degree |
| 37% 4 year degree |
Click on pdf file link below for full methodology and crosstabs by key demographic groups.