
Note: With this poll, Monmouth is moving away from asking the traditional “horse race” question in covering elections because of the reductive tendency to focus on margins. Instead, the poll questions address the underlying dynamics of the race and the relative strengths and weaknesses of the field of candidates which give a fuller picture of the state of the race.
West Long Branch, NJ – There are very different dynamics at play among the Democratic and Republican bases in Pennsylvania, as voters there prepare to nominate their respective party’s candidates for U.S. Senate. The Monmouth (“Mon-muth”) University Poll finds the Republican electorate is heavily ideological and focused on two key issues right now, but there is no consensus on which candidate should be their standard-bearer. Democrats, on the other hand, appear to be converging on a Senate choice even though they are divided on their party’s ideological future and have a long laundry list of issues that are important to smaller groups of voters within the party. Interestingly, more Democrats say it is very important for their nominee to be a strong supporter of Joe Biden than Republicans say the same about their nominee’s support of Donald Trump. And Trump’s endorsement has not helped his chosen candidate break away from the pack.
“In the Democrats, you have an ideologically divided party that is leaning toward a progressive candidate. While in the Republicans, you have a strong ideological bent but no agreement on which candidate best fits that bill. Even Trump’s endorsement has not brought clarity to the field,” said Patrick Murray, director of the independent Monmouth University Polling Institute.
Democratic primary voters
The Democratic electorate in Pennsylvania is divided about which ideological direction their party should take. While 46% would like to see the moderate wing have more influence in Washington, 42% prefer to have the progressive wing with more influence. There is a wide age gap in this opinion, with 63% of those aged 65 and older wanting the moderates to hold sway compared with 62% of those under the age of 50 wanting the progressives to have more influence. Just 23% of Pennsylvania Democratic primary voters say they are very liberal, while 44% describe themselves as moderates.
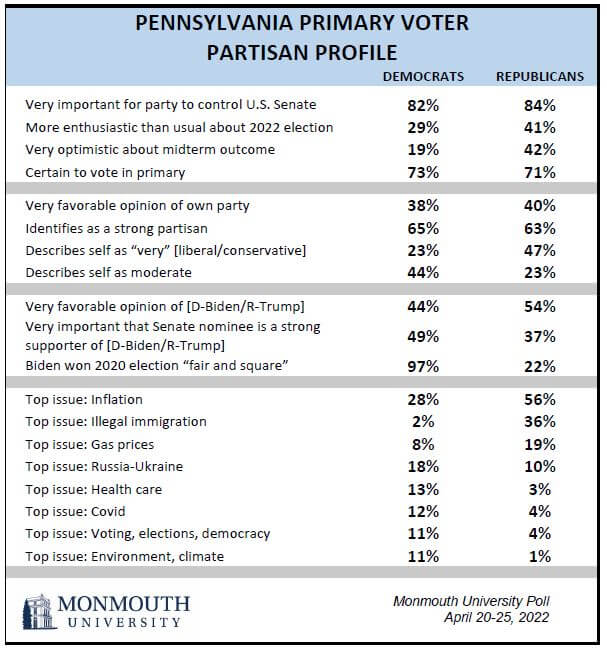
No single issue currently dominates Democratic voters’ concerns. A plurality of 28% mention inflation as one of the most important issues facing the country, but other responses tend to be widely dispersed. These include the Russia-Ukraine war (18%), health care (13%), the Covid pandemic (12%), voting and democracy (11%), and environmental issues (11%).
Four in ten Democratic voters (40%) say President Biden is doing better than they had hoped as president, but 29% say he is doing worse. Voters under 50 years old, however, are actually more likely to say Biden is doing worse (42%) rather than better than they hoped (22%). More voters of color (53%) than white voters (35%) say Biden is beating their expectations. About half of all Democratic primary voters (49%) say it is very important for their party’s U.S. Senate nominee to strongly support the president.
“Democrats are all over the map when it comes to issues and ideology. In this Senate contest, though, the relatively progressive candidate seems to be attracting the most support,” said Murray.
In the race for the Democratic nomination, Lt. Gov. John Fetterman appears to have an edge over the rest of the field. He holds a 68% favorable rating and has the highest name recognition (81%) of the four Democratic candidates on the ballot. Just under half (44%) of Democratic primary voters say they are very likely to support Fetterman in the upcoming Senate primary. He garners stronger support from voters who describe themselves as liberal (54% very likely) than those who are moderate to conservative (37%).
Western Pennsylvania congressman Conor Lamb also has a relatively high favorability rating (51%) as well as name recognition (65%). However, only 23% say they are very likely to vote for him in the primary. This support is similar among liberals (22%) and non-liberals (24%). Philadelphia-based legislator Malcolm Kenyatta has a 32% favorable rating and 43% name recognition, with 14% who are very likely to support him. Fetterman has a distinct issue edge as well. Three in ten Democrats (31%) name him as the candidate who is strongest on what they see as the nation’s most important issues, compared with 13% who pick Lamb and 6% who choose Kenyatta.
Voters were asked to assess their likelihood of supporting each of the candidates on the ballot. While nearly 9 in 10 Democrats identify a candidate they are at least somewhat likely to support, just under half (46%) can hone in on a single candidate they are “very likely” to support. Another 16% have multiple candidates they are very likely to back right now, while 38% pick no candidate as someone they are very likely to back at this time. Overall, Fetterman (34%) has a clear edge over Lamb (12%) and Kenyatta (4%) among voters who indicate a higher likelihood for backing one candidate over the others. [Note: this estimation includes voters who name only one candidate in the field as being very likely to get their vote, or if no candidates are chosen as “very likely” at this stage, it includes voters who name only one candidate they are “somewhat likely” to support.]
Republican primary voters
In contrast to Pennsylvania Democrats, the Republican primary electorate tends toward being highly ideological. Nearly half (47%) call themselves very conservative and just 23% say they are moderate. In terms of national concerns that dominate their thinking today, two issues clearly stand out as being the most urgent for these voters: inflation (56%) and illegal immigration (36%). There are few demographic differences of note among Republicans who name these as top concerns.
The GOP U.S. Senate primary presents a reverse image of the Democratic contest. The Republican electorate may have more clarity about which policy areas are most important, but there is no consensus on who is the best choice to handle these issues. Media figure Dr. Mehmet Oz (20%), investment consultant David McCormick (16%), and political commentator Kathy Barnette (12%) are the only candidates in the 7-person primary field to register in double-digits – albeit barely – on the question of who is the strongest candidate to handle voters’ top concerns.
Both Oz (92%) and McCormick (80%) have widespread name recognition among Pennsylvania Republicans, but McCormick has a better net rating – 51% favorable and 15% unfavorable compared with 48% favorable and 37% unfavorable for Oz. About half the potential primary electorate has heard of Barnette (37% favorable and 5% unfavorable) and businessman Jeff Bartos (28% favorable and 6% unfavorable). Fewer than 4 in 10 know former ambassador Carla Sands (25% favorable and 4% unfavorable).
None of the GOP contenders garners a significant number of party voters who are “very likely” to back them at this stage. McCormick has the greatest level of potential support, with 61% who say they are at least somewhat likely to vote for him. About half of the Republican electorate is either very or somewhat likely to vote for Oz (51%) or Barnette (51%). Bartos (45%) and Sands (42%) are slightly behind in potential support. At the other end of the spectrum, about 4 in 10 Republican primary voters (42%) say they are unlikely to vote for Oz, with 42% saying the same about Sands and 39% about Bartos. Fewer voters rule out Barnette (33%) or McCormick (29%). There are few differences in these levels of support based on whether voters describe themselves as being very conservative or they put themselves elsewhere on the ideological scale.
About half of Republican primary voters (49%) say there is no candidate in the field they are “very likely” to support at this stage. Fewer than 4 in 10 (37%) have settled on a single candidate as being very likely to get their backing, while 14% name multiple candidates who are very likely to get their support. Nearly 9 in 10, though, can point to at least one candidate they are somewhat likely to back. Among voters who register a higher likelihood of voting for one specific candidate over the other six, support is divided among Oz (15%), McCormick (11%), and Barnette (8%).
“This is the kind of environment where a number of candidates could emerge as the nominee. Oz has the highest name recognition but also the highest negatives. If McCormick and Oz beat each other up, though, Barnette could realistically end up on top,” said Murray.
A majority of Republican primary voters (54%) have a very favorable opinion of former President Trump. By comparison, fewer Democrats feel the same about Biden (44%). Just over a third of Republicans (37%) say it is very important to nominate a U.S. Senate candidate who is a strong supporter of Trump.
Dr. Oz, who has been endorsed by Trump, is seen as the most stalwart backer of the former president. Overall, 54% call Oz a strong supporter of Trump versus 20% who say he is not a particularly strong supporter. Opinion is more divided on the Trumpian loyalties of McCormick (30% strong to 23% not strong). Most GOP voters are aware of Trump’s endorsement in this race. While 69% say this has not changed their opinion of Oz, 22% say it does make them feel more favorably toward him compared with 8% who feel less favorable.
“If Dr. Oz thought Trump’s seal of approval was going to lock this nomination up for him, he was mistaken. It may help Oz on the margins, but it doesn’t completely erase his negatives. And other candidates have earned their Trumpian bona fides with Republican voters,” said Murray.
The poll also asked about Oz’s residency status. Most (69%) are aware that he moved to Pennsylvania shortly before announcing his U.S. Senate campaign. About 1 in 4 GOP voters (26%) say this bothers them a lot, 25% are bothered a little, and about half (48%) are not bothered at all.
A tale of two parties
Democratic and Republican voters hold similar views of their own parties. Nearly 9 in 10 in both groups have a favorable view of their respective parties, with 38% of Democrats and 40% of Republicans saying their party opinion is “very favorable.” Over 6 in 10 voters in both groups describe themselves as strong partisans. More than 8 in 10 in both groups say it is very important for their party to control the U.S. Senate after this year’s elections and more than 7 in 10 Democrats and Republicans alike say they are certain to vote in next month’s primary election.
There are some areas of partisan difference, though. A sense of optimism about the outcome of this year’s midterm elections is more prevalent among Republicans (75% overall, including 42% very optimistic) than among Democrats (55% overall, including 19% very optimistic). A larger number of Republicans (41%) than Democrats (29%) say they are more enthusiastic about this year’s Senate race compared with past elections.
The biggest partisan gaps in the poll, though, are found in the overall assessment of the country. Democratic opinion is mixed between seeing the nation as headed in the right direction (47%) or being on the wrong track (36%). Republicans, however, are nearly unanimous that the country has gone awry (97%). The two partisan groups also hold vastly different opinions on a point of fact. While 97% of Democrats describe the 2020 presidential outcome as “fair and square,” just 22% of Republicans agree. Fully 71% of GOP primary voters believe Biden only won because of voter fraud.
“It’s a whole different world out there for Democrats and Republicans. Not just about issues and policies, but their grasp on reality as well. The willingness of voters to accept this invention about the 2020 elections, and GOP leaders’ willingness to use it as motivation for their base, continues to pose a danger for the future of American democracy,” said Murray.
The poll also asked about other candidates on the ballot for U.S. Senate, specifically George Bochetto (R), Sean Gale (R), and Alexandria Khalil (D). Fewer than 1 in 5 voters in their respective parties have heard of these candidates, with at least half being unlikely to support any of the three.
The Monmouth University Poll was conducted by telephone from April 20 to 25, 2022 with a sample of registered Pennsylvania voters who have participated in a past primary election, including 406 registered Democrats and 407 registered Republicans. The Democratic primary sample represents 28% of all registered voters in Pennsylvania and the Republican sample represents 25% of voters. The margin of error for each party sample is +/- 4.9 percentage points. The poll was conducted by the Monmouth University Polling Institute in West Long Branch, NJ.
QUESTIONS AND RESULTS
(* Some columns may not add to 100% due to rounding.)
1.Would you say things in the country are going in the right direction, or have they gotten off on the wrong track?
| DEM | REP | |
| Right direction | 47% | 2% |
| Wrong track | 36% | 97% |
| (VOL) Depends | 11% | 1% |
| (VOL) Don’t know | 6% | 1% |
| (n) | (406) | (407) |
2.How important is it to have the [Democratic Party keep/Republican Party take] control of the U.S. Senate in this year’s midterm elections – very important, somewhat important, not too important, or not at all important?
| DEM | REP | |
| Very important | 82% | 84% |
| Somewhat important | 12% | 11% |
| Not too important | 2% | 3% |
| Not at all important | 2% | 1% |
| (VOL) Don’t know | 1% | 1% |
| (n) | (406) | (407) |
3/4.I am going to read you a list of [Democratic/Republican] candidates running for the U.S. Senate seat in Pennsylvania this year. For each one, please tell me if you have definitely heard of them, not sure if you’ve heard of them, or if you’ve definitely not heard of them?
[If DEFINITELY HEARD OF:] For each of the following, please tell me if you have a very favorable, somewhat favorable, somewhat unfavorable, or very unfavorable opinion of them. [NAMES WERE ROTATED]
Very favorable | Somewhat favorable | Somewhat unfavorable | Very unfavorable | Heard of, no opinion (VOL) | Not sure if heard of | Definitely not heard of | (n) | |
| DEMOCRAT | ||||||||
| John Fetterman | 42% | 26% | 3% | 2% | 8% | 7% | 13% | (406) |
| Malcolm Kenyatta | 12% | 20% | 3% | 1% | 6% | 12% | 45% | (406) |
| Alexandria Khalil | 1% | 10% | 1% | 0% | 5% | 18% | 65% | (406) |
| Conor Lamb | 19% | 32% | 4% | 2% | 7% | 11% | 24% | (406) |
| REPUBLICAN | ||||||||
| Kathy Barnette | 15% | 22% | 3% | 2% | 10% | 16% | 34% | (407) |
| Jeff Bartos | 5% | 23% | 5% | 1% | 15% | 14% | 36% | (407) |
| George Bochetto | 1% | 6% | 3% | 0% | 2% | 19% | 68% | (407) |
| Sean Gale | 1% | 6% | 2% | 2% | 3% | 15% | 70% | (407) |
| David McCormick | 14% | 37% | 9% | 6% | 14% | 8% | 12% | (407) |
| Dr. Mehmet Oz | 18% | 30% | 16% | 21% | 8% | 2% | 6% | (407) |
| Carla Sands | 7% | 18% | 3% | 1% | 8% | 12% | 52% | (407) |
5.In your opinion, what are the most important one or two issues facing the country right now? [LIST WAS NOT READ] [Note: Results add to more than 100% because multiple responses were accepted.]
| DEM | REP | |
| Economy (general) | 9% | 13% |
| Taxes | 2% | 3% |
| Jobs | 7% | 5% |
| Inflation, increasing prices | 28% | 56% |
| Gas prices specifically | 8% | 19% |
| Housing costs, rent | 1% | 3% |
| Health care, health insurance | 13% | 3% |
| Education, schools | 6% | 4% |
| Transportation, infrastructure | 1% | 0% |
| Crime, violence | 8% | 4% |
| Gun control, 2nd Amendment | 7% | 4% |
| Race, equity, police reform | 9% | 1% |
| Illegal immigration | 2% | 36% |
| Environment, climate change | 11% | 1% |
| Voting, elections, democracy | 11% | 4% |
| Traditional values, family values | 1% | 5% |
| Abortion | 5% | 3% |
| Covid, pandemic | 12% | 4% |
| Terrorism, national security | 2% | 6% |
| Russia/Ukraine | 18% | 10% |
| Energy issues | 1% | 3% |
| Divided country | 4% | 2% |
| Leadership, Biden | 1% | 6% |
| Trump | 1% | 0% |
| Debt, government spending | 1% | 2% |
| Other | 13% | 11% |
| Nothing/no answer | 3% | 1% |
| (n) | (406) | (407) |
6.Do any of the [Democratic/Republican] candidates for U.S. Senate stand out in your mind as being particularly strong on the issues you just mentioned? [If YES: Who stands out?] [Note: Results add to more than 100% because multiple responses were accepted.]
| DEM | REP | |||
| John Fetterman | 31% | Kathy Barnette | 12% | |
| Malcolm Kenyatta | 6% | Jeff Bartos | 3% | |
| Alexandria Khalil | 1% | George Bochetto | 1% | |
| Conor Lamb | 13% | Sean Gale | 1% | |
| David McCormick | 16% | |||
| Dr. Mehmet Oz | 20% | |||
| Carla Sands | 5% | |||
| (VOL) Don’t know | 20% | (VOL) Don’t know | 16% | |
| No one | 39% | No one | 40% | |
| (n) | (406) | (n) | (407) |
7.How likely is it that you will vote in the [Democratic/Republican] primary election for U.S. Senator on May 17th– did you already vote by mail or in person, are you certain to vote, likely to vote, are you not sure, or are you unlikely to vote?
| DEM | REP | |
| Already voted | 3% | 1% |
| Certain to vote | 70% | 70% |
| Likely to vote | 21% | 23% |
| Not sure | 4% | 3% |
| Unlikely to vote | 3% | 1% |
| (VOL) Definitely won’t vote | 0% | 1% |
| (n) | (406) | (407) |
8.For each candidate, please tell me how likely it is that you will support them in the [Democratic/Republican] primary election for U.S. Senate – very likely, somewhat likely, not too likely, or not at all likely. [Note: respondents who already voted were asked for whom they cast their ballot. The candidate chosen was assigned as “very likely” and all others as “not at all likely.”] [NAMES WERE ROTATED]
| Very likely | Somewhat likely | Not too likely | Not at all likely | (VOL) Don’t know | (n) | |
| DEMOCRAT | ||||||
| John Fetterman | 44% | 30% | 5% | 8% | 13% | (406) |
| Malcolm Kenyatta | 14% | 26% | 17% | 28% | 15% | (406) |
| Alexandria Khalil | 8% | 21% | 17% | 34% | 19% | (406) |
| Conor Lamb | 23% | 36% | 10% | 14% | 17% | (406) |
| REPUBLICAN | ||||||
| Kathy Barnette | 18% | 33% | 13% | 20% | 16% | (407) |
| Jeff Bartos | 7% | 38% | 18% | 21% | 16% | (407) |
| George Bochetto | 4% | 24% | 20% | 31% | 20% | (407) |
| Sean Gale | 5% | 25% | 23% | 28% | 19% | (407) |
| David McCormick | 19% | 42% | 12% | 17% | 11% | (407) |
| Dr. Mehmet Oz | 22% | 29% | 11% | 31% | 8% | (407) |
| Carla Sands | 9% | 33% | 21% | 21% | 17% | (407) |
9.Is your general impression of the [Democratic/Republican] Party very favorable, somewhat favorable, somewhat unfavorable, or very unfavorable?
| DEM | REP | |
| Very favorable | 38% | 40% |
| Somewhat favorable | 49% | 48% |
| Somewhat unfavorable | 8% | 9% |
| Very unfavorable | 4% | 2% |
| (VOL) Don’t know | 1% | 1% |
| (n) | (406) | (407) |
10.Is your general impression of [Joe Biden/Donald Trump] very favorable, somewhat favorable, somewhat unfavorable, or very unfavorable?
| DEM | REP | |
| Biden | Trump | |
| Very favorable | 44% | 54% |
| Somewhat favorable | 43% | 31% |
| Somewhat unfavorable | 7% | 8% |
| Very unfavorable | 7% | 6% |
| (VOL) Don’t know | 0% | 1% |
| (n) | (406) | (407) |
11.How important is it that the [Democratic/Republican] nominee for U.S. Senate be a strong supporter of [Joe Biden/Donald Trump] – very important, somewhat important, not too important, or not at all important?
| DEM | REP | |
| Biden | Trump | |
| Very important | 49% | 37% |
| Somewhat important | 30% | 33% |
| Not too important | 12% | 12% |
| Not at all important | 8% | 18% |
| (VOL) Don’t know | 1% | 0% |
| (n) | (406) | (407) |
– – – – – – – – – – – – – – – – – – – – – – – – – – – – – – – – – – – – – – – – – – – – – – – – –
ASKED OF DEMOCRATS ONLY:
12D.Thinking about the things you wanted Joe Biden to accomplish as President, would you say he is doing a lot better than you hoped, a little better than you hoped, a lot worse than you hoped, a little worse than you hoped, or has he accomplished about what you hoped?
| DEM | |
| Lot better than hoped | 12% |
| Little better than hoped | 28% |
| Lot worse than hoped | 10% |
| Little worse than hoped | 19% |
| About what you hoped | 30% |
| (VOL) Don’t know | 2% |
| (n) | (406) |
13D.In general, which wing of the Democratic Party would you like to have more influence in Washington – the progressive wing or the moderate wing?
| DEM | |
| Progressive | 42% |
| Moderate | 46% |
| (VOL) Both equally | 3% |
| (VOL) Depends on issue | 0% |
| (VOL) Don’t know | 9% |
| (n) | (406) |
– – – – – – – – – – – – – – – – – – – – – – – – – – – – – – – – – – – – – – – – – – – – – – – – – –
ASKED OF REPUBLICANS ONLY:
12R.For the following candidates, please tell me if you think they are a strong supporter of Donald Trump or not a particularly strong supporter. [NAMES WERE ROTATED]
| REPUBLICAN | Strong supporter | Not a particularly strong supporter | (VOL) Don’t know | Not heard of candidate (from Q3) | (n) |
| Kathy Barnette | 17% | 13% | 21% | 50% | (407) |
| Jeff Bartos | 12% | 12% | 24% | 51% | (407) |
| George Bochetto | 2% | 5% | 5% | 88% | (407) |
| Sean Gale | 3% | 3% | 8% | 86% | (407) |
| David McCormick | 30% | 23% | 26% | 20% | (407) |
| Dr. Mehmet Oz | 54% | 20% | 18% | 8% | (407) |
| Carla Sands | 14% | 10% | 12% | 63% | (407) |
13R.And which of these candidates is the strongest supporter of Donald Trump?
| REP | |
| Kathy Barnette | 6% |
| Jeff Bartos | 2% |
| George Bochetto | 1% |
| Sean Gale | 0% |
| David McCormick | 12% |
| Dr. Mehmet Oz | 43% |
| Carla Sands | 7% |
| (VOL) Cannot choose | 1% |
| None are strong (from Q12-R) | 28% |
| (n) | (407) |
14R.Have you heard that Dr. Oz moved to Pennsylvania shortly before he announced his run for U.S. Senate, or have you not heard this?
| REP | |
| Heard | 69% |
| Not heard | 31% |
| (n) | (407) |
15R.Does the fact that Dr. Oz only recently moved to Pennsylvania bother you a lot, a little, or not at all?
| REP | |
| A lot | 26% |
| A little | 25% |
| Not at all | 48% |
| (VOL) Don’t know | 1% |
| (n) | (407) |
16R.Have you heard that Donald Trump endorsed Dr. Oz for the Republican nomination in the U.S. Senate race, or have you not heard this?
| REP | |
| Heard | 82% |
| Not heard | 18% |
| (n) | (407) |
17R.[Did/Does] Trump’s endorsement make you feel more favorably or less favorably toward Dr. Oz, or [did/does] it not really change how you already [felt/feel] about him?
| REP | |
| More favorably | 22% |
| Less favorably | 8% |
| Does not change | 69% |
| (VOL) Don’t know | 1% |
| (n) | (407) |
– – – – – – – – – – – – – – – – – – – – – – – – – – – – – – – – – – – – – – – – – – – – – – – – –
ASKED OF BOTH PARTIES’ VOTERS:
14D/18R.Compared to past elections for U.S. Senate, are you more enthusiastic than usual, less enthusiastic, or about the same as past elections?
| DEM | REP | |
| More enthusiastic | 29% | 41% |
| Less enthusiastic | 14% | 10% |
| About the same | 56% | 47% |
| (VOL) Don’t know | 1% | 1% |
| (n) | (406) | (407) |
15D/19R.Do you feel optimistic or pessimistic about the outcome of the upcoming midterm elections? [Is that very or somewhat optimistic/pessimistic?]
| DEM | REP | |
| Very optimistic | 19% | 42% |
| Somewhat optimistic | 36% | 33% |
| Somewhat pessimistic | 33% | 12% |
| Very pessimistic | 10% | 8% |
| (VOL) Don’t know | 2% | 4% |
| (n) | (406) | (407) |
16D/20R.Looking back at the 2020 presidential election, do you believe Joe Biden won the 2020 election fair and square, or do you believe that he only won it due to voter fraud?
| DEM | REP | |
| Fair and square | 97% | 22% |
| Due to voter fraud | 2% | 71% |
| (VOL) Don’t know | 1% | 7% |
| (n) | (406) | (407) |
D1.In politics today, do you consider yourself a Republican, Democrat, independent, or something else? [If DEM/REP:] Do you consider yourself a strong [Republican/Democrat] or not so strong? [If IND/OTHER:] Do you lean more toward the Republican Party or more toward the Democratic Party?
| DEM | REP | |
| Strong Republican | 0% | 63% |
| Republican, not strong | 1% | 21% |
| Lean Republican | 2% | 14% |
| Independent, no lean | 3% | 1% |
| Lean Democrat | 13% | 0% |
| Democrat, not strong | 17% | 0% |
| Strong Democrat | 65% | 0% |
| (VOL) Don’t know | 0% | 0% |
| (n) | (406) | (407) |
D2.In general, would you describe your political views as liberal, moderate, or conservative? [Is that very or somewhat liberal/conservative?]
| DEM | REP | |
| Very liberal | 23% | 2% |
| Somewhat liberal | 20% | 4% |
| Moderate | 44% | 23% |
| Somewhat conservative | 6% | 23% |
| Very conservative | 3% | 47% |
| (VOL) Don’t know | 3% | 1% |
| (n) | (406) | (407) |
METHODOLOGY
The Monmouth University Poll was sponsored and conducted by the Monmouth University Polling Institute from April 20 to 25, 2022 with a probability-based random sample of Pennsylvania voters drawn from a list of registered voters who participated in at least one primary election since 2016. Interviews were conducted by a live telephone interviewer, in English, with 406 registered Democrats (113 landline and 293 cell phone) and 407 registered Republicans (133 landline and 274 cell phone). Monmouth is responsible for all aspects of the survey design, data weighting and analysis. The full sample is weighted for party registration, age, gender, race, education, and region based on state voter registration list information and U.S. Census information (CPS 2018 supplement). Data collection support provided by Braun Research (field) and Aristotle (voter sample). For results based on each party’s sample, one can say with 95% confidence that the error attributable to sampling has a maximum margin of plus or minus 4.9 percentage points (unadjusted for sample design). Sampling error can be larger for sub-groups (see table below). In addition to sampling error, one should bear in mind that question wording and practical difficulties in conducting surveys can introduce error or bias into the findings of opinion polls.
| DEMOGRAPHICS (weighted) | |
| DEMOCRAT | REPUBLICAN |
| 40% Male | 51% Male |
| 60% Female | 49% Female |
| 16% 18-34 | 10% 18-34 |
| 21% 35-49 | 17% 35-49 |
| 27% 50-64 | 36% 50-64 |
| 36% 65+ | 37% 65+ |
| 74% White | 97% White |
| 20% Black | 1% Black |
| 4% Hispanic | 2% Hispanic |
| 2% Asian/Other | 0% Asian/Other |
| 58% No degree | 69% No degree |
| 42% 4 year degree | 31% 4 year degree |
Click on pdf file link below for full methodology and crosstabs by key demographic groups.