West Long Branch, NJ – More than 6 in 10 New Jerseyans describe themselves as pro-choice on the issue of abortion, a number that has increased over the past decade. The Monmouth (“Mon-muth”) University Poll finds that three-fourths of state residents support maintaining legal access to abortion, either with or without some limitations. While pro-choice views among Garden State Republicans have actually declined over the past ten years, support for abortion access among this group is slightly higher than it is for Republicans nationally. Most New Jerseyans are satisfied with the state’s current abortion access laws and few expect they will be weakened. Still, a majority say it would be a good idea to enshrine those protections in the state constitution.
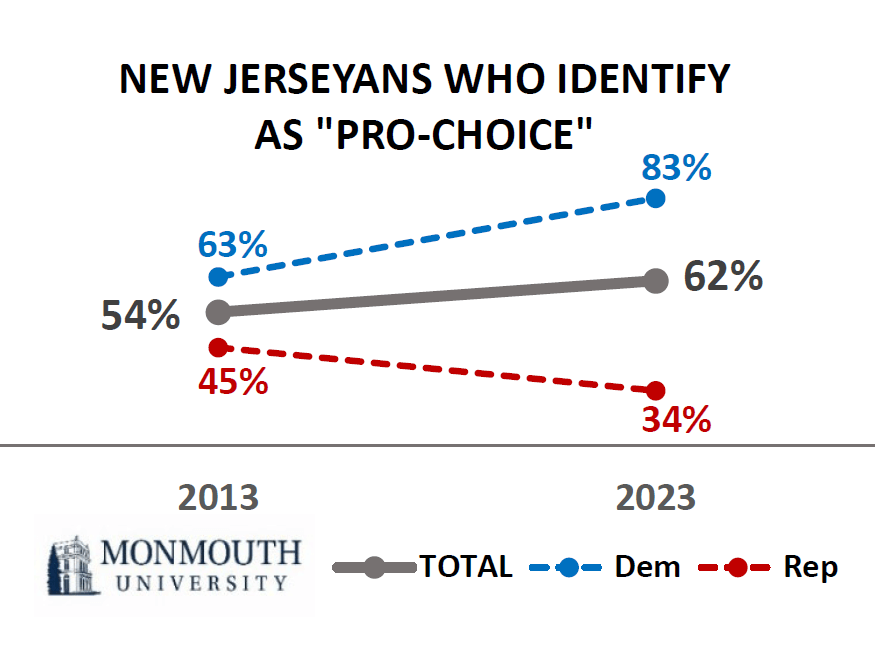
Twice as many New Jerseyans identify themselves as pro-choice (62%) as say they are pro-life (29%) when asked their personal views of abortion. The pro-choice number has risen by 8 percentage points in the past decade (54% in 2013), but that increase has not been universal. While the proportion of Democrats who call themselves pro-choice has grown significantly (from 63% in 2013 to 83% now), the number of Republicans who say the same has actually fallen (from 45% to 34%). The pro-choice views of independents have remained more stable (from 53% in 2013 to 59% in 2023).
“In just ten years, we’ve gone from a notable partisan difference in abortion opinion to a situation where partisanship has become more determinative. Today, a person’s position on abortion is almost a proxy for their political party affiliation. However, it’s also important to note that New Jersey Republicans are slightly more likely to stray from the national party orthodoxy on this issue,” said Patrick Murray, director of the independent Monmouth University Polling Institute.
Overall, 36% of New Jerseyans say their position on abortion policy is that it should always be legal and another 39% say it should be legal with some limitations. Moving to the other end of the spectrum, just 3% say abortion should always be illegal and 18% say it should be illegal, but with some exceptions for rape, incest or to save the mother’s life. The number of New Jerseyans who agree that abortion access should be legal in all or most circumstances (75%) is somewhat larger than the proportion of Americans who hold the same view (66%) according to a national Monmouth University Poll conducted last summer after the Supreme Court overturned Roe v. Wade.
Support for legal abortion, either in all cases or with some limitations, is higher among New Jersey Democrats (92%) and independents (74%) than it is among Republicans (50%). However, while legal support levels for Garden State Democrats and independents are about the same as among those two partisan groups nationally (91% of Democrats and 68% of independents), New Jersey GOP support for legal abortion is slightly higher than it is for Republicans nationally (38%).
Most New Jerseyans (54%) feel the state’s current abortion access laws are about right. Just 1 in 4 would change them – with opinion being equally divided on whether access should be strengthened (11%) or weakened (10%) – and 20% have no opinion. Few New Jerseyans think it is very (8%) or somewhat (26%) likely that abortion access will become more restricted in New Jersey over the next ten years. In fact, most say this is not too likely (36%) or not at all likely (25%) to happen. Still, a majority of state residents (58%) feel it is a good idea to put abortion protections into the state constitution. Specifically among those New Jerseyans who describe themselves as pro-choice, 69% are satisfied with the state’s current abortion laws and 62% think they are unlikely to be weakened, but 73% still think it is a good idea to enshrine those laws in the state constitution.
“The majority of New Jerseyans are satisfied with the state’s current level of abortion access and have little concern it will change. Yet, many seem to feel that preserving those laws in the state constitution would not be a bad move when they look at what’s going on in other states,” said Murray.
Interestingly, New Jersey abortion opinion does not display significant gender differences. For example, 79% of women and 71% of men in the state support legal access to abortion. The comparable national results show a much wider gender gap (73% women and 59% men in June 2022).
The Monmouth University Poll was conducted by telephone from January 5 to 9, 2023 with 809 New Jersey adults. The question results in this release have a margin of error of +/- 4.7 percentage points for the full sample. The poll was conducted by the Monmouth University Polling Institute in West Long Branch, NJ.
QUESTIONS AND RESULTS
(* Some columns may not add to 100% due to rounding.)
[Q1 held for future release.]
[Q2-28 previously released.]
29.On the issue of abortion, would you consider yourself pro-choice or pro-life?
| Trend: | Jan. 2023 | April 2013 |
|---|---|---|
| Pro-choice | 62% | 54% |
| Pro-life | 29% | 38% |
| (VOL) Mixed/neither | 5% | 3% |
| (VOL) Don’t know | 4% | 4% |
| (n) | (809) | (806) |
30.Which comes closest to your view on abortion: it should always be legal, it should be legal with some limitations, it should be illegal except for rape, incest or to save the mother’s life, or it should always be illegal?
| Response: | Jan. 2023 |
|---|---|
| Always legal | 36% |
| Legal with limitations | 39% |
| Illegal with exceptions | 18% |
| Always illegal | 3% |
| (VOL) Don’t know | 4% |
| (n) | (809) |
31.Does New Jersey need to change its current laws about abortion access or are the current laws about right? [If CHANGE: Does the state need to strengthen or weaken access to abortion?]
| Response: | Jan. 2023 |
|---|---|
| Change, strengthen | 11% |
| Change, weaken | 10% |
| Change, not sure how | 5% |
| Current laws about right | 54% |
| (VOL) Don’t know | 20% |
| (n) | (809) |
32.How likely do you think it is that access to abortion will become more restricted in New Jersey over the next ten years – very likely, somewhat likely, not too likely or not at all likely?
| Response: | Jan. 2023 |
|---|---|
| Very likely | 8% |
| Somewhat likely | 26% |
| Not too likely | 36% |
| Not at all likely | 25% |
| (VOL) Don’t know | 4% |
| (n) | (809) |
33.Do you think it is a good idea or bad idea to put abortion protections into the state constitution?
| Response: | Jan. 2023 |
|---|---|
| Good idea | 58% |
| Bad idea | 34% |
| (VOL) Don’t know | 9% |
| (n) | (809) |
[Q34-37 held for future release.]
[Q38-44 previously released.]
Methodology
The Monmouth University Poll was sponsored and conducted by the Monmouth University Polling Institute from January 5 to 9, 2023 with a probability-based random sample of 809 New Jersey adults age 18 and older. This includes 286 contacted by a live interviewer on a landline telephone and 523 contacted by a live interviewer on a cell phone, in English. Telephone numbers were selected through random digit dialing and landline respondents were selected with a modified Troldahl-Carter youngest adult household screen. Monmouth is responsible for all aspects of the survey design, data weighting and analysis. The full sample is weighted for region, age, education, gender and race based on US Census information (ACS 2021 one-year survey). Interviewing services were provided by Braun Research, with sample obtained from Dynata. For results based on this sample, one can say with 95% confidence that the error attributable to sampling has a maximum margin of plus or minus 4.7 percentage points (adjusted for sample design effects). Sampling error can be larger for sub-groups (see table below). In addition to sampling error, one should bear in mind that question wording and practical difficulties in conducting surveys can introduce error or bias into the findings of opinion polls.
NJ Regions (by county)
North – Bergen, Essex, Hudson, Morris, Passaic, Sussex, Union, Warren
Central – Hunterdon, Mercer, Middlesex, Monmouth, Somerset
South – Atlantic, Burlington, Camden, Cape May, Cumberland, Gloucester, Ocean, Salem
| DEMOGRAPHICS (weighted) |
| Self-Reported |
| 23% Republican |
| 39% Independent |
| 38% Democrat |
| 49% Male |
| 51% Female |
| 27% 18-34 |
| 34% 35-54 |
| 39% 55+ |
| 55% White |
| 13% Black |
| 20% Hispanic |
| 12% Asian/Other |
| 59% No degree |
| 41% 4 year degree |
Click on pdf file link below for full methodology and crosstabs by key demographic groups.


