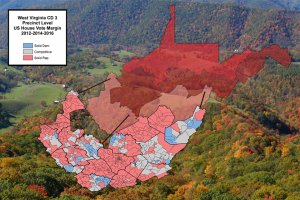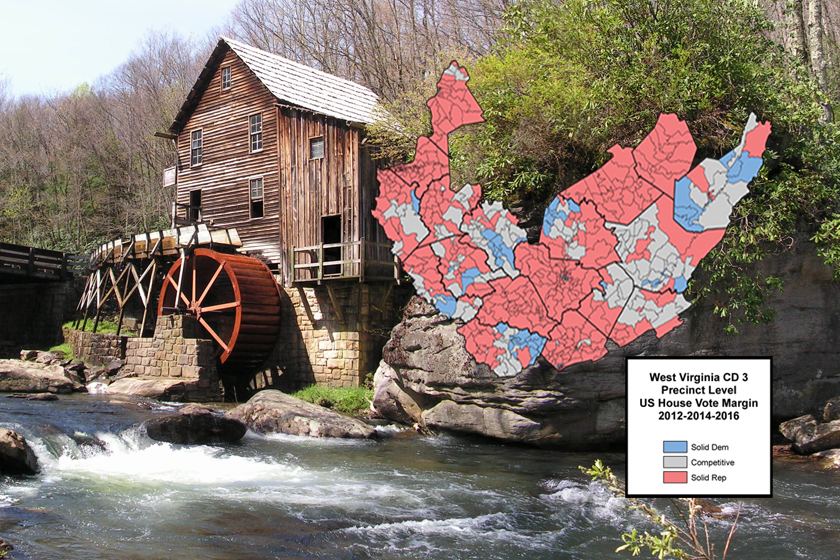
West Long Branch, NJ – Republican Carol Miller has overtaken Democrat Richard Ojeda in the race for West Virginia’s 3rd Congressional District, according to the second Monmouth University Poll of this contest. Ojeda’s personal appeal and the presence of a popular Democratic U.S. Senator at the top of the ticket have kept him in a race where all the underlying fundamentals – especially President Donald Trump’s popularity – favor Miller. The question is whether that is enough to keep this race competitive as the district starts reverting to its GOP norms.
Miller currently holds a 48% to 45% lead over Ojeda among likely voters using Monmouth’s standard midterm turnout model. Other turnout models show similar results, with 48% to 46% leads for Miller using either a model that incorporates a turnout surge in Democratic precincts or a model that projects lower turnout overall. In June, Ojeda actually held a lead of between 6 and 9 points in Monmouth’s poll – 47%-41% in the standard model, 48%-39% in the Democratic surge model, and 47%-40% in the low turnout model. While there has been a significant increase in Miller’s vote share, her current lead is within the poll’s margin of error for all three likely voter models.
“Ojeda’s share of the vote hasn’t really moved since the summer while Miller’s standing has risen. These results are a sign of Republican voters returning to the fold in a district that leans Republican, especially in its support of the president,” said Patrick Murray, director of the independent Monmouth University Polling Institute.
Trump receives a nearly 2-to-1 positive rating from WV-03 voters – 63% approve and 35% disapprove. This is nearly identical to his 63%-34% rating from June. Seven-in-ten (70%) voters say that the president is a very important factor in their vote for Congress, with somewhat more Trump opponents (79%) than Trump supporters (69%) feeling this way. In general, though, more WV-03 voters prefer to see the Republican Party (49%) in control of Congress rather than the Democrats (30%).
Trump held a rally in the state earlier this month where he endorsed Miller and called Ojeda a “wacko” and “stone cold crazy.” Three-quarters (77%) of voters are aware of Trump’s endorsement, but its impact is a wash – 23% say it makes them more likely to support Miller, 27% say it makes them less likely, and 47% say it has no impact on their vote. Just over half (55%) have heard about the president’s characterization of Ojeda and slightly more voters actually say this makes them more likely (18%) rather than less likely (9%) to back the Democrat. However, the overwhelming majority (70%) say it doesn’t affect their vote either way.
“The problem for Ojeda is that there just aren’t that many Trump opponents in this district to give him the kind of edge that he would have if this was a competitive suburban district elsewhere in the country. The Democrat is hanging on in this race largely due to his personal connection with voters there,” said Murray.
Nearly half (48%) of WV-03 voters say Ojeda understands their day to day concerns while 34% say he does not. Opinion of Miller is more divided on this factor, with 40% saying she understands their day to day concerns and 42% saying she does not. These results were similar for Ojeda in June, when 42% said he understood their concerns and 24% said he did not. Miller’s rating on this metric has become more negative since June when 33% said she understood their concerns and 24% said she did not.
Both candidates, though, hold similar personal ratings – 37% favorable to 31% unfavorable for Miller and 39% favorable to 32% unfavorable for Ojeda. The Republican has gotten a slightly more positive bump than the Democrat on this rating since the summer, although both have seen their negative numbers go up much more. In June, Miller’s rating stood at 28% favorable to 13% unfavorable while Ojeda’s rating stood at 37% favorable to 15% unfavorable.
Voters are divided on which candidate shares their values – 39% say it is Miller and 36% say it is Ojeda, with 10% saying both candidates equally share their values. The top issue for WV-03 voters is health care (27%), as it is in other districts Monmouth has polled in the 2018 cycle. This is followed by abortion (16%), job creation (15%), opioid addiction (11%), immigration (11%), gun control (10%), and taxes (5%). Ojeda voters choose health care (40%) as their top issue, with opioid addiction (17%) and job creation (14%) falling in the next tier of priorities. Miller voters, on the other hand, are more likely to name abortion (25%) as their top concern, with gun control (16%), immigration (15%), job creation (14%), and health care (13%) grouped in the next level.
“This is the only district Monmouth has polled where abortion registers this highly as voters’ top issue. It just illustrates how different this race is than most of the other contests that will decide which party controls the House,” said Murray.
The Monmouth University Poll also asked WV-03 voters about their preference in the state’s U.S. Senate race. Incumbent Joe Manchin (56%) has a significant 20 point advantage over challenger Patrick Morrisey (36%) in this district using Monmouth’s standard turnout model. This is larger than the 14 point lead (53% to 39%) Manchin held in this part of the state in June. Monmouth did not survey the entire state in the current poll, but Manchin’s June advantage in the 3rd Congressional District was 7 points higher than his overall statewide lead of 7 points (50%-43%) in that poll.
Manchin was the only Democratic senator to vote in favor of Brett Kavanaugh’s nomination to the Supreme Court, but the poll finds that this is not having much of an electoral impact either way. Nearly 8-in-10 (78%) likely WV-03 voters say this issue has not caused them to change their vote for the Senate. Among the remainder, 7% say the Kavanaugh issue has made them more likely to support Manchin, 5% say it has made them more likely to support Morrisey, and 9% say it has made them more undecided.
The poll finds that Morrisey supporters are more likely to vote straight party-line than they were in the summer while Manchin voters have become slightly less likely. Specifically, 91% of Morrisey voters say they are supporting Miller in the House race and only 6% are supporting Ojeda. In June, a smaller number of Morrisey voters (78%) were committed to voting Republican in the House while 13% were supporting the Democrat. Among Manchin voters, 72% currently support Ojeda, but 21% are splitting their ticket for Miller in the House race. In June, a slightly smaller 17% of Manchin voters preferred Miller while 72% stood with Ojeda.
“Manchin’s name brand might be incredibly strong in West Virginia’s 3rd District, but his coattails aren’t long enough to easily carry Ojeda over the finish line with him,” said Murray.
The Monmouth University Poll was conducted by telephone from October 10 to 14, 2018 with 350 likely voters in West Virginia 3rd Congressional District. The question results in this release have a margin of error of +/-5.2 percentage points. The error of the difference between the two candidates’ vote share (i.e. the “lead”) is +/-7.4 percentage points. The poll was conducted by the Monmouth University Polling Institute in West Long Branch, NJ.
QUESTIONS AND RESULTS
(* Some columns may not add to 100% due to rounding.)
[QUESTIONS SEN1/2 & HOUSE1/2 WERE ROTATED]
Sen1/2. . [WV-03 ONLY:] If the election for U.S. Senate was today, would you vote for Patrick Morrisey the Republican, Joe Manchin the Democrat, or Rusty Hollen the Libertarian? [IF UNDECIDED: If you had to vote for one of the following at this moment, do you lean more toward Patrick Morrisey or more toward Joe Manchin?] [NAMES WERE ROTATED]
| Likely Voters with leaners | Oct. 2018 | June 2018 | ||||
| Standard | Democratic | Low Turnout | Standard | Democratic | Low | |
| Patrick Morrisey | 36% | 35% | 35% | 39% | 38% | 39% |
| Joe Manchin | 56% | 56% | 57% | 53% | 54% | 54% |
| Rusty Hollen | 2% | 2% | 2% |
n/a |
n/a |
n/a |
| (VOL) Other |
<1% |
<1% |
<1% | 5% | 5% | 4% |
| (VOL) Undecided | 6% | 6% | 6% | 3% | 3% | 3% |
| (n) | (350) | (350) | (350) | (343) | (343) | (343) |
House1/2.. If the election for U.S. House of Representatives in your district was today, would you vote for Carol Miller the Republican or Richard Ojeda the Democrat? [IF UNDECIDED: If you had to vote for one of the following at this moment, do you lean more toward Carol Miller or more toward Richard Ojeda?] [NAMES WERE ROTATED]
| Likely Voters with leaners | Oct. 2018 | June 2018 | ||||
| Standard | Democratic | Low Turnout | Standard | Democratic | Low | |
| Carol Miller | 48% | 48% | 48% | 41% | 39% | 40% |
| Richard Ojeda | 45% | 46% | 46% | 47% | 48% | 47% |
| (VOL) Other | 2% | 2% | 1% | 3% | 3% | 3% |
| (VOL) Undecided | 5% | 5% | 5% | 9% | 10% | 9% |
| (n) | (350) | (350) | (350) | (343) | (343) | (343) |
[QUESTIONS 3 & 4 WERE ROTATED]
3. Is your general impression of Carol Miller favorable or unfavorable, or do you have no opinion of her?
| Likely Voter Standard | Oct. 2018 | June 2018 |
| Favorable | 37% | 28% |
| Unfavorable | 31% | 13% |
| No opinion | 32% | 59% |
| (n) | (350) | (343) |
4. Is your general impression of Richard Ojeda favorable or unfavorable, or do you have no opinion of him?
| Likely Voter Standard | Oct. 2018 | June 2018 |
| Favorable | 39% | 37% |
| Unfavorable | 32% | 15% |
| No opinion | 29% | 48% |
| (n) | (350) | (343) |
5. How much interest do you have in the upcoming election for House of Representatives – a lot of interest, a little interest, or not much interest at all?
| Likely Voter Standard | Oct. 2018 | June 2018 |
| A lot | 73% | 73% |
| A little | 18% | 20% |
| Not much at all | 8% | 7% |
| (VOL) Don’t know | 1% | 0% |
| (n) | (350) | (343) |
6. Have you been following the campaign in your congressional district very closely, somewhat closely, or not too closely?
| Likely Voter Standard | Oct. 2018 | June 2018 |
| Very closely | 33% | 25% |
| Somewhat closely | 49% | 46% |
| Not too closely | 17% | 29% |
| (VOL) Don’t know | 1% | 0% |
| (n) | (350) | (343) |
7. Do you approve or disapprove of the job Donald Trump is doing as president? [Do you (approve/disapprove) strongly or somewhat?]
| Likely Voter Standard | Oct. 2018 | June 2018 |
| Strongly approve | 52% | 49% |
| Somewhat approve | 11% | 14% |
| Somewhat disapprove | 5% | 7% |
| Strongly disapprove | 30% | 27% |
| (VOL) Don’t know | 2% | 3% |
| (n) | (350) | (343) |
8. On most issues would you say you support or oppose what President Trump is doing?
| Likely Voter Standard | Oct. 2018 | June 2018 |
| Support | 62% | 63% |
| Oppose | 33% | 32% |
| (VOL) Depends/both | 2% | 3% |
| (VOL) Don’t know | 2% | 2% |
| (n) | (350) | (343) |
9. How important is it for you to cast a vote for Congress that shows your [support of/opposition to] President Trump – very important, somewhat important, not too important, or not at all important?
| Likely Voter Standard | Oct. 2018 | June 2018 |
| Very important | 70% | 64% |
| Somewhat important | 17% | 22% |
| Not too important | 2% | 4% |
| Not at all important | 7% | 5% |
| (VOL) Don’t know | 4% | 5% |
| (n) | (350) | (343) |
10. Would you rather see the Republicans or the Democrats in control of Congress, or doesn’t this matter to you?
| Likely Voter Standard | Oct. 2018 |
| Republicans | 49% |
| Democrats | 30% |
| Does not matter | 18% |
| (VOL) Don’t know | 2% |
| (n) | (350) |
[QUESTIONS 11 & 12 WERE ROTATED]
11. Do you think Carol Miller does or does not understand the day to day concerns of people like you?
| Likely Voter Standard | Oct. 2018 | June 2018 |
| Does | 40% | 33% |
| Does not | 42% | 24% |
| (VOL) Don’t know | 19% | 43% |
| (n) | (350) | (343) |
12. Do you think Richard Ojeda does or does not understand the day to day concerns of people like you?
| Likely Voter Standard | Oct. 2018 | June 2018 |
| Does | 48% | 42% |
| Does not | 34% | 24% |
| (VOL) Don’t know | 18% | 34% |
| (n) | (350) | (343) |
13. Which candidate shares more of your values – Carol Miller or Richard Ojeda, or do they share your values equally? [NAMES WERE ROTATED]
| Likely Voter Standard | Oct. 2018 |
| Carol Miller | 39% |
| Richard Ojeda | 36% |
| Both equally | 10% |
| (VOL) Neither one | 6% |
| (VOL) Don’t know | 10% |
| (n) | (350) |
14. Please tell me which one of the following policy issues is most important to you in your vote choice for Congress? [ITEMS WERE ROTATED]
| Likely Voter Standard | Oct. 2018 |
| Immigration policy | 11% |
| Health care policy | 27% |
| Gun control policy | 10% |
| Abortion policy | 16% |
| Tax policy | 5% |
| Job creation policy | 15% |
| Opioid addiction policy | 11% |
| (VOL) Other | 2% |
| (VOL) Don’t know | 3% |
| (n) | (350) |
[QUESTIONS 15/15A & 16/16A WERE ROTATED]
15. Have you heard that Carol Miller was recently endorsed by Donald Trump, or haven’t you heard about this?
| Likely Voter Standard | Oct. 2018 |
| Heard | 77% |
| Not heard | 23% |
| (n) | (350) |
15A. Does Trump’s endorsement make you more likely to support Miller, less likely to support Miller, or does it not change your vote choice either way?
| Likely Voter Standard | Oct. 2018 |
| More likely to support Miller | 23% |
| Less likely to support Miller | 27% |
| Does not change vote choice | 47% |
| (VOL) Don’t know | 2% |
| (n) | (350) |
16. Have you heard that Donald Trump recently called Richard Ojeda a wacko and stone-cold crazy, or haven’t you heard about this?
| Likely Voter Standard | Oct. 2018 |
| Heard | 55% |
| Not heard | 45% |
| (n) | (350) |
16A. Does Trump’s statement make you more likely to support Ojeda, less likely to support Ojeda, or does it not change your vote choice either way?
| Likely Voter Standard | Oct. 2018 |
| More likely to support Ojeda | 18% |
| Less likely to support Ojeda | 9% |
| Does not change vote choice | 70% |
| (VOL) Don’t know | 3% |
| (n) | (350) |
17. Turning to the U.S. Senate race, has anything that’s happened in the last few weeks related to the nomination of Brett Kavanaugh to the Supreme Court caused you to change your mind about who you will support in the election for U.S. Senate, or hasn’t it changed your mind? [If “YES”: Has this made you more likely to support Morrisey, more likely to support Manchin, or has it made you more undecided?]
| Likely Voter Standard | Oct. 2018 |
| Yes, more likely to support Morrisey | 5% |
| Yes, more likely to support Manchin | 7% |
| Yes, more undecided | 9% |
| No, has not changed my mind | 78% |
| (VOL) Don’t know | 1% |
| (n) | (350) |
METHODOLOGY
The Monmouth University Poll was sponsored and conducted by the Monmouth University Polling Institute from October 10 to 14, 2018 with a random sample of 350 likely voters in West Virginia’s 3rd Congressional District, drawn from a list of registered voters who voted in at least one of the last four general or primary elections, or have registered to vote since January 2016. This includes 207 contacted by a live interviewer on a landline telephone and 143 contacted by a live interviewer on a cell phone in English. Monmouth is responsible for all aspects of the survey design, data weighting and analysis. Final sample is weighted for region, party registration, age, gender, education and race based on state voter registration list and U.S. Census information. Data collection support provided by Braun Research (field) and L2 (voter sample). For results based on this sample, one can say with 95% confidence that the error attributable to sampling has a maximum margin of plus or minus 5.2 percentage points (unadjusted for sample design). Sampling error can be larger for sub-groups (see table below). In addition to sampling error, one should bear in mind that question wording and practical difficulties in conducting surveys can introduce error or bias into the findings of opinion polls.
| DEMOGRAPHICS (weighted) |
|
Party Registration |
| 28% Republican |
| 56% Democrat |
| 17% Neither |
|
Self-Reported Party ID |
| 34% Republican |
| 31% Independent |
| 35% Democrat |
| 50% Male |
| 50% Female |
|
9% 18-34 |
| 16% 35-49 |
| 33% 50-64 |
| 42% 65+ |
| 92% White |
|
8% Other |
| 78% No college degree |
|
22% 4-year college degree |
| 52% West region |
| 21% Mercer/Raleigh |
| 26% East region |
Click on pdf file link below for full methodology and results by key demographic groups.