West Long Branch, NJ – With two weeks to go before Election Day, Democrat Terry McAuliffe and Republican Glenn Youngkin are locked in a close battle for governor of Virginia. The last Monmouth (“Mon-muth”) University Poll of the race before the election marks a gain for the GOP candidate from prior polls. Youngkin’s improved position comes from a widening partisan gap in voter engagement and a shift in voters’ issue priorities, particularly around schools and the pandemic.
Youngkin (46%) and McAuliffe (46%) hold identical levels of support among all registered voters. This marks a shift from prior Monmouth polls where the Democrat held a 5-point lead (48% to 43% in September and 47% to 42% in August). A range of probabilistic likely electorate models* shows a potential outcome – if the election was held today – of anywhere from a 3-point lead for McAuliffe (48% to 45%) to a 3-point lead for Youngkin (48% to 45%). This is the first time the Republican has held a lead in Monmouth polls this cycle. All prior models gave the Democrat a lead (ranging from 2 to 7 points). A traditional “cut-off” model similar to what Monmouth used in elections prior to the 2018 midterm – which includes registered voters who cast a ballot in at least 2 of the last 4 general elections and report being “certain” or “likely” to vote, or have already voted – shows a close contest with 48% for McAuliffe and 46% for Youngkin.
The biggest swing in support from Monmouth’s last poll comes from independent voters, registering a 48% to 39% lead for Youngkin now compared with a 37% to 46% deficit in September. Youngkin has also cut into McAuliffe’s advantage with women voters. The Democrat currently has a narrow edge among women (47% to 43%), down from a sizable 14-point lead last month (52% to 38%).
Youngkin has increased his support in the reddest part of the commonwealth, western Virginia, where he currently leads McAuliffe by 66% to 27% (up from 58% to 34% in September). At the same time, McAuliffe has slipped slightly in heavily-blue Northern Virginia. He leads there by 58% to 34%. This is down only slightly from his 58% to 29% lead last month, however, incumbent Democratic Gov. Ralph Northam won this key region by 35 points (67% to 32%) in 2017. McAuliffe holds small leads in both the eastern Tidewater (48% to 42%) and central I-95/Richmond (48% to 41%) areas.
“Suburban women, especially in Northern Virginia, have been crucial to the sizable victories Democrats have enjoyed in the commonwealth since 2017. However, their support is not registering at the same level this time around. This is due partly to a shift in key issues important to these voters and partly to dampened enthusiasm among the party faithful,” said Patrick Murray, director of the independent Monmouth University Polling Institute.
| VIRGINIA: ELECTORATE SCENARIOS | ||||
| Governor vote choice: | Registered voters | Range of electorate models | ||
| October | ||||
| McAuliffe | 46% | 45% | 48% | |
| Youngkin | 46% | 48% | 45% | |
| September | ||||
| McAuliffe | 48% | 48% | 50% | |
| Youngkin | 43% | 45% | 43% | |
| August | ||||
| McAuliffe | 47% | 47% | 49% | |
| Youngkin | 42% | 45% | 42% | |
| Source: Monmouth University Poll Oct. 16-19, 2021 | ||||
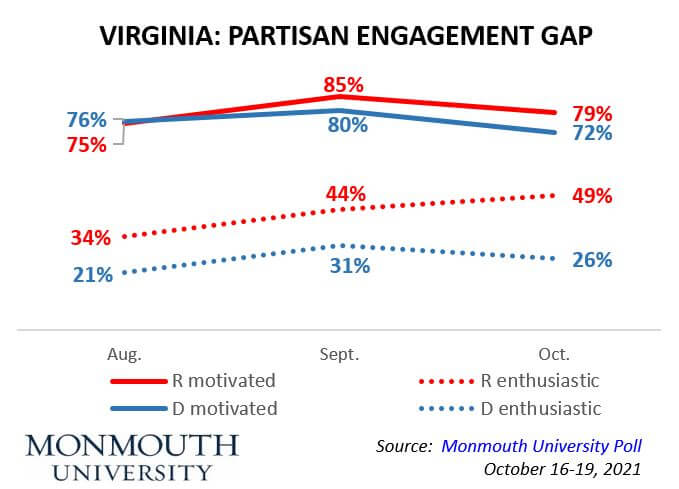
Voter engagement metrics among all registered voters have been fairly stable over the past three months – 74% are very motivated and 34% are more enthusiastic about this election than usual. But the overall stability masks a widening partisan gap. In August, similar numbers of Republicans (75%) and Democrats (76%) said they were very motivated to vote this year. That grew to a 5-point GOP advantage in September (85% to 80%) and has creeped up to a 7-point advantage in the current poll (79% to 72%).
Voter enthusiasm shows an even wider disparity. This metric stood at a 13-point Republican advantage in prior polls – 34% GOP to 21% Democrat in August and 44% to 31% in September. That disparity has grown to a 23-point chasm in the current poll – 49% GOP to 26% Democrat.
Looking at the national picture, President Joe Biden gets a negative 43% approve and 52% disapprove rating from Virginia voters, which is down from his 46% to 49% rating in August. Northam gets a 46% approve and 42% disapprove rating for his performance as governor, which is comparable to his 48% to 42% rating in August.
“Motivation tends to be a better indication of turnout than self-reported enthusiasm. The gridlock in Washington certainly plays a role in dampening Democrats’ mood, but there are some stumbles on the part of the McAuliffe campaign that have also had an impact. Either way, this voter engagement gap is good news for Youngkin,” said Murray.
The Monmouth poll finds that a recent shift in voter issue priorities has helped Youngkin. The top issues chosen as the most important first or second factor in Virginians’ vote for governor are jobs and the economy (45%, up from 39% in September) and education and schools (41%, up from 31%). Just 23% name the Covid pandemic as one of their top two issues, which is a drop from 32% last month.
Youngkin has drawn even with McAuliffe on being trusted more to handle education and schools (39% to 38%). He trailed the Democrat on this issue in September (33% to 37%) and August (31% to 36%). The Republican now holds a small trust advantage on jobs and the economy – 39% to 34% who trust McAuliffe more. The Virginia electorate was more evenly split on this issue in prior polls (36% Youngkin to 35% McAuliffe in September and 35% to 33% in August). Youngkin has also widened his advantage on handling taxes (40% to 30%) and has drawn even with McAuliffe on handling the abortion issue (33% Youngkin to 35% McAuliffe).
At the same time, McAuliffe’s sizable advantage on handling the pandemic has shrunk. He now holds a 37% to 31% edge over Youngkin on being trusted more to handle Covid policies. This issue was a bigger winner for him in prior polls (41% to 28% in September and 38% to 26% in August).
“McAuliffe’s sizable edge on handling Covid and his competitiveness on economic issues last month helped put him ahead in this race, but Youngkin has been able to change the terms of the debate, by using his opponent’s words on parental involvement in the school curriculum to shift voter attention on that issue. Not only has this eaten away at the Democrat’s previous advantage on education policy, but it has also raised doubts about McAuliffe’s ability to handle the pandemic,” said Murray.
Youngkin currently earns a better personal rating – 41% favorable to 29% unfavorable – than McAuliffe does – 39% favorable to 39% unfavorable. The Republican’s numbers are similar to his rating last month (40% to 31%), while the Democrat’s numbers have worsened since September (40% to 33%).
“To counter his own growing negatives, McAuliffe launched a series of ads painting Youngkin as an extremist while this poll was in the field. It’s not clear whether this blitz will move the needle, but the Democrat needs it to do just that if he wants to return to Richmond,” said Murray.
The Monmouth University Poll was conducted by telephone from October 16 to 19, 2021 with 1,005 Virginia registered voters. The question results in this release have a margin of error of +/- 3.1 percentage points. The poll was conducted by the Monmouth University Polling Institute in West Long Branch, NJ.
* Monmouth’s electorate models for the 2021 election are not forecasts. They are designed to present a range of reasonable outcomes based on voter intentions at this moment. Monmouth tests a variety of models where each registered voter is assigned a probabilistic weight between 0 and 1, based primarily on past voting history, with adjustments for self-reported likelihood to vote, motivation and other factors. Further adjustments are applied to the aggregate sample based on turnout propensities among different demographic groups (e.g. by race, gender, education). The two scenarios included in this report show the extreme ends of the range of possible outcomes from the model testing.
QUESTIONS AND RESULTS
(* Some columns may not add to 100% due to rounding.)
[Note: Voters who report already casting their ballots were asked, “In the election for X, did you vote for…” for Q1 and Q2.]
1.If the election for Governor was today, would you vote for Glenn Youngkin the Republican, Terry McAuliffe the Democrat, or some other candidate? [NAMES WERE ROTATED] [If UNDECIDED: If you had to vote for one of the following candidates at this moment, who do you lean toward – Glenn Youngkin or Terry McAuliffe?]
| TREND: REGISTERED VOTERS (with leaners) | Oct. 2021 | Sept. 2021 | Aug. 2021 |
| Glenn Youngkin | 46% | 43% | 42% |
| Terry McAuliffe | 46% | 48% | 47% |
| Other candidate | 2% | 2% | 2% |
| (VOL) No one | <1% | 1% | <1% |
| (VOL) Undecided | 7% | 7% | 9% |
| (n) | (1,005) | (801) | (802) |
2.If the election for the Virginia House of Delegates was held today, would you vote for the Republican or the Democratic candidate in your legislative district? [PARTIES WERE ROTATED] [If UNDECIDED: At this time do you lean more toward the Republican or more toward the Democratic candidate?]
| TREND: REGISTERED VOTERS (with leaners) | Oct. 2021 | Aug. 2021 |
| Republican | 46% | 45% |
| Democratic | 46% | 48% |
| (VOL) Other candidate | <1% | <1% |
| (VOL) No one | <1% | <1% |
| (VOL) Undecided | 8% | 7% |
| (n) | (1,005) | (802) |
[QUESTIONS 3A & 3B WERE ROTATED]
3A.Is your general impression of Glenn Youngkin very favorable, somewhat favorable, somewhat unfavorable, or very unfavorable, or do you have no opinion?
| TREND: REGISTERED VOTERS | Oct. 2021 | Sept. 2021 | Aug. 2021 |
| Very favorable | 23% | 22% | 18% |
| Somewhat favorable | 18% | 18% | 19% |
| Somewhat unfavorable | 10% | 11% | 9% |
| Very unfavorable | 19% | 20% | 18% |
| No opinion | 29% | 28% | 35% |
| (n) | (1,005) | (801) | (802) |
3B.Is your general impression of Terry McAuliffe very favorable, somewhat favorable, somewhat unfavorable, or very unfavorable, or do you have no opinion?
| TREND: REGISTERED VOTERS | Oct. 2021 | Sept. 2021 | Aug. 2021 |
| Very favorable | 17% | 21% | 20% |
| Somewhat favorable | 22% | 19% | 19% |
| Somewhat unfavorable | 10% | 9% | 12% |
| Very unfavorable | 29% | 24% | 23% |
| No opinion | 23% | 27% | 27% |
| (n) | (1,005) | (801) | (802) |
4.Which one of the following issues is most important to you in deciding your vote for governor? Which is the second most important? [ITEMS WERE ROTATED]
| REGISTERED VOTERS | FIRST CHOICE | SECOND CHOICE | COMBINED | TREND: | Sept. 2021 1st CHOICE | Sept. 2021 2nd CHOICE | Sept. 2021 COMBINED |
| The Covid pandemic | 11% | 12% | 23% | 18% | 14% | 32% | |
| Jobs and the economy | 27% | 18% | 45% | 21% | 18% | 39% | |
| Taxes | 9% | 10% | 19% | 9% | 11% | 20% | |
| Education and schools | 21% | 20% | 41% | 14% | 17% | 31% | |
| Race relations | 6% | 7% | 13% | 7% | 10% | 17% | |
| Police issues | 5% | 11% | 16% | 9% | 11% | 20% | |
| Abortion | 10% | 7% | 17% | 11% | 9% | 20% | |
| (VOL) Other, none of these | 10% | — | 10% | 7% | — | 7% | |
| (VOL) No answer | 2% | — | 2% | 2% | — | 2% | |
| (n) | (1,005) | (1,005) | (1,005) | (801) | (801) | (801) |
[QUESTIONS 5-11 WERE ROTATED]
5.Who do you trust more on handling the Covid pandemic – Glenn Youngkin or Terry McAuliffe, or both equally? [NAMES WERE ROTATED]
| TREND: REGISTERED VOTERS | Oct. 2021 | Sept. 2021 | Aug. 2021 |
| Glenn Youngkin | 31% | 28% | 26% |
| Terry McAuliffe | 37% | 41% | 38% |
| Both equally | 22% | 18% | 21% |
| (VOL) Neither | 5% | 5% | 7% |
| (VOL) Don’t know | 5% | 7% | 8% |
| (n) | (1,005) | (801) | (802) |
6.Who do you trust more on jobs and the economy – Glenn Youngkin or Terry McAuliffe, or both equally? [NAMES WERE ROTATED]
| TREND: REGISTERED VOTERS | Oct. 2021 | Sept. 2021 | Aug. 2021 |
| Glenn Youngkin | 39% | 36% | 35% |
| Terry McAuliffe | 34% | 35% | 33% |
| Both equally | 19% | 20% | 21% |
| (VOL) Neither | 3% | 3% | 3% |
| (VOL) Don’t know | 5% | 6% | 8% |
| (n) | (1,005) | (801) | (802) |
7.Who do you trust more on race relations issues – Glenn Youngkin or Terry McAuliffe, or both equally? [NAMES WERE ROTATED]
| TREND: REGISTERED VOTERS | Oct. 2021 | Sept. 2021 | Aug. 2021* |
| Glenn Youngkin | 29% | 28% | 26% |
| Terry McAuliffe | 37% | 39% | 35% |
| Both equally | 23% | 20% | 23% |
| (VOL) Neither | 4% | 5% | 6% |
| (VOL) Don’t know | 7% | 7% | 10% |
| (n) | (1,005) | (801) | (802) |
* August 2021 poll asked “Who do you trust more on race issues….”
8.Who do you trust more on education and schools – Glenn Youngkin or Terry McAuliffe, or both equally? [NAMES WERE ROTATED]
| TREND: REGISTERED VOTERS | Oct. 2021 | Sept. 2021 | Aug. 2021 |
| Glenn Youngkin | 39% | 33% | 31% |
| Terry McAuliffe | 38% | 37% | 36% |
| Both equally | 17% | 21% | 21% |
| (VOL) Neither | 3% | 3% | 5% |
| (VOL) Don’t know | 4% | 6% | 8% |
| (n) | (1,005) | (801) | (802) |
9.Who do you trust more on issues involving the police and law enforcement – Glenn Youngkin or Terry McAuliffe, or both equally? [NAMES WERE ROTATED]
| TREND: REGISTERED VOTERS | Oct. 2021 | Sept. 2021 |
| Glenn Youngkin | 39% | 39% |
| Terry McAuliffe | 34% | 33% |
| Both equally | 19% | 17% |
| (VOL) Neither | 4% | 5% |
| (VOL) Don’t know | 5% | 6% |
| (n) | (1,005) | (801) |
10.Who do you trust more on the issue of abortion – Glenn Youngkin or Terry McAuliffe, or both equally? [NAMES WERE ROTATED]
| TREND: REGISTERED VOTERS | Oct. 2021 | Sept. 2021 |
| Glenn Youngkin | 33% | 32% |
| Terry McAuliffe | 35% | 40% |
| Both equally | 15% | 14% |
| (VOL) Neither | 6% | 4% |
| (VOL) Don’t know | 10% | 10% |
| (n) | (1,005) | (801) |
11.Who do you trust more on taxes – Glenn Youngkin or Terry McAuliffe, or both equally? [NAMES WERE ROTATED]
| TREND: REGISTERED VOTERS | Oct. 2021 | Sept. 2021 |
| Glenn Youngkin | 40% | 37% |
| Terry McAuliffe | 30% | 33% |
| Both equally | 19% | 20% |
| (VOL) Neither | 5% | 4% |
| (VOL) Don’t know | 5% | 6% |
| (n) | (1,005) | (801) |
[QUESTIONS 12 & 13 WERE ROTATED]
12.Are Glenn Youngkin’s political views in line or out of step with most Virginians, or are you not sure?
| TREND: REGISTERED VOTERS | Oct. 2021 | Sept. 2021 | Aug. 2021 |
| In line | 26% | 24% | 22% |
| Out of step | 22% | 25% | 23% |
| Not sure | 52% | 51% | 55% |
| (n) | (1,005) | (801) | (802) |
13.Are Terry McAuliffe’s political views in line or out of step with most Virginians, or are you not sure?
| TREND: REGISTERED VOTERS | Oct. 2021 | Sept. 2021 | Aug. 2021 |
| In line | 24% | 29% | 29% |
| Out of step | 26% | 24% | 21% |
| Not sure | 51% | 48% | 50% |
| (n) | (1,005) | (801) | (802) |
14.Do you approve or disapprove of the job Ralph Northam is doing as governor?
| TREND: REGISTERED VOTERS | Oct. 2021 | Aug. 2021 |
| Approve | 46% | 48% |
| Disapprove | 42% | 42% |
| (VOL) No opinion | 12% | 9% |
| (n) | (1,005) | (802) |
15.Do you approve or disapprove of the job Joe Biden is doing as president?
| TREND: REGISTERED VOTERS | Oct. 2021 | Aug. 2021 |
| Approve | 43% | 46% |
| Disapprove | 52% | 49% |
| (VOL) No opinion | 5% | 5% |
| (n) | (1,005) | (802) |
16.How will you vote this year – in person on Election Day, in person at an early voting location, or by mail ballot? [If ALREADY VOTED: How did you vote this year…?]
| TREND: REGISTERED VOTERS | Oct. 2021 | Sept. 2021 | Aug. 2021 |
| In person on Election Day | 58% | 57% | 62% |
| In person at an early voting location | 19% | 24% | 20% |
| By mail ballot | 7% | 9% | 13% |
| Already voted in person | 9% | 3% | n/a |
| Already voted by mail | 4% | 2% | n/a |
| (VOL) Won’t vote at all | 1% | 1% | 1% |
| (VOL) Don’t know | 2% | 4% | 5% |
| (n) | (1,005) | (801) | (802) |
17.How motivated are you to vote in the election for governor – very motivated, somewhat motivated, or not that motivated?
| TREND: REGISTERED VOTERS | Oct. 2021 | Sept. 2021 | Aug. 2021 |
| Very motivated | 74% | 76% | 74% |
| Somewhat motivated | 20% | 16% | 20% |
| Not that motivated | 6% | 8% | 5% |
| (VOL) Don’t know | 0% | 1% | 1% |
| (n) | (1,005) | (801) | (802) |
18.Compared to past elections for governor, are you more enthusiastic than usual, less enthusiastic, or about the same as past elections?
| TREND: REGISTERED VOTERS | Oct. 2021 | Sept. 2021 | Aug. 2021 |
| More enthusiastic | 34% | 33% | 26% |
| Less enthusiastic | 10% | 8% | 8% |
| About the same | 55% | 57% | 63% |
| (VOL) Don’t know | 1% | 2% | 2% |
| (n) | (1,005) | (801) | (802) |
METHODOLOGY
The Monmouth University Poll was sponsored and conducted by the Monmouth University Polling Institute from October 16 to 19, 2021 with a statewide random sample of 1,005 Virginia voters drawn from a list of registered voters. This includes 283 contacted by a live interviewer on a landline telephone and 722 contacted by a live interviewer on a cell phone, in English. Monmouth is responsible for all aspects of the survey design, data weighting and analysis. The full sample is weighted for party primary voting history, age, gender, race, education, and region based on state voter registration list information and U.S. Census information (CPS 2018 supplement). Data collection support provided by Braun Research (field) and Aristotle (voter sample). For results based on the full voter sample, one can say with 95% confidence that the error attributable to sampling has a maximum margin of plus or minus 3.1 percentage points (unadjusted for sample design). Sampling error can be larger for sub-groups (see table below). In addition to sampling error, one should bear in mind that question wording and practical difficulties in conducting surveys can introduce error or bias into the findings of opinion polls.
VA Regions:
NoVa – Loudon, Fairfax, Arlington, and Prince William counties and included cities.
Tidewater – counties and cities along the Chesapeake Bay and tributary rivers (James, York, Rappahannock), including Hampton Roads, Virginia Beach, Newport News and Norfolk.
Richmond/I-95 – counties and cities that straddle either side of I-95, including Richmond.
West – the area west of a north-south line from Clarke/Fauquier to Mecklenburg counties.
| DEMOGRAPHICS (weighted) |
| REGISTERED VOTERS |
| Self-Reported Party ID |
| 30% Republican |
| 37% Independent |
| 33% Democrat |
| 48% Male |
| 52% Female |
| 21% 18-34 |
| 26% 35-49 |
| 29% 50-64 |
| 24% 65+ |
| 67% White, non-Hispanic |
| 20% Black |
| 5% Hispanic |
| 8% Asian/Other |
| 59% No degree |
| 41% 4 year degree |
Click on pdf file link below for full methodology and crosstabs by key demographic groups.