West Long Branch, NJ – A majority of Americans say they feel “worn out” by how Covid has impacted their daily lives, and nearly half feel “angry” about it. And the public’s exasperation may also be having an impact on how they view their political leaders’ handling of the pandemic, according to the latest Monmouth (“Mon-muth”) University Poll. Support for face mask and workplace vaccine mandates has also declined since the fall when the delta variant started to dominate.
Six in ten Americans feel worn out by pandemic-related changes they have had to make to their daily lives over the past 20 months. This includes 36% who feel worn out a lot and 24% who feel worn out a little. The poll also finds that nearly half of the public feels angry about how Covid has impacted their daily lives – 24% a lot and 21% a little. Republicans (64%) are no more likely than Democrats (63%) to say they feel at least a little worn out by pandemic-related changes to their lives, but they are much more likely to report feeling angry (63% and 34%, respectively).
Looking at both feelings simultaneously, just over one-third (36%) of the country reports being both worn out and angry. Another 25% feels worn out but not angry and 9% feels angry but not worn out, while 30% say they don’t feel either way about Covid-driven changes to their daily lives. Other than partisan-related variations in these results, there are few significant demographic differences in reports of being either worn out or angry due to the pandemic. However, adults under 55 years old (74%) are somewhat more likely than those aged 55 and older (63%) to say that they feel either or both of these negative emotions.
“The fact that Americans say they have had enough should be no surprise. Every time we try to adjust to a new normal, another variant pops up to put us on guard again. This perpetual unease is having an impact on how we view those charged with handling the pandemic,” said Patrick Murray, director of the independent Monmouth University Polling Institute.
The American public is now split on whether President Joe Biden has done a good job (46%) or bad job (46%) handling the pandemic. Prior to this poll, though, Biden’s ratings on the pandemic had consistently been in net positive territory including as recently as last month (53% good and 41% bad). Positive ratings for how Biden is handling the pandemic has dropped more among independents (from 50% in November to 38% now) than it has among either Republicans (from 16% to 10%) or Democrats (from 90% to 88%). Also noteworthy is that this decline has occurred mainly in states Biden won in 2020 (from 60% in these states last month saying he has done a good job to 47% now). Opinion of Biden’s performance in the states he lost is stable (from 44% good job in November to 45% in December).
“We just came out of an off-year election in Virginia and New Jersey where blue states did not look so blue. The failure to get Covid under control may be playing a role there, especially for independent voters, in a growing sense of frustration with the party in power,” said Murray.
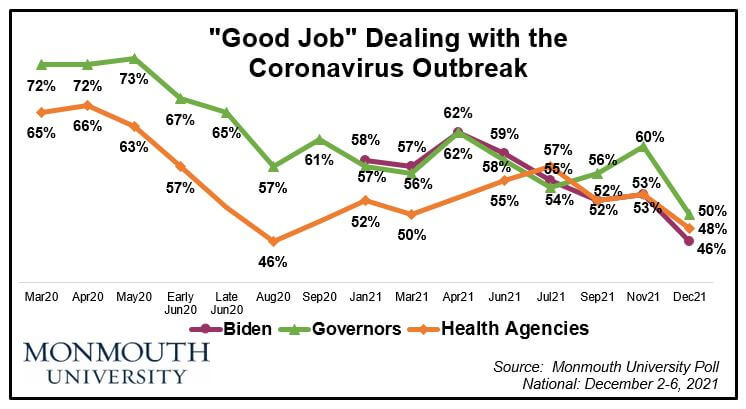
Ratings for state governors have ticked down as well (to 50% good job and 41% bad job, compared with 60% good and 35% bad in November). In states Biden won, positive governor ratings have dropped from 61% to 49%. In states he lost, they dropped from 58% to 52%. Ratings for how federal health agencies have dealt with the pandemic (48% good job and 41% bad job) remain positive, but have also slipped (53% good and 38% bad in November). Opinion on how the American public is dealing with the pandemic remains largely negative at 27% good job and 56% bad job (35% and 55%, respectively, in November).
The Monmouth University Poll also finds that Americans’ support for instituting, or reinstituting, face mask and social distancing guidelines in their state, which went up from 52% in July to 63% in September as the delta variant spread, has gone back down to 55%. Support for requiring people to show proof of vaccination in order to work in an office or other setting where they are around people has gone from a slight majority in September (53%) to a minority now (46%).
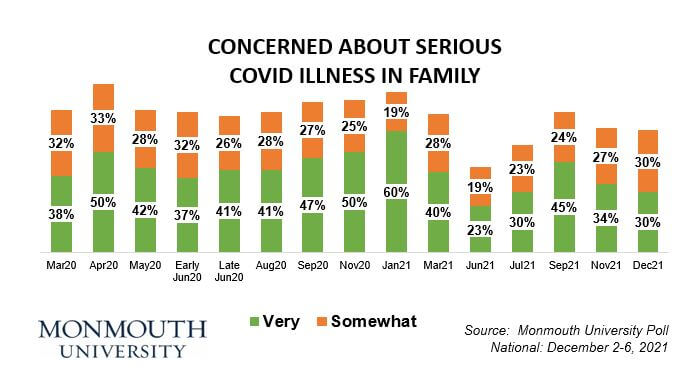
The number of people who are very concerned about a family member becoming seriously ill from the virus (30%) is the same as it was in July (30%), when cases were at a low ebb. This level of concern rose to 45% in September as the delta variant spread. Just under half are concerned – 14% very and 32% somewhat – about them personally catching one of the new Covid variants. These results are similar to the July poll (the question was not asked in September). Concern about catching a new variant is somewhat higher among those who have already received a booster shot (66%) than among those who are vaccinated without a booster (51%) – with the caveat that the booster cohort is older than the non-booster vaccine group. However, both of these vaccinated groups are much more concerned about infection from a new variant than those who have not been vaccinated at all (12%).
“Public health officials say we need to reach a certain level of herd immunity before this virus shifts from a pandemic to an endemic problem. Based on months of survey results, this transition is likely to take longer than necessary because a small but significant portion of the public simply won’t acknowledge the risk,” said Murray.
The Monmouth University Poll was conducted by telephone from December 2 to 6, 2021 with 808 adults in the United States. The question results in this release have a margin of error of +/- 3.5 percentage points. The poll was conducted by the Monmouth University Polling Institute in West Long Branch, NJ.
QUESTIONS AND RESULTS
(* Some columns may not add to 100% due to rounding.)
[Q1-11 previously released.]
12.How concerned are you about someone in your family becoming seriously ill from the coronavirus outbreak – very concerned, somewhat concerned, not too concerned, or not at all concerned?
| TREND: | Dec. 2021 | Nov. 2021 | Sept. 2021 | July 2021 | June 2021 | March 2021 | Jan. 2021 | Nov. 2020 | Early Sept. 2020 | Aug. 2020 | Late June 2020 | Early June 2020 | May 2020 | April 2020 | March 2020 |
| Very concerned | 30% | 34% | 45% | 30% | 23% | 40% | 60% | 50% | 47% | 41% | 41% | 37% | 42% | 50% | 38% |
| Somewhat concerned | 30% | 27% | 24% | 23% | 19% | 28% | 19% | 25% | 27% | 28% | 26% | 32% | 28% | 33% | 32% |
| Not too concerned | 20% | 22% | 17% | 21% | 24% | 14% | 12% | 13% | 13% | 18% | 17% | 14% | 14% | 9% | 18% |
| Not at all concerned | 19% | 15% | 12% | 24% | 32% | 16% | 7% | 10% | 12% | 13% | 15% | 16% | 16% | 7% | 12% |
| (VOL) Don’t know | 0% | 1% | 1% | 0% | 1% | 0% | 0% | 0% | 0% | 0% | 0% | 0% | 0% | 0% | 0% |
| (VOL) Has already happened | 1% | 1% | 1% | 2% | 1% | 2% | 2% | 1% | 0% | 1% | 1% | 0% | 0% | 0% | n/a |
| (n) | (808) | (811) | (802) | (804) | (810) | (802) | (809) | (810) | (867) | (868) | (867) | (807) | (808) | (857) | (851) |
13.Please tell me if each of the following has done a good job or bad job dealing with the coronavirus outbreak. [ITEMS WERE ROTATED]
| TREND: | Good Job | Bad Job | (VOL) Mixed, depends | (VOL) Don’t know | (n) |
| President Biden | 46% | 46% | 4% | 4% | (808) |
| — November 2021 | 53% | 41% | 2% | 3% | (811) |
| — September 2021 | 52% | 43% | 4% | 1% | (802) |
| — July 2021 | 55% | 38% | 4% | 3% | (804) |
| — June 2021 | 59% | 32% | 4% | 5% | (810) |
| — April 2021 | 62% | 31% | 3% | 3% | (800) |
| — March 2021 | 57% | 31% | 3% | 8% | (802) |
| — January 2021 | 58% | 23% | 5% | 15% | (809) |
| Your state’s governor | 50% | 41% | 5% | 3% | (808) |
| — November 2021 | 60% | 35% | 3% | 3% | (811) |
| — September 2021 | 56% | 38% | 3% | 3% | (802) |
| — July 2021 | 54% | 42% | 3% | 2% | (804) |
| — June 2021 | 58% | 33% | 5% | 4% | (810) |
| — April 2021 | 62% | 34% | 3% | 2% | (800) |
| — March 2021 | 56% | 38% | 3% | 2% | (802) |
| — January 2021 | 57% | 38% | 3% | 2% | (809) |
| — Early September 2020 | 61% | 35% | 3% | 1% | (867) |
| — August 2020 | 57% | 35% | 5% | 3% | (868) |
| — Late June 2020 | 65% | 28% | 5% | 2% | (867) |
| — Early June 2020 | 67% | 28% | 3% | 1% | (807) |
| — May 2020 | 73% | 22% | 3% | 2% | (808) |
| — April 2020 | 72% | 21% | 4% | 3% | (857) |
| — March 2020 | 72% | 18% | 4% | 6% | (851) |
| The American public | 27% | 56% | 12% | 5% | (808) |
| — November 2021 | 35% | 55% | 7% | 3% | (811) |
| — September 2021 | 23% | 65% | 10% | 2% | (802) |
| — July 2021 | 32% | 51% | 12% | 5% | (804) |
| — June 2021 | 42% | 40% | 14% | 4% | (810) |
| — April 2021 | 43% | 44% | 10% | 4% | (800) |
| — March 2021 | 35% | 53% | 11% | 1% | (802) |
| — January 2021 | 32% | 60% | 6% | 2% | (809) |
| — Early September 2020 | 31% | 57% | 10% | 2% | (867) |
| — August 2020 | 26% | 62% | 11% | 1% | (868) |
| — Late June 2020 | 28% | 59% | 11% | 3% | (867) |
| — Early June 2020 | 46% | 43% | 8% | 2% | (807) |
| — May 2020 | 51% | 33% | 13% | 2% | (808) |
| — April 2020 | 38% | 48% | 12% | 2% | (857) |
| — March 2020 | 38% | 45% | 14% | 3% | (851) |
| Health agencies in the federal government | 48% | 41% | 6% | 5% | (808) |
| — November 2021 | 53% | 38% | 5% | 4% | (811) |
| — September 2021 | 52% | 38% | 6% | 3% | (802) |
| — July 2021 | 57% | 33% | 7% | 3% | (804) |
| — June 2021 | 55% | 33% | 6% | 5% | (810) |
| — April 2021 | n/a | n/a | n/a | n/a | n/a |
| — March 2021 | 50% | 37% | 8% | 5% | (802) |
| — January 2021 | 52% | 40% | 6% | 3% | (809) |
| — Early September 2020 | n/a | n/a | n/a | n/a | n/a |
| — August 2020 | 46% | 43% | 6% | 4% | (868) |
| — Late June 2020 | n/a | n/a | n/a | n/a | n/a |
| — Early June 2020 | 57% | 34% | 5% | 3% | (807) |
| — May 2020 | 63% | 25% | 7% | 4% | (808) |
| — April 2020 | 66% | 25% | 4% | 4% | (857) |
| — March 2020 | 65% | 24% | 8% | 4% | (851) |
14.Do you support or oppose instituting, or reinstituting, face mask and social distancing guidelines in your state at the current time?
| TREND: | Dec. 2021 | Sept. 2021 | July 2021 |
| Support | 55% | 63% | 52% |
| Oppose | 42% | 34% | 46% |
| (VOL) Depends | 2% | 2% | n/a |
| (VOL) Don’t know | 2% | 1% | 2% |
| (n) | (808) | (802) | (804) |
14A.Do you support or oppose requiring people to show proof of vaccination in order to go to work in an office or setting where they are around other people?
| TREND: | Dec. 2021 | Nov. 2021 | Sept. 2021 |
| Support | 46% | 51% | 53% |
| Oppose | 50% | 47% | 45% |
| (VOL) Depends | 2% | 2% | 2% |
| (VOL) Don’t know | 2% | 1% | 1% |
| (n) | (808) | (811) | (802) |
[QUESTIONS 15-16 WERE ROTATED]
15.When you think of the last 20 months of the pandemic and any changes you have had to make to your daily life, do you ever feel angry about it, or not? [If YES: Do you feel angry a lot or a little?]
| Dec. 2021 | |
| Yes, a lot | 24% |
| Yes, a little | 21% |
| No | 55% |
| (VOL) Don’t know | 0% |
| (n) | (808) |
16.When you think of the last 20 months of the pandemic and any changes you have had to make to your daily life, do you ever feel worn out about it, or not? [If YES: Do you feel worn out a lot or a little?]
| Dec. 2021 | |
| Yes, a lot | 36% |
| Yes, a little | 24% |
| No | 39% |
| (VOL) Don’t know | 0% |
| (n) | (808) |
17.Have you received at least one dose of Covid vaccine, or not?[If NOT:] Do you plan to get the Covid vaccine as soon as possible, will you continue to let other people get it first to see how it goes, or is it likely you will never get the vaccine if you can avoid it?
| TREND: | Dec. 2021 | Nov. 2021 | Sept. 2021 | July 2021 | June 2021 | April 2021 | March 2021 | Jan. 2021 |
| Already received vaccine | 78% | 80% | 75% | 68% | 66% | 51% | 16%* | 6%* |
| As soon as possible | 0% | 1% | 2% | 2% | 2% | 14% | 38% | 50% |
| See how it goes | 5% | 4% | 6% | 9% | 9% | 12% | 21% | 19% |
| Likely will never get vaccine | 14% | 13% | 15% | 17% | 21% | 21% | 24% | 24% |
| (VOL) Don’t know | 3% | 3% | 2% | 4% | 2% | 2% | 1% | 2% |
| (n) | (808) | (811) | (802) | (804) | (810) | (800) | (802) | (809) |
* January/March 2021 polls did not specifically ask if person already got the vaccine, but included it as a volunteered response.
18.Have you received a booster shot of the Covid vaccine, or not? [If NOT:] How likely are you to get a booster shot of the vaccine – very likely, somewhat likely, not too likely, or not at all likely?
| TREND: | Dec. 2021 | Nov. 2021 | Sept. 2021** |
| Already received booster | 24% | 10%* | 1%* |
| Very likely | 27% | 41% | 51% |
| Somewhat likely | 13% | 14% | 16% |
| Not too likely | 6% | 8% | 6% |
| Not at all likely | 10% | 9% | 9% |
| (VOL) Don’t know | 1% | 2% | 1% |
| Likely will never get vaccine (from Q17) | 17% | 16% | 17% |
| (n) | (808) | (811) | (802) |
* September/November 2021 polls did not specifically ask if person already got the booster, but included it as a volunteered response.
** September 2021 question included “…if it is made available.”
19.How concerned are you personally about catching one of the new variants of the Covid virus – very concerned, somewhat concerned, not too concerned, or not at all concerned?
| TREND: | Dec. 2021 | July 2021 |
| Very concerned | 14% | 18% |
| Somewhat concerned | 32% | 30% |
| Not too concerned | 31% | 24% |
| Not at all concerned | 22% | 28% |
| (VOL) Don’t know | 1% | 0% |
| (VOL) Has already happened | 1% | 0% |
| (n) | (808) | (804) |
[Q20-28 previously released.]
METHODOLOGY
The Monmouth University Poll was sponsored and conducted by the Monmouth University Polling Institute from December 2 to 6, 2021 with a probability-based national random sample of 808 adults age 18 and older. This includes 285 contacted by a live interviewer on a landline telephone and 523 contacted by a live interviewer on a cell phone, in English. Telephone numbers were selected through a mix of random digit dialing and list-based sampling. Landline respondents were selected with a modified Troldahl-Carter youngest adult household screen. Interviewing services were provided by Braun Research, with sample obtained from Dynata (RDD, n=457), Aristotle (list, n=150) and a panel of prior Monmouth poll participants (n=201). Monmouth is responsible for all aspects of the survey design, data weighting and analysis. The full sample is weighted for region, age, education, gender and race based on US Census information (ACS 2018 one-year survey). For results based on this sample, one can say with 95% confidence that the error attributable to sampling has a maximum margin of plus or minus 3.5 percentage points (unadjusted for sample design). Sampling error can be larger for sub-groups (see table below). In addition to sampling error, one should bear in mind that question wording and practical difficulties in conducting surveys can introduce error or bias into the findings of opinion polls.
| DEMOGRAPHICS (weighted) |
| Self-Reported |
| 26% Republican |
| 44% Independent |
| 30% Democrat |
| 49% Male |
| 51% Female |
| 31% 18-34 |
| 33% 35-54 |
| 36% 55+ |
| 62% White |
| 12% Black |
| 17% Hispanic |
| 8% Asian/Other |
| 68% No degree |
| 32% 4 year degree |
Click on pdf file link below for full methodology and crosstabs by key demographic groups.


