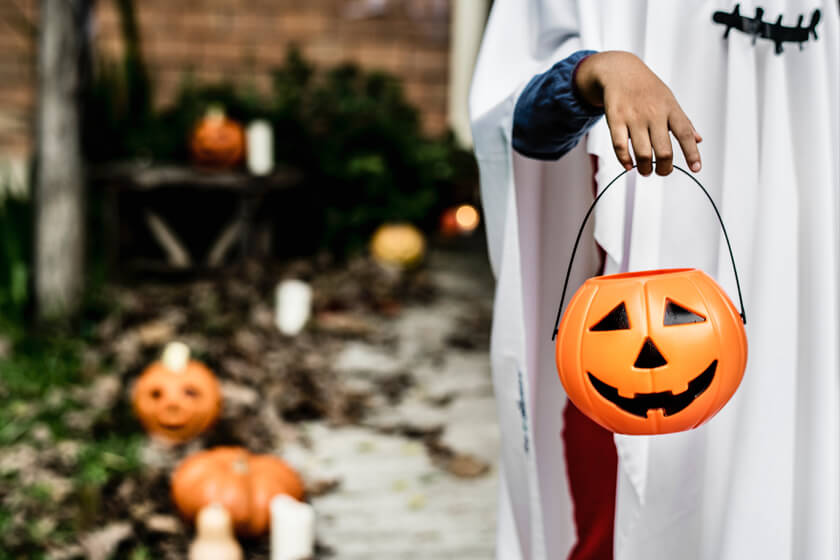
West Long Branch, NJ – The Monmouth University Poll finds that about half the American public loves Halloween and half does not. Most parents say their kids will be trick-or-treating this year, but not without an adult chaperone – even the teenagers. Just under one-third of adults will also be donning a Halloween costume, but one with blackface makeup is a definite no-no. The poll also finds the nation’s most popular candy is a runaway favorite.
Almost 1-in-10 Americans (8%) say that Halloween is their favorite holiday of the year and another 37% say it is one of their favorite holidays. A slight majority (53%), though, say it is not a favorite holiday for them. Younger adults aged 18 to 34 years old (58%) are the most likely to rank Halloween as among their favorite holidays, while those aged 55 and older (32%) are the least likely. People aged 35 to 54 years old (48%) fall in between those two groups. Hispanic (53%) and white Americans (46%) are more likely than black Americans (28%) to rate Halloween as a favorite holiday.
“It’s a split decision on Halloween. Nearly half the country ranks it up there with their top holidays while the other half could do without it,” said Patrick Murray, director of the independent Monmouth University Polling Institute.
Halloween would not be complete without treats. Among a list of eight top-selling types of candy, the most popular one by far is Reese’s Peanut Butter Cups, with 36% of Americans picking this as their favorite. In second place is Snickers at 18%, and M&M’s round out the top three at 11%. The other five candies named in the poll receive far fewer votes as top choice, including Hershey bars (6%), candy corn (6%), Skittles (5%), Starburst (4%), and Tootsie Pops (2%). There are some slight regional variations – e.g. Reese’s cups are somewhat more likely to be the top pick in the Midwest (41%), Northeast (37%), and Southeast (36%) than they are in the West (32%) and Southwest/Mountain (30%) regions – while Snickers bars are slightly more popular in the West (22%) and Southwest/Mountain (21%) regions than they are in the Southeast (17%), Northeast (16%), and Midwest (16%). However, the top three candies stay in the same order across every region of the country.
“Candy corn even making the list may surprise some people, but it is one of the top-selling Halloween candies in the country. We don’t know if it’s one of the top-eaten candies, but it does have a fan base. And candy corn make great fake teeth to creep out your parents with,” said Murray.
Seven-in-ten parents and caregivers (70%) report that their children plan to go trick-or-treating this year, including 82% who have at least one child age 12 or younger in the household and 37% of those who only have teenagers in the household. Very few of these parents will be allowing their children to go out on their own for Halloween. Nearly all (95%) of those with younger children who are trick-or-treating this year will have an adult chaperone. Even most parents of teenagers who will be trick-or-treating this year (76%) say that these older children will also be accompanied by an adult.
“Those days are long gone when parents would usher their costumed little ones out the door and tell them to be home by dark. Even teenagers get a watchful eye, which was pretty much unheard of a generation ago,” said Murray.
The poll finds that 3-in-10 adults (29%) intend to dress up in a costume themselves for Halloween. This includes 50% of those aged 18-34, 29% of those aged 35-54, and 10% of those aged 55 and older. Women (32%) are slightly more likely than men (25%) to don a Halloween costume. This is also somewhat more popular on the coasts (37% of Western US residents and 32% of Northeast residents) than it is in other parts of the country (28% Southwest/Mountain region, 24% Midwest, 24% Southeast). Hispanic adults (38%) are more likely than white (27%) or black (19%) adults to say they will dress up.
One practice that most Americans frown upon is when white people use face-darkening makeup to dress up as a different race as part of a Halloween costume. Just 31% say this is acceptable and 58% say it is not. Negative opinion softens a bit, but not much, if the intention is to dress up as a specific celebrity or famous person – 38% say darkening one’s skin for this type of costume is acceptable and 52% say it is not.
White (30%), Hispanic (28%), and black adults (24%) are about as equally as likely to say that it is acceptable for a white person to darken their skin as part of a Halloween costume in general. Acceptance of this practice rises somewhat among whites (39%) and Hispanics (39%) if the costume is of a known celebrity, but opinion among black Americans (25%) does not budge regardless of who the costume is meant to portray.
There is also a partisan difference in views of this practice among white Americans. Four-in-10 white Republicans (41%) are okay with the idea of skin darkening for a Halloween costume in general and 51% say this is acceptable if the costume is of a known celebrity. Three-in-ten white independents (30%) are okay with skin darkening for a costume in general and 41% say it is acceptable for a celebrity costume. On the other hand, just 18% of white Democrats find skin darkening for a Halloween costume to be acceptable and only slightly more (22%) say the same if the costume is portraying a known celebrity or famous person.
“Prominent figures dressing in blackface has been in the news recently, but those incidents all occurred many years ago. While most of the public finds this behavior objectionable, there is still a sizable minority who say it could be acceptable under certain circumstances,” said Murray.
The Monmouth University Poll was conducted by telephone from September 23 to 29, 2019 with 1,161 adults in the United States. The question results in this release have a margin of error of +/- 2.9 percentage points. The poll was conducted by the Monmouth University Polling Institute in West Long Branch, NJ.
QUESTIONS AND RESULTS
(* Some columns may not add to 100% due to rounding.)
[Q1-24 previously released.]
25. Would you say Halloween is your most favorite holiday of the year, one of your favorite holidays, or not a favorite holiday?
|
Sept. 2019 | |
| Most favorite holiday | 8% |
| One of your favorite holidays | 37% |
| Not a favorite holiday | 53% |
| (VOL) Don’t know | 2% |
| (n) | (1,161) |
[Q26 was asked of households with children under the age of 18; n=328, moe +/-5.4]
26. Will any children in your household go trick-or-treating this year, or not? [If YES: Will they go out on their own, or will they be accompanied by an adult chaperone?]
|
Sept. 2019 | |
| Yes, on their own or with teen/sibling | 4% |
| Yes, adult chaperone | 64% |
| Yes, not sure who with | 2% |
| No, will not go | 26% |
| (VOL) Don’t know | 4% |
| (n) | (328) |
27. Of the following choices, which is your favorite candy for Halloween? [CHOICES WERE ROTATED]
|
Sept. 2019 | |
| Candy corn | 6% |
| Skittles | 5% |
| Reese’s Peanut Butter Cups | 36% |
| Snickers | 18% |
| M&M’s | 11% |
| Starburst | 4% |
| Tootsie Pops | 2% |
| Plain Hershey bars | 6% |
| (VOL) Other/none of these | 6% |
| (VOL) Do not eat candy | 4% |
| (VOL) Don’t know | 2% |
| (n) | (1,161) |
28. Will you personally wear a Halloween costume this year, or not?
|
Sept. 2019 | |
| Yes | 29% |
| No | 67% |
| (VOL) Don’t know | 4% |
| (n) | (1,161) |
29. Do you think it is generally acceptable or not acceptable for a white person to use makeup to darken their face to dress up as a different race as part of a Halloween costume?
|
Sept. 2019 | |
| Acceptable | 31% |
| Not acceptable | 58% |
| (VOL) Depends | 6% |
| (VOL) Don’t know | 5% |
| (n) | (1,161) |
30. Do you think it is acceptable or not acceptable for a white person to use makeup to darken their face to dress for Halloween if they are going as a celebrity or other famous person of a different race?
|
Sept. 2019 | |
| Acceptable | 38% |
| Not acceptable | 52% |
| (VOL) Depends | 4% |
| (VOL) Don’t know | 6% |
| (n) | (1,161) |
METHODOLOGY
The Monmouth University Poll was sponsored and conducted by the Monmouth University Polling Institute from September 23 to 29, 2019 with a national random sample of 1,161 adults age 18 and older, in English. This includes 465 contacted by a live interviewer on a landline telephone and 696 contacted by a live interviewer on a cell phone. Telephone numbers were selected through random digit dialing and landline respondents were selected with a modified Troldahl-Carter youngest adult household screen. Monmouth is responsible for all aspects of the survey design, data weighting and analysis. Final sample is weighted for region, age, education, gender and race based on US Census information. Data collection support provided by Braun Research (field) and Dynata (RDD sample). For results based on this sample, one can say with 95% confidence that the error attributable to sampling has a maximum margin of plus or minus 2.9 percentage points (unadjusted for sample design). Sampling error can be larger for sub-groups (see table below). In addition to sampling error, one should bear in mind that question wording and practical difficulties in conducting surveys can introduce error or bias into the findings of opinion polls.
| DEMOGRAPHICS (weighted) |
| Self-Reported |
| 26% Republican |
| 44% Independent |
| 30% Democrat |
| 48% Male |
| 52% Female |
| 31% 18-34 |
| 33% 35-54 |
| 35% 55+ |
| 64% White |
| 12% Black |
| 16% Hispanic |
| 8% Asian/Other |
| 69% No degree |
| 31% 4 year degree |
Click on pdf file link below for full methodology and crosstabs by key demographic groups.


