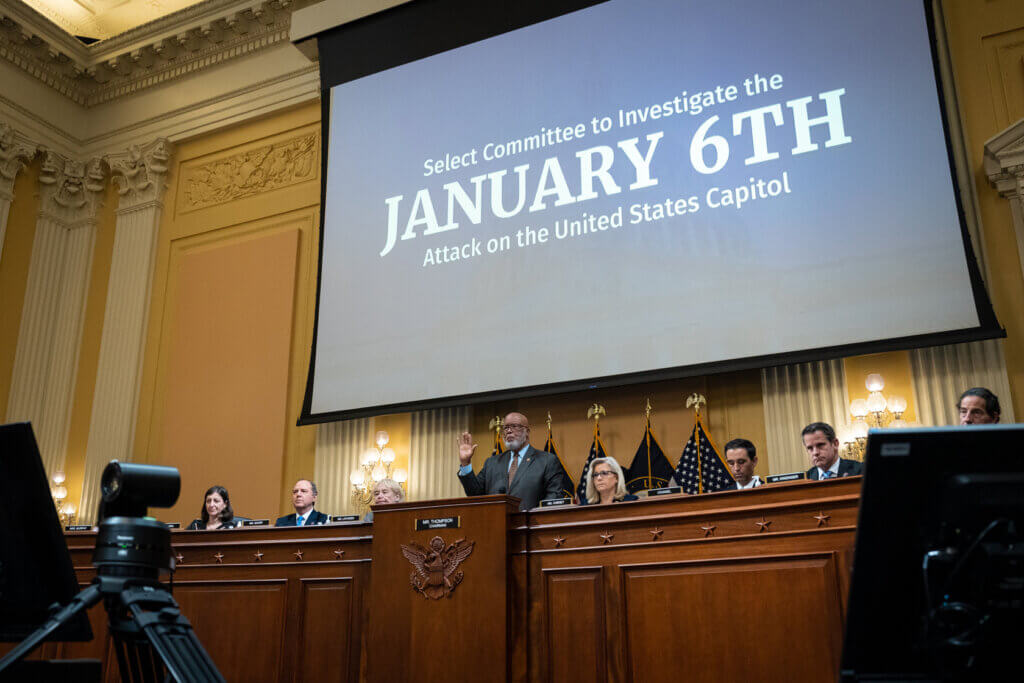
West Long Branch, NJ – The House Select Committee to Investigate the January 6th Attack heads into its final stages without showing much impact on overall public opinion. About 4 in 10 Americans feel former President Donald Trump was directly responsible for what happened at the U.S. Capitol that day, while 3 in 10 continue to believe that President Joe Biden’s 2020 election victory was fraudulent. The Monmouth (“Mon-muth”) University Poll finds a majority of the public wants the committee to resume public hearings, but they also prefer to see the investigation wrap up soon. The poll also finds that faith in our system of government has rebounded from its low point in June, although it is not clear whether the hearings themselves have helped or hurt the nation – or had no impact at all.
One in 4 Americans (25%) say the House investigation of the Jan. 6 incident at the U.S. Capitol has helped to strengthen American democracy, while slightly more (34%) say it has actually helped to weaken our democracy. Another 35% feel the investigation has had no impact on American democracy. At the same time, 50% of Americans believe that our system of government is basically sound. This marks a return to pre-2021 levels (e.g. 52% in November 2018). The “basically sound” metric stood at 44% shortly after the Jan. 6 incident and dipped to 36% in June 2022, after the House committee started holding public hearings. At the other end of the spectrum, 22% believe that the American system of government is not sound at all. This number is down from 36% who felt this way in June and also marks a return to earlier levels. The increased belief that the American system is sound has come among both Democrats (from 36% in June to 56% now) and Republicans (from 39% to 52%).
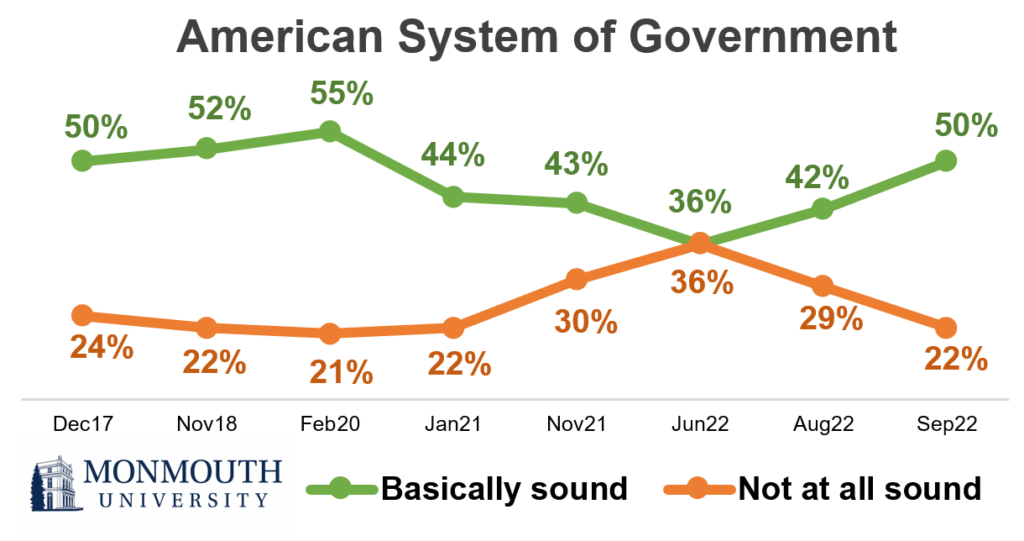
“There’s certainly a correlation between the hearings kicking off and a decreased faith in the American system’s resilience, but it is not clear what caused the rebound. It may be that Americans feel confident in our democratic processes after withstanding the test of Jan. 6, or it could simply be they are no longer thinking about those dangers without the weekly presence of televised hearings,” said Patrick Murray, director of the independent Monmouth University Polling Institute.
Trust in the House Jan. 6 committee has remained stable since public hearings started. One-third (34%) has a lot of trust that the committee is conducting a fair investigation – similar to 35% in August and 34% in June. Another 24% currently trust the committee’s fairness a little, and 39% do not trust it at all. Two-thirds Democrats (66%) have a lot of trust while a similar number of Republicans (67%) have no trust in the investigation’s fairness.
A majority of Americans (58%) think the committee should resume public hearings. However, 51% also say it should wrap up its investigation as soon as possible and 11% want it wrapped up in the next year. A third (35%) of the public feels the committee should continue its investigation as long as necessary. Opinion is starkly divided along partisan lines – 83% of Democrats favor resuming the hearings while 65% of Republicans oppose this. Most Republicans (75%) want the investigation concluded as soon as possible but most Democrats (62%) say it should proceed as long as needed. Among independents, 60% want more public hearings, but 53% also want to conclude the investigation soon.
“Independents say they want to see more from the committee, but also to wrap this up soon. It may be that they want to let the process play out, but feel they already have seen enough to make up their minds about what happened after the 2020 election and who is responsible,” said Murray.
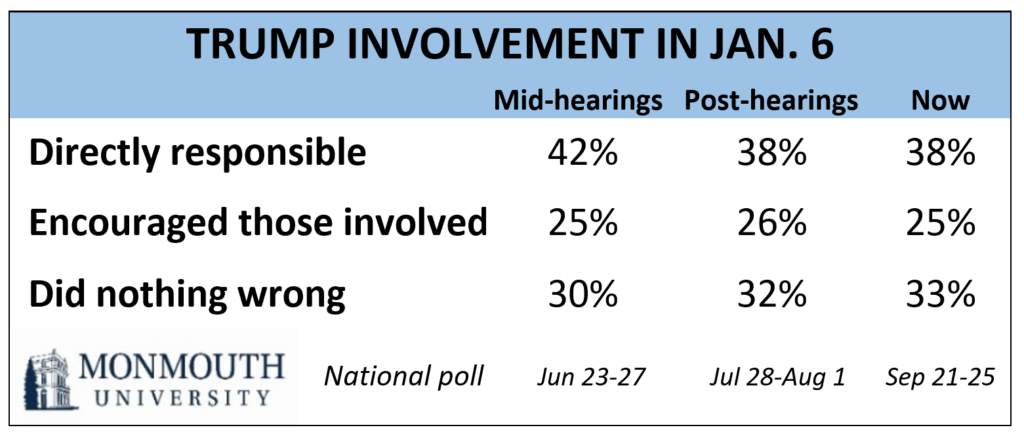
Currently, 38% of the public says Trump is directly responsible for what happened on Jan. 6th, 25% feel Trump encouraged those involved but is not directly responsible, and 33% feel he has done nothing wrong. These results are basically the same as polls taken in the middle of the summer hearings and after they ended in July.
The current poll finds that 41% of Americans – including 78% of Democrats – favor charging Trump with crimes related to his involvement in the Jan. 6 incident, while 34% are opposed – including 71% of Republicans. Another 25% are unsure. The public is divided on whether having Trump stand trial will help (33%) or hurt (38%) the stability of our political system, while another 25% say it would have no impact on the country overall. These results are similar to Monmouth’s August poll.
In related findings, 61% of the public feels that members of Congress who assisted the Jan. 6 planners should be removed from office – including 88% of Democrats, but just 37% of Republicans. These results similar to when Monmouth asked this question in June.
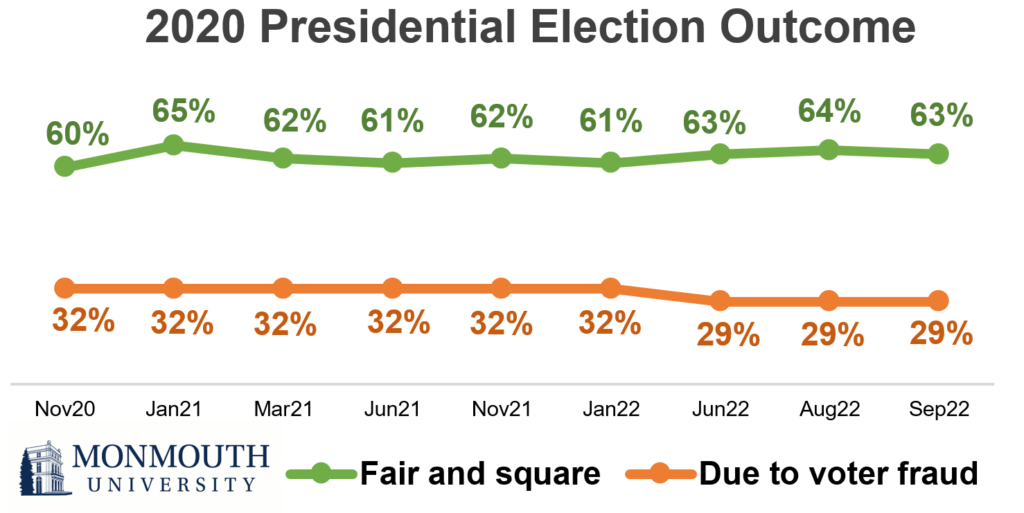
Belief in what is colloquially known as “the big lie” has remained rock steady since the November 2020 election. Currently, 29% of Americans hold the erroneous belief that Biden only won due to voter fraud. This number has hovered in a narrow range between 29% and 32% since the presidential election. Six in 10 (61%) Republicans currently hold this view.
The Monmouth University Poll was conducted by telephone from September 21 to 25, 2022 with 806 adults in the United States. The question results in this release have a margin of error of +/- 3.5 percentage points. The poll was conducted by the Monmouth University Polling Institute in West Long Branch, NJ.
QUESTIONS AND RESULTS
(* Some columns may not add to 100% due to rounding.)
[Q1-11 held for future release.]
12.Now, I’m going to read four statements about our American system of government. Listen carefully and then tell me which one is closest to how you feel: our system of government is basically sound and essentially needs no changes, our system is basically sound, but needs some improvement, our system is not too sound and needs many improvements, or our system is not sound at all and needs significant changes?
| TREND: | Sept. 2022 | Aug. 2022 | June 2022 | Nov. 2021 | Jan. 2021 | Feb. 2020 | Nov. 2018 | Dec. 2017 | Nov. 1980* |
| Basically sound, no changes | 11% | 9% | 6% | 8% | 7% | 9% | 10% | 7% | 6% |
| Basically sound, some improvement | 39% | 33% | 30% | 35% | 37% | 46% | 42% | 43% | 56% |
| Not too sound, many improvements | 26% | 27% | 26% | 26% | 33% | 24% | 26% | 25% | 27% |
| Not sound at all, significant changes | 22% | 29% | 36% | 30% | 22% | 21% | 22% | 24% | 10% |
| (VOL) Don’t know | 2% | 1% | 2% | 1% | 0% | 1% | 1% | 2% | 1% |
| (n) | (806) | (808) | (978) | (811) | (809) | (902) | (802) | (806) | (1,103) |
* Source: Opinion Research Corporation
13.Do you believe Joe Biden won the 2020 election fair and square, or do you believe that he only won it due to voter fraud?
| TREND: | Sept. 2022 | Aug. 2022 | June 2022 | Jan. 2022 | Nov. 2021 | June 2021 | March 2021 | Jan. 2021 | Nov. 2020 |
| Fair and square | 63% | 64% | 63% | 61% | 62% | 61% | 62% | 65% | 60% |
| Due to voter fraud | 29% | 29% | 29% | 32% | 32% | 32% | 32% | 32% | 32% |
| (VOL) Don’t know | 8% | 7% | 8% | 7% | 5% | 7% | 6% | 3% | 8%* |
| (n) | (806) | (808) | (978) | (794) | (811) | (810) | (802) | (809) | (810) |
* Includes 2% who said Biden would not be declared the winner.
Now, a few questions about the incident at the U.S. Capitol on January 6, 2021.
14.As you may know, the House of Representatives Select Committee investigating the incident held public hearings over the summer. How much do you trust that the committee is conducting a fair investigation – a lot, a little, or not at all?
| TREND: | Sept. 2022 | Aug. 2022 | June 2022 | Nov. 2021* |
| A lot | 34% | 35% | 34% | 26% |
| A little | 24% | 26% | 22% | 31% |
| Not at all | 39% | 36% | 41% | 41% |
| (VOL) Don’t know | 3% | 3% | 3% | 2% |
| (n) | (806) | (808) | (978) | (811) |
* Nov 2021 wording: “How much do you trust the House committee to conduct a fair investigation…?”
15.Do you think the committee should resume holding public hearings, or not?
| Sept. 2022 | |
| Resume | 58% |
| Not resume | 38% |
| (VOL) Don’t know | 4% |
| (n) | (806) |
16.Do you think the committee should continue its investigation as long as necessary, should plan to wrap up the investigation sometime in the next year, or should wrap up the investigation as soon as possible?
| Sept. 2022 | |
| Continue as long as necessary | 35% |
| Wrap up in the next year | 11% |
| Wrap up as soon as possible | 51% |
| (VOL) Don’t know | 3% |
| (n) | (806) |
17.Has the committee’s investigation helped to strengthen American democracy, helped to weaken American democracy, or has had no impact on American democracy?
| Sept. 2022 | |
| Strengthen | 25% |
| Weaken | 34% |
| No impact | 35% |
| (VOL) Don’t know | 6% |
| (n) | (806) |
18.Do you think Donald Trump is (a) directly responsible for January 6th, (b) encouraged those involved in January 6th but was not directly responsible for their actions, or (c) did nothing wrong regarding January 6th?
| TREND: | Sept. 2022 | Aug. 2022 | June 2022 |
| Directly responsible | 38% | 38% | 42% |
| Encouraged those involved | 25% | 26% | 25% |
| Did nothing wrong | 33% | 32% | 30% |
| (VOL) Don’t know | 4% | 3% | 3% |
| (n) | (806) | (808) | (978) |
19.Do you favor or oppose charging Trump with crimes related to his involvement in January 6th, or are you not sure?
| TREND: | Sept. 2022 | Aug. 2022 |
| Favor | 41% | 41% |
| Oppose | 34% | 34% |
| Not sure | 25% | 25% |
| (n) | (806) | (808) |
20.Thinking about the overall good of the country, do you think it would help or hurt the stability of our political system if Trump has to stand trial for his involvement in January 6th, or would it have no impact?
| TREND: | Sept. 2022 | Aug. 2022 |
| Help | 33% | 31% |
| Hurt | 38% | 35% |
| No impact | 25% | 30% |
| (VOL) Don’t know | 5% | 4% |
| (n) | (806) | (808) |
21.Should members of Congress who assisted the planners of January 6th be removed from office, or not?
| TREND: | Sept. 2022 | June 2022 |
| Yes, removed | 61% | 66% |
| No, not removed | 30% | 26% |
| (VOL) Don’t know | 9% | 8% |
| (n) | (806) | (978) |
[Q22-32 held for future release.]
METHODOLOGY
The Monmouth University Poll was sponsored and conducted by the Monmouth University Polling Institute from September 21 to 25, 2022 with a probability-based national random sample of 806 adults age 18 and older. This includes 283 contacted by a live interviewer on a landline telephone and 523 contacted by a live interviewer on a cell phone, in English. Telephone numbers were selected through a mix of random digit dialing and list-based sampling. Landline respondents were selected with a modified Troldahl-Carter youngest adult household screen. Interviewing services were provided by Braun Research, with sample obtained from Dynata (RDD, n=571), Aristotle (list, n=156) and a panel of prior Monmouth poll participants (n=79). Monmouth is responsible for all aspects of the survey design, data weighting and analysis. The full sample is weighted for region, age, education, gender and race based on US Census information (ACS 2018 one-year survey). For results based on this sample, one can say with 95% confidence that the error attributable to sampling has a maximum margin of plus or minus 3.5 percentage points (unadjusted for sample design). Sampling error can be larger for sub-groups (see table below). In addition to sampling error, one should bear in mind that question wording and practical difficulties in conducting surveys can introduce error or bias into the findings of opinion polls.
DEMOGRAPHICS (weighted) |
| Self-Reported |
| 28% Republican |
| 43% Independent |
| 29% Democrat |
| 49% Male |
| 51% Female |
| 30% 18-34 |
| 33% 35-54 |
| 37% 55+ |
| 63% White |
| 12% Black |
| 16% Hispanic |
| 8% Asian/Other |
| 69% No degree |
| 31% 4 year degree |
Click on pdf file link below for full methodology and crosstabs by key demographic groups.


