West Long Branch, NJ – Most Americans disagree with President Donald Trump’s self-assessment that he hires the “best people.” The Manafort trial and Omarosa’s book have brought renewed attention to the quality of Trump’s advisers. The latest national Monmouth University Poll finds that a majority of the public is not confident in the way the White House staff are doing their jobs. The poll also finds that public opinion on major administration initiatives – including tax reform and tariffs – remains in net negative territory.
Trump’s overall job rating stands at 43% approve and 50% disapprove. The current results are basically in line with where his ratings have been since January, although they are slightly more negative than the last Monmouth poll taken immediately after the president’s meeting with North Korean leader Kim Jong Un in June (43% approve and 46% disapprove). Recent news cycles, though, have focused more on issues surrounding the president’s circle of advisers than on his policies.
As a candidate, Trump frequently claimed he would hire “the best people.” Few Americans agree that this promise has panned out a year and a half into his term. Just 30% say Trump does hire the best people, while a clear majority of 58% say he does not. Another 7% volunteer that the quality of his hiring choices have been mixed. While most Republicans (67%) say that Trump does hire the best people, a sizable minority of his fellow partisans either disagree (18%) or give a mixed response (11%). On the other hand, nearly all Democrats (93%) say that Trump does not hire the best people.
Most Americans are not confident in the way that White House advisers and staff are handling their jobs, including 13% who are not too confident and a plurality of 42% who are not at all confident. Few are very confident (19%) or even somewhat confident (23%) in the president’s advisers. There are predictable partisan divisions on this question, but it’s worth noting that Democrats are much more likely to say they are not at all confident in White House staff (79%) than Republicans are to say they are very confident (50%).
“Some observers who were lukewarm about the prospect of a Trump presidency believed that a decent set of advisers would keep him on an even keel. However, fully four in ten Americans have no confidence whatsoever in the people currently advising the President of the United States. That cannot be good,” said Patrick Murray, director of the independent Monmouth University Polling Institute.
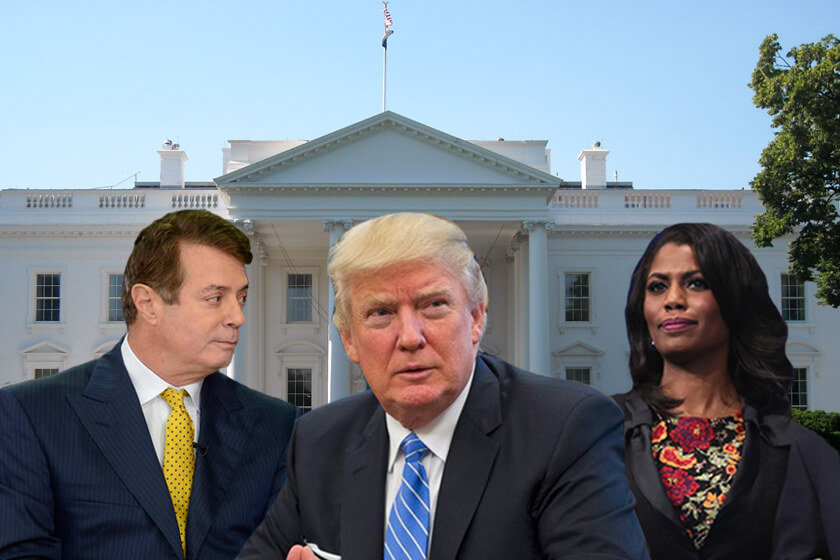
Trump’s inner circle has attracted renewed attention with the pending conclusion of former campaign chairman Paul Manafort’s first trial as well as last week’s release of Omarosa Manigault Newman’s book about her time in the administration. A majority of the public (54%) feel Trump did not show good judgment when he hired Omarosa, a contestant from his reality show, to work in the White House. Just 17% say the appointment showed good judgment and 28% offer no opinion. Even Republicans are more likely to say hiring Omarosa was a mistake (45%) rather than a show of good judgment (25%) on Trump’s part.
The public is divided on whether Omarosa is typical (38%) or not typical (38%) of the type of person Trump tends to hire. Another 24% have no opinion. A majority of Democrats (57%) say this appointment is typical of Trump’s hiring preferences while a majority of Republicans (60%) say it is not. Overall, only 8% of Americans have a favorable view of Omarosa, 37% have an unfavorable view, and 55% have no opinion of her.
“Neither Trump nor Omarosa are coming out of their association in a particularly good light,” said Murray.
The Manafort trial, which is on tax evasion and bank fraud charges, draws a more mixed assessment. While Manafort never officially served in the White House, he remained a Trump confidant after the 2016 election according to reports. Just under half of the public believes the Manafort charges suggest there may be widespread illegal activity among White House staff (45%) while nearly as many do not believe that this case necessarily suggests there is similar activity by White House staff (38%). These results include the expected partisan split, with 68% of Democrats saying the Manafort case suggests widespread illegal activity and 65% of Republicans saying it does not.
The charges now facing Manafort grew out of the special counsel’s investigation into Russian interference in the 2016 election and possible links with the Trump campaign, but they are not directly related to that investigation. The current trial is seen by 29% of the public as a result of prosecutors just following the evidence while 16% say the case was driven mainly by political motives. A plurality of 42%, though, say that both reasons played a role in bringing the present case to trial.
“This is going to be a long saga. The verdict in this trial could affect public opinion, but there is also a second Manafort trial to come that could also have an impact. And then there’s the actual Russia investigation itself, where opinion has been fairly stable over the past few months,” said Murray.
The Manafort trial does not seem to have had an impact on public opinion about the overall Russia probe. Currently, 52% say the investigation should continue while 46% say it should end. These results are similar to Monmouth’s poll findings from June (52% continue and 45% end) and April (54% continue and 43% end). However, support for the investigation was somewhat higher a year ago (62% continue and 33% end in July 2017).
The latest Monmouth University Poll also tracked public opinion on a couple of major administration initiatives. Regarding Trump’s decision to impose tariffs on a range of products imported from our trading partners, more say this will hurt (38%) rather than help (28%) the U.S. economy. Another 4% feel this will have no impact and 29% are unsure. This marks only a small improvement since June, when 40% said Trump’s tariffs would hurt the national economy and 25% said they would help.
The poll also finds that 37% of the public approve of the tax reform plan passed by Congress last year while a larger 45% disapprove. Another 18% are not sure how they feel. These results are similar to the 34% approve and 41% disapprove rating the tax plan received in June. Polls earlier this year showed the public to be more evenly divided on the tax plan – 40% approve to 44% disapprove in April, 41% approve to 42% disapprove in March, and 44% approve to 44% disapprove in January.
Overall, 35% of Americans say things in the country are going in the right direction while 57% say they have gotten off on the wrong track. These results are basically in line with Monmouth’s findings over the past few months, although they are slightly more negative than June’s 40% right direction and 53% wrong track rating.
The Monmouth University Poll was conducted by telephone from August 15 to August 19, 2018 with 805 adults in the United States. The question results in this release have a margin of error of +/- 3.5 percentage points. The poll was conducted by the Monmouth University Polling Institute in West Long Branch, NJ.
QUESTIONS AND RESULTS
(* Some columns may not add to 100% due to rounding.)
1. Do you approve or disapprove of the job Donald Trump is doing as president?
| TREND: | Aug 2018 | June 2018 | April 2018 | March 2018 | Jan. 2018 | Dec. 2017 | Sept. 2017 | Aug. 2017 | July 2017 | May 2017 | March 2017 |
| Approve | 43% | 43% | 41% | 39% | 42% | 32% | 40% | 41% | 39% | 39% | 43% |
| Disapprove | 50% | 46% | 50% | 54% | 50% | 56% | 49% | 49% | 52% | 53% | 46% |
| (VOL) No opinion | 7% | 11% | 9% | 8% | 8% | 12% | 11% | 10% | 9% | 8% | 11% |
| (n) | (805) | (806) | (803) | (803) | (806) | (806) | (1,009) | (805) | (800) | (1,002) | (801) |
[Q2 held for future release]
3. Would you say things in the country are going in the right direction, or have they gotten off on the wrong track?
| TREND: | Aug 2018 | June 2018 | April 2018 | March 2018 | Jan. 2018 | Dec. 2017 | Aug. 2017 | May 2017 | March 2017 | Jan. 2017 |
| Right direction | 35% | 40% | 33% | 31% | 37% | 24% | 32% | 31% | 35% | 29% |
| Wrong track | 57% | 53% | 58% | 61% | 57% | 66% | 58% | 61% | 56% | 65% |
| (VOL) Depends | 6% | 3% | 5% | 6% | 3% | 7% | 4% | 5% | 4% | 4% |
| (VOL) Don’t know | 3% | 3% | 4% | 1% | 3% | 3% | 5% | 3% | 5% | 2% |
| (n) | (805) | (806) | (803) | (803) | (806) | (806) | (805) | (1,002) | (801) | (801) |
| TREND: Continued | Aug. 2016* | Oct. 2015 | July 2015 | June 2015 | April 2015 | Dec. 2014 | July 2013 |
| Right direction | 30% | 24% | 28% | 23% | 27% | 23% | 28% |
| Wrong track | 65% | 66% | 63% | 68% | 66% | 69% | 63% |
| (VOL) Depends | 2% | 6% | 5% | 5% | 5% | 5% | 5% |
| (VOL) Don’t know | 3% | 4% | 3% | 3% | 2% | 3% | 4% |
| (n) | (803) | (1,012) | (1,001) | (1,002) | (1,005) | (1,008) | (1,012) |
* Registered voters
[Q4-10 held for future release]
Turning to some other issues,
11. Do you think Pres. Trump’s decision to impose tariffs on a range of products imported from our trading partners will help or hurt the U.S. economy, will it have no impact either way, or are you not sure?
| TREND: | Aug. 2018 | June 2018 |
| Help | 28% | 25% |
| Hurt | 38% | 40% |
| No impact | 4% | 7% |
| Not sure | 29% | 27% |
| (n) | (805) | (806) |
12. Do you approve or disapprove of the tax reform plan passed by Congress last year? [Do you (approve/disapprove) strongly or somewhat?]
| TREND: | Aug. 2018 | June 2018 | April 2018 | March 2018 | Jan. 2018 | Dec. 2017* |
| Strongly approve | 18% | 18% | 18% | 20% | 24% | 13% |
| Somewhat approve | 19% | 16% | 22% | 21% | 20% | 13% |
| Somewhat disapprove | 16% | 14% | 15% | 16% | 13% | 12% |
| Strongly disapprove | 29% | 27% | 29% | 26% | 31% | 35% |
| (VOL) Don’t know | 18% | 24% | 16% | 17% | 13% | 27% |
| (n) | (805) | (806) | (803) | (803) | (806) | (806) |
[*Question wording, in December 2017, was “Have you heard that the Senate and the House have passed tax reform bills and are now working on a final version, or haven’t you heard about this? If HEARD: Do you approve or disapprove of this tax reform plan?”]
13. A special counsel is currently conducting an investigation into Russian interference in the 2016 election and possible links with the Trump campaign. Should the Russia investigation continue or should it end?
| TREND: | Aug. 2018 | June 2018 | April 2018 | March 2018 | July 2017 | May 2017* |
| Continue | 52% | 52% | 54% | 60% | 62% | 73% |
| End | 46% | 45% | 43% | 37% | 33% | 24% |
| (VOL) Don’t know | 2% | 3% | 3% | 3% | 5% | 3% |
| (n) | (805) | (806) | (803) | (803) | (800) | (1,002) |
[* May ’17 question was asked about the then-ongoing FBI investigation.]
14. Turning to how the White House operates, how confident are you in the way that the president’s advisers and staff are handling their jobs – very confident, somewhat confident, not too confident, or not at all confident?
| Aug. 2018 | |
| Very confident | 19% |
| Somewhat confident | 23% |
| Not too confident | 13% |
| Not at all confident | 42% |
| (VOL) Don’t know | 3% |
| (n) | (805) |
15. And in general, would you say Donald Trump does or does not hire the best people?
| Aug. 2018 | |
| Does | 30% |
| Does not | 58% |
| (VOL) Mixed, depends | 7% |
| (VOL) Don’t know | 5% |
| (n) | (805) |
16. Have you seen or heard recent news about Omarosa Manigault-Newman releasing a book about her time working in the White House, or not?
| Aug. 2018 | |
| Have seen or heard | 73% |
| Have not seen or heard | 27% |
| (n) | (805) |
17. Do you think Trump hiring Omarosa to work in the White House did or did not show good judgment on his part?
| Aug. 2018 | |
| Did show good judgment | 17% |
| Did not show good judgment | 54% |
| (VOL) Don’t know | 28% |
| (n) | (805) |
18. Do you think Omarosa is or is not typical of the type of person Trump tends to hire to work for him?
| Aug. 2018 | |
| Is typical | 38% |
| Is not typical | 38% |
| (VOL) Don’t know | 24% |
| (n) | (805) |
19. Is your general impression of Omarosa favorable or unfavorable, or do you have no opinion of her?
| Aug. 2018 | |
| Favorable | 8% |
| Unfavorable | 37% |
| No opinion | 55% |
| (n) | (805) |
20. Have you seen or heard recent news about former Trump adviser Paul Manafort being on trial for tax evasion and bank fraud, or not?
| Aug. 2018 | |
| Have seen or heard | 75% |
| Have not seen or heard | 25% |
| (n) | (805) |
21. Do you think the charges against Manafort resulted from prosecutors just following the evidence or did they result from political motives, or was it a bit of both?
| Aug. 2018 | |
| Just following the evidence | 29% |
| Political motives | 16% |
| Both | 42% |
| (VOL) Don’t know | 13% |
| (n) | (805) |
22. Do you think the charges against Manafort suggest that there may be widespread illegal activity among staff in the White House, or do they not necessarily suggest widespread illegal activity?
| Aug. 2018 | |
| Suggest widespread illegal activity | 45% |
| Not necessarily suggest widespread illegal activity | 38% |
| (VOL) Don’t know | 17% |
| (n) | (805) |
METHODOLOGY
The Monmouth University Poll was sponsored and conducted by the Monmouth University Polling Institute from August 15 to 19, 2018 with a national random sample of 805 adults age 18 and older, in English. This includes 400 contacted by a live interviewer on a landline telephone and 405 contacted by a live interviewer on a cell phone. Telephone numbers were selected through random digit dialing and landline respondents were selected with a modified Troldahl-Carter youngest adult household screen. Monmouth is responsible for all aspects of the survey design, data weighting and analysis. Final sample is weighted for region, age, education, gender and race based on US Census information. Data collection support provided by Braun Research (field) and SSI (RDD sample). For results based on this sample, one can say with 95% confidence that the error attributable to sampling has a maximum margin of plus or minus 3.5 percentage points (unadjusted for sample design). Sampling error can be larger for sub-groups (see table below). In addition to sampling error, one should bear in mind that question wording and practical difficulties in conducting surveys can introduce error or bias into the findings of opinion polls.
| DEMOGRAPHICS (weighted) |
|
Self-Reported |
| 29% Republican |
| 39% Independent |
| 32% Democrat |
| 48% Male |
| 52% Female |
| 30% 18-34 |
| 33% 35-54 |
| 36% 55+ |
| 65% White |
| 12% Black |
| 15% Hispanic |
|
8% Asian/Other |
| 69% No degree |
| 31% 4 year degree |
Click on pdf file link below for full methodology and results by key demographic groups.


