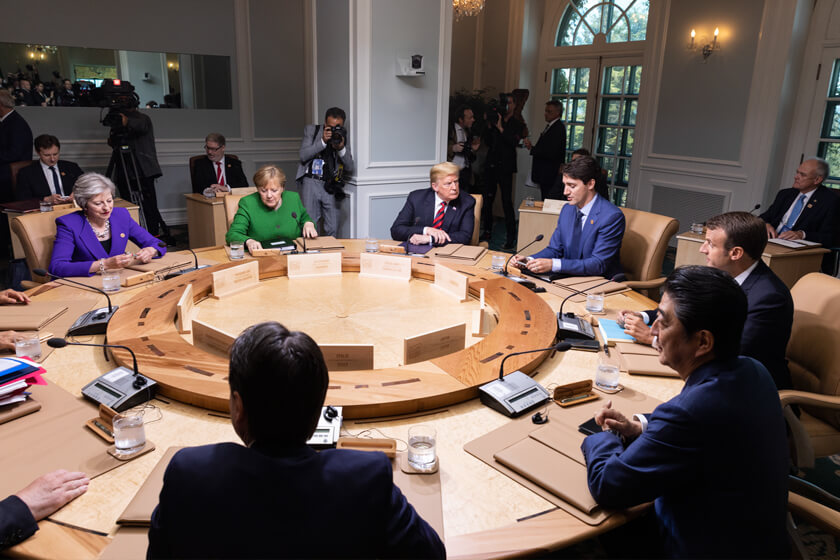
West Long Branch, NJ – Americans feel that President Donald Trump’s best friend on the international stage may be Vladimir Putin rather than a leader from any of our oldest or closest allies. The Monmouth University Poll also finds that the G-7 summit did not make Trump look as strong on the world stage as the meeting with his North Korean counterpart did a few days later. Few see Trump’s refusal to sign the joint G-7 statement as being good for the U.S and many Americans are concerned that a potential trade war could hurt the economy.
Trump is seen as having a better relationship with Russian President Vladimir Putin than he has with some of his fellow G-7 leaders. In fact, when asked to come up with the world leader who has the best relationship with Trump, 27% of the American public name Putin as that person. Putin far outpaces any other national leader in this perception. Others named include Theresa May of Great Britain (6%), Benjamin Netanyahu of Israel (6%), Kim Jong Un of North Korea (5%), Emmanuel Macron of France (4%), Xi Jinping of China (4%), Shinzo Abe of Japan (3%), Justin Trudeau of Canada (3%), and Angela Merkel of Germany (1%). Another 3% name another leader, 4% say Trump doesn’t have a good relationship with any other world leader, and 34% do not offer a response.
Putin tops the list as Trump’s best bud internationally among Democrats (43%) and independents (28%), but only 8% of Republicans feel that Russia’s leader is Trump’s closest friend in his peer group. More Republicans name Netanyahu (12%) or May (11%) as the foreign leader with whom Trump has the best relationship.
When specifically asked about Trump’s relationship with six different leaders, 60% of the public say he has a good relationship with Putin and just 26% say the two leaders have a bad relationship. The results are nearly identical for North Korea’s Kim – 59% say he and Trump have a good relationship and 25% say they have a bad relationship. About 4-in-10 say Trump has a good relationship with China’s Xi (44%, to 30% bad relationship) and Britain’s May (42%, to 37% bad relationship). Most Americans, though, see Trump as having a negative relationship with Germany’s Merkel (28% good to 44% bad) and Canada’s Trudeau (27% good to 55% bad).
“According to the public, Trump seems to get along better with authoritarian rulers than with leaders who are democratically elected, with his closest pal being the guy who tried to undermine public faith in the U.S. electoral system. I’m not sure what else to say about that,” said Patrick Murray, director of the independent Monmouth University Polling Institute.
Trump does not get great reviews for his refusal to sign on to the joint communiqué issued after last week’s G-7 summit. Less than 1-in-5 (17%) say not signing the statement is good for the United States while 37% say it is bad for the country. Another 9% say it has no impact and 37% are unsure. Among those who were previously aware that Trump did not sign the statement – representing just over half of all poll respondents – twice as many see Trump’s refusal as being bad (52%) rather than good (25%) for the country.
The public is divided on whether the outcome of the G-7 summit made Trump look stronger (22%) or weaker (29%) on the world stage, with a plurality (38%) saying the summit did not really affect the president’s international stature. By comparison, Trump came off much better from his subsequent meeting with North Korea’s leader – with 46% saying that his talks with Kim made Trump look stronger and only 13% saying this made him look weaker (details in poll released yesterday). The prevailing opinion among Republicans is that the G-7 summit made Trump look stronger (44%), while Democrats say it made him look weaker (50%), and independents tend to say it didn’t change his standing on the world stage (43%).
“The G-7 summit may not have been Trump’s finest hour, leaving many Americans feeling a little unsettled about how potential trade conflicts will affect their pocketbooks,” said Murray.
Americans say that getting into a trade war with our main partners is currently more likely to happen (53%) than it is unlikely (37%). Nearly two-thirds of the public are either very (34%) or somewhat (30%) concerned that their local economy would be hurt if a trade war did break out. Just over one-third are either not too (17%) or not at all (18%) concerned about this possibility.
Regarding Trump’s decision to impose tariffs on a range of products imported from our trading partners, more say this will hurt (40%) rather than help (25%) the U.S. economy. Another 7% feel this will have no impact and 27% are unsure. The public is even more concerned, however, about the impact of retaliatory tariffs on U.S.-made products – with 50% saying such tariffs will hurt our national economy and just 7% saying they will help. Another 17% say that tariffs imposed by our trading partners will have no impact on the U.S. economy and 26% are unsure.
Nearly half of Republicans (47%) expect that Trump’s tariffs will help the nation’s economy while few (31%) believe that any reciprocal tariffs imposed by our trading partners would hurt the U.S. Most Democrats feel that both policies will hurt (61% for Trump’s tariffs and 65% for retaliatory tariffs) and at least a plurality of independents say the same (43% for Trump’s tariffs and 51% for retaliatory tariffs).
National public opinion is divided on the issue of tariffs as a whole, with 36% saying they are generally good for the U.S. and an identical 36% saying they are generally bad, another 29% either having no opinion or saying it depends. At the opposite end of the policy spectrum 52% say free trade agreements with other countries are generally good for the U.S. and just 14% say they are bad, with 35% either having no opinion or saying it depends. Public opinion on free trade agreements was evenly divided at 24% good and 26% bad back in 2015 when then-President Barack Obama was negotiating the Trans-Pacific Partnership deal, while nearly half (49%) then said they were not sure. Currently, 57% of Democrats, 52% of independents, and 46% of Republicans feel that free trade agreements are generally a good thing. In 2015, there was no partisan divide among Democrats (24%), independents (24%), and Republicans (23%) feeling that free trade was good for the country.
“Republicans are sticking with their president on tariffs even though many seem to like the concept of free trade as well. It’s one of the starkest examples of how Donald Trump is reshaping the GOP,” said Murray.
The Monmouth University Poll was conducted by telephone from June 12 to 13, 2018 with 806 adults in the United States. The results in this release have a margin of error of +/- 3.5 percentage points. The poll was conducted by the Monmouth University Polling Institute in West Long Branch, NJ.
QUESTIONS AND RESULTS
(* Some columns may not add to 100% due to rounding.)
[Q1 and Q5-14 previously released.]
[Q2-4 held for future release.]
15. Now thinking about all the leaders of other countries in the world, which one do you think Donald Trump has the best relationship with? [LIST WAS NOT READ]
| June 2018 | |
| Vladimir Putin of Russia | 27% |
| Theresa May of Britain | 6% |
| Benjamin Netanyahu of Israel | 6% |
| Kim Jong Un of North Korea | 5% |
| Emmanuel Macron of France | 4% |
| Xi Jinping of China | 4% |
| Shinzo Abe of Japan | 3% |
| Justin Trudeau of Canada | 3% |
| Angela Merkel of Germany | 1% |
| Other | 3% |
| No one, himself | 4% |
| No answer | 34% |
| (n) | (806) |
16. I’m going to read you the names of some world leaders. Please tell me whether you think Donald Trump has a good relationship or a bad relationship with each one? [NAMES WERE ROTATED]
Canadian Prime Minister Justin Trudeau
| June 2018 | |
| Good relationship | 27% |
| Bad relationship | 55% |
| (VOL) Don’t know | 18% |
| (n) | (806) |
British Prime Minister Theresa May
| June 2018 | |
| Good relationship | 42% |
| Bad relationship | 37% |
| (VOL) Don’t know | 21% |
| (n) | (806) |
German Chancellor Angela Merkel
| June 2018 | |
| Good relationship | 28% |
| Bad relationship | 44% |
| (VOL) Don’t know | 28% |
| (n) | (806) |
Chinese President Xi Jinping
| June 2018 | |
| Good relationship | 44% |
| Bad relationship | 30% |
| (VOL) Don’t know | 25% |
| (n) | (806) |
Russian President Vladimir Putin
| June 2018 | |
| Good relationship | 60% |
| Bad relationship | 26% |
| (VOL) Don’t know | 14% |
| (n) | (806) |
North Korean Leader Kim Jong Un
| June 2018 | |
| Good relationship | 59% |
| Bad relationship | 25% |
| (VOL) Don’t know | 16% |
| (n) | (806) |
17. Before the North Korea meeting, President Trump attended the G-7 summit last week with the leaders of our main trading partners. How much have you heard about this summit – a lot, a little, or nothing at all?
| June 2018 | |
| A lot | 34% |
| A little | 38% |
| Nothing at all | 28% |
| (n) | (806) |
18. Were you aware that President Trump refused to sign on to the joint statement put out by the other six countries’ leaders, or hadn’t you heard about this?
| June 2018 | |
| Aware | 54% |
| Hadn’t heard | 46% |
| (n) | (806) |
19. Do you think not signing on to this statement is good or bad for the United States, does it have no impact on our country, or are you not sure?
| June 2018 | |
| Good | 17% |
| Bad | 37% |
| No impact | 9% |
| Not sure | 37% |
| (n) | (806) |
20. Do you think the outcome of the G-7 summit made President Trump look stronger or weaker on the world stage, or didn’t it really change how he looks on the world stage?
| June 2018 | |
| Stronger | 22% |
| Weaker | 29% |
| Didn’t really change | 38% |
| (VOL) Don’t know | 10% |
| (n) | (806) |
[QUESTIONS 21 & 22 WERE ROTATED]
21. In general, do you think that free trade agreements with other countries are good or bad for the United States, or are you not sure?
| June 2018 | November 2015 | |
| Good | 52% | 24% |
| Bad | 14% | 26% |
| Not sure | 30% | 46% |
| (VOL) Depends | 5% | 3% |
| (n) | (806) | (1,012) |
22. In general, do you think that imposing tariffs on products imported from other countries is good or bad for the United States, or are you not sure?
| June 2018 | |
| Good | 36% |
| Bad | 36% |
| Not sure | 23% |
| (VOL) Depends | 6% |
| (n) | (806) |
23. Do you think Pres. Trump’s decision to impose tariffs on a range of products imported from our trading partners will help or hurt the U.S. economy, will it have no impact either way, or are you not sure?
| June 2018 | |
| Help | 25% |
| Hurt | 40% |
| No impact | 7% |
| Not sure | 27% |
| (n) | (806) |
24. Do you think our trading partners’ decision to impose their own tariffs on American-made products will help or hurt the U.S. economy, will it have no impact either way, or are you not sure?
| June 2018 | |
| Help | 7% |
| Hurt | 50% |
| No impact | 17% |
| Not sure | 26% |
| (n) | (806) |
25. Do you think it is likely or not likely that the U.S. will get into a trade war with our main trading partners?
| June 2018 | |
| Likely | 53% |
| Not likely | 37% |
| (VOL) Don’t know | 11% |
| (n) | (806) |
26. If we do get into a trade war, how concerned are you that this would hurt the local economy in your area – very concerned, somewhat concerned, not too concerned, or not at all concerned?
| June 2018 | |
| Very concerned | 34% |
| Somewhat concerned | 30% |
| Not too concerned | 17% |
| Not at all concerned | 18% |
| (VOL) Don’t know | 1% |
| (n) | (806) |
[Q27-28 held for future release.]
METHODOLOGY
The Monmouth University Poll was sponsored and conducted by the Monmouth University Polling Institute from June 12 to 13, 2018 with a national random sample of 806 adults age 18 and older, in English. This includes 403 contacted by a live interviewer on a landline telephone and 403 contacted by a live interviewer on a cell phone. Telephone numbers were selected through random digit dialing and landline respondents were selected with a modified Troldahl-Carter youngest adult household screen. Monmouth is responsible for all aspects of the survey design, data weighting and analysis. Final sample is weighted for region, age, education, gender and race based on US Census information. Data collection support provided by Braun Research (field) and SSI (RDD sample). For results based on this sample, one can say with 95% confidence that the error attributable to sampling has a maximum margin of plus or minus 3.5 percentage points (unadjusted for sample design). Sampling error can be larger for sub-groups (see table below). In addition to sampling error, one should bear in mind that question wording and practical difficulties in conducting surveys can introduce error or bias into the findings of opinion polls.
| DEMOGRAPHICS (weighted) |
| Self-Reported |
| 28% Republican |
| 40% Independent |
| 32% Democrat |
| 49% Male |
| 51% Female |
| 32% 18-34 |
| 34% 35-54 |
| 34% 55+ |
| 64% White |
| 12% Black |
| 16% Hispanic |
|
8% Asian/Other |
| 70% No degree |
| 30% 4 year degree |
Click on pdf file link below for full methodology and results by key demographic groups.


