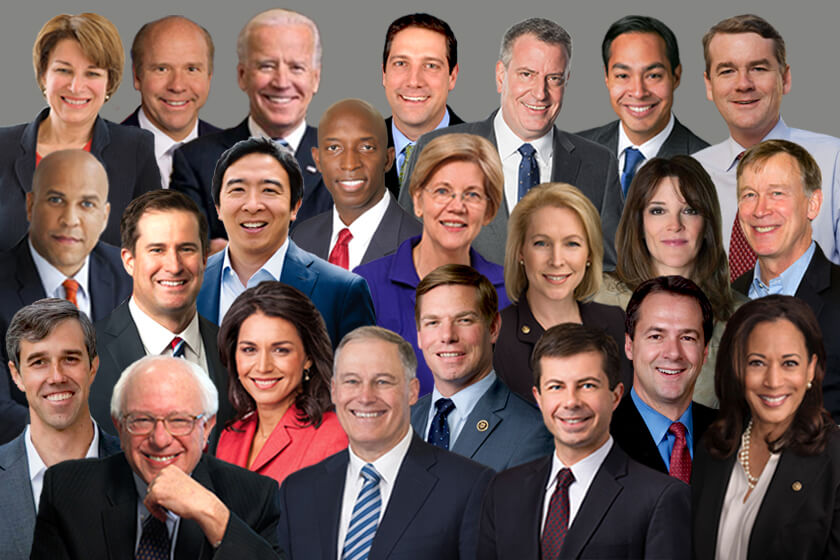
West Long Branch, NJ – Diversity may be the byword for the 2020 field of Democrats, but it does not appear to be a priority in choosing a challenger to Trump according to the Monmouth University Poll. Most Democratic voters say race and gender are not factors in determining who should be the party’s presidential nominee. There have been some shifts in the current beauty contest – with a noted surge by a small city mayor – but the front-runner spot has held steady as former Vice President Joe Biden reportedly is set to jump into the race this week.
Race and gender do not seem to be important factors for Democratic voters when considering who the party should choose to run against Trump. Fully 87% say the race of the nominee does not matter. Just 5% say it would be better for Democrats to nominate a person of color, which is offset by 6% who say it would actually be better for the party to nominate a white candidate. Similarly, 77% say the gender of the nominee does not matter. Just 7% say it would be better for Democrats to nominate a woman, while slightly more (12%) say it would actually be better for the party to nominate a man.
“This is the most diverse field of presidential candidates in history, but that doesn’t seem to be a major consideration for Democratic voters at this early stage of the campaign. It’s probably a large reason why a couple of old white guys are leading the pack right now,” said Patrick Murray, director of the independent Monmouth University Polling Institute.
Among a field of 24 announced and potential contenders, Biden currently has the support of 27% of Democrats and Democratic-leaning voters, which is similar to his 28% support in March and 29% in January. Support for Vermont Sen. Bernie Sanders is currently at 20%, which is down slightly from 25% in March, but still higher than his 16% support in January.
“If Biden does enter the race this week, he starts off with a fairly stable amount of good will from Democrats. We might even expect to see a small bump after his announcement, but the bigger question will be what happens when those voters start taking a closer look at him on the campaign trail. It’s a long way to Iowa and a lot can happen,” said Murray.
South Bend, Indiana Mayor Pete Buttigieg currently has 8% support. He registered less than 1% in prior Monmouth polls. California Sen. Kamala Harris has 8% support, off just slightly from 10% in March and 11% in January. Rounding out the field of top contenders are Massachusetts Sen. Elizabeth Warren at 6% (from 8% in both March and January) and former Texas Congressman Beto O’Rourke at 4% (6% in March and 7% in January).
Others who score at least 1% include New Jersey Sen. Cory Booker (2%, from 5% in March and 4% in January), former Colorado Gov. John Hickenlooper (2%, from 1% in prior polls), Minnesota Sen. Amy Klobuchar (1%, from 3% in March and 2% in January), and New York City Mayor Bill de Blasio (1%, from 1% in March). The remaining 14 names asked about in the survey receive support from less than 1% of Democratic voters at this time, which is basically unchanged from their support levels in prior national Monmouth polls.
Most of the top contenders saw a decline of 2 to 3 points in their support since March, while Sanders actually dropped by 5 points and Biden lost only one point. The major exception to this trend is Buttigieg, whose support shot up 8 points from basically nothing one month ago. The other sizable shift in this poll is the number of Democrats who do not lean toward any candidate. This undecided group currently stands at 14%, up from 8% in March.
“You cannot deny that Buttigieg is experiencing a real moment right now, but it’s important to remember there is a lot of fluidity in this field. Voters are not only moving from candidate to candidate but also from candidate to undecided. Right now, the top tier is determined largely by who has a high national profile. This may not gel with how the contest will play out in the early states,” said Murray.
If, contrary to current media reports, Biden chooses not to run, Sanders would move into the front-runner spot with 27% support (down from 32% in March), Buttigieg 11% (from less than 1%), Harris 11% (from 15%), Warren 8% (from 10%), O’Rourke 6% (from 7%), Booker 3% (from 6%), Hickenlooper 2% (from 1%), and Klobuchar 2% (from 3%).
Biden’s overall rating among Democrats has declined following complaints from some women about his interactions with them, but there are two important caveats to this finding: (1) Biden remains the most popular contender in the field by far and (2) his closest rival has also experienced a similar drop in standing during this time. Biden’s net favorability rating among Democratic voters stands at +56 (72% favorable and 16% unfavorable), which is down from +63 last month (76% favorable and 13% unfavorable). It is worth noting that the March results already showed a decline from Biden’s net +71 in January (80%-9%), well before the recent controversy emerged. Sanders’ rating now stands at +44 (65% favorable and 21% unfavorable), which is down from +53 in March (70%-17%) and +49 in January (68%-19%).
| 2020 DEMOCRATIC FIELD – PARTY VOTER OPINION | ||||||
| Total opinion (%) | Net rating | |||||
| Apr ’19 | Mar ’19 | Jan ’19 | Apr ’19 | Mar ’19 | Jan ’19 | |
| 88 | 89 | 89 | Joe Biden | +56 | +63 | +71 |
| 86 | 87 | 87 | Bernie Sanders | +44 | +53 | +49 |
| 70 | 68 | 74 | Elizabeth Warren | +32 | +30 | +40 |
| 60 | 64 | 59 | Kamala Harris | +40 | +42 | +33 |
| 56 | 55 | 55 | Cory Booker | +24 | +31 | +33 |
| 55 | 50 | 50 | Beto O’Rourke | +31 | +26 | +32 |
| 41 | n/a | 14 | Pete Buttigieg | +29 | n/a | +2 |
| 40 | 39 | 31 | Amy Klobuchar | +14 | +13 | +15 |
Buttigieg’s rating has shot up since January going from a net +2 (8% favorable and 6% unfavorable) to a net +29 (35%-6%) in the current poll after bursting onto the national scene. Other top tier candidates saw moderate shifts in their ratings. O’Rourke’s current net +31 rating (43%-12%) is up slightly from +26 in March (38%-12%) and back to near where it was in January at +32 (41%-9%). Booker’s rating declined to +24 (40%-16%) from +31 in March (43%-12%) and +33 in January (44%-11%).
Warren’s current net +32 rating (51% favorable and 19% unfavorable) has held steady from +30 in March (49%-19%), but is still lower than her +40 rating in January (57%-17%). Harris’ rating has also held steady at +40 (50%-10%), compared to +42 in March (53%-11%) – both of which are higher than her January rating of +33 (46%-13%). Klobuchar’s rating is also unmoved at +14 (27%-13%), compared with +13 in March (26%-13%) and +15 in January (23%-8%).
“National primary polls have limited utility at this stage of the game. They give us a sense of who is breaking through the media noise, but the vast majority of the voters we poll nationally are not paying attention and in fact will never have the opportunity to winnow down the field at the ballot box. It’s worth looking at these results in the context of polls from the early states, where all these candidates are better known,” said Murray.
Monmouth conducted a poll of likely Iowa caucusgoers earlier this month. Candidate familiarity – as measured by the percentage of voters who could offer an opinion – was higher for all candidates in that poll than in the current national results, including Biden (4 points higher), Sanders (7 points higher), Buttigieg (13 points higher), Harris (14 points higher), Booker (14 points higher), Warren (17 points higher), O’Rourke (18 points higher), and Klobuchar (21 points higher).
Sanders is the only one of these eight contenders who has a lower rating among likely Iowa voters (net +41) than he does among all Democratic-identifiers nationally (+44). Klobuchar, on the other hand, has a significantly better rating in Iowa (+41) than she does nationally (+14). Others who do better in Iowa than nationally include O’Rourke (+47 versus +31), Warren (+47 versus +32), and Booker (+38 versus +24); and to a lesser degree Biden (+64 versus +56), Harris (+48 versus +40), and Buttigieg (+36 versus +29).
“National prominence is certainly important because it helps drive fundraising, but we shouldn’t lose sight of candidates who might be well-positioned in key states even if the national media isn’t showering them with attention right now,” said Murray.
The Monmouth University Poll was conducted by telephone from April 11 to 15, 2019 with 801 adults. Results in this release are based on 330 registered voters who identify as Democrats or lean toward the Democratic Party in the United States, which has a +/- 5.4 percentage point sampling margin of error. The poll was conducted by the Monmouth University Polling Institute in West Long Branch, NJ.
QUESTIONS AND RESULTS
(* Some columns may not add to 100% due to rounding.)
[Q1-7 previously released.]
[Q8-13 held for future release.]
14. I know the 2020 election is far away, but who would you support for the Democratic nomination for president if the candidates were the following? [INCLUDES LEANERS] [NAMES WERE ROTATED]
|
TREND: (with leaners) | April 2019 | March 2019 | Jan. 2019 |
| Joe Biden | 27% | 28% | 29% |
| Bernie Sanders | 20% | 25% | 16% |
| Pete Buttigieg | 8% | <1% | 0% |
| Kamala Harris | 8% | 10% | 11% |
| Elizabeth Warren | 6% | 8% | 8% |
| Beto O’Rourke | 4% | 6% | 7% |
| Cory Booker | 2% | 5% | 4% |
| John Hickenlooper | 2% | 1% | 1% |
| Amy Klobuchar | 1% | 3% | 2% |
| Bill de Blasio | 1% | 1% | n/a |
| Julián Castro | <1% | 1% | 1% |
| Kirsten Gillibrand | <1% | <1% | 1% |
| Jay Inslee | <1% | <1% | <1% |
| Terry McAuliffe | <1% | <1% | <1% |
| Wayne Messam | <1% | n/a | n/a |
| Seth Moulton | <1% | n/a | n/a |
| Eric Swalwell | <1% | n/a | n/a |
| Marianne Williamson | <1% | <1% | n/a |
| Andrew Yang | <1% | 1% | 1% |
| Michael Bennet | 0% | <1% | n/a |
| Steve Bullock | 0% | 0% | n/a |
| John Delaney | 0% | 0% | <1% |
| Tulsi Gabbard | 0% | <1% | 1% |
| Tim Ryan | 0% | n/a | n/a |
| (VOL) Other | 1% | <1% | 1% |
| (VOL) No one | 3% | <1% | 3% |
| Mike Bloomberg | n/a | 2% | 4% |
| Sherrod Brown | n/a | 1% | 1% |
| Eric Holder | n/a | <1% | 1% |
| (VOL) Undecided | 14% | 8% | 9% |
| (n) | (330) | (310) | (313) |
14B. If Joe Biden does not run for president, who would be your second choice? [Results in table below reflect preferences of all Democrats after Biden supporters’ second choices are reallocated.]
| TREND: | April 2019 | March 2019 |
| Bernie Sanders | 27% | 32% |
| Pete Buttigieg | 11% | <1% |
| Kamala Harris | 11% | 15% |
| Elizabeth Warren | 8% | 10% |
| Beto O’Rourke | 6% | 7% |
| Cory Booker | 3% | 6% |
| John Hickenlooper | 2% | 1% |
| Amy Klobuchar | 2% | 3% |
| Bill de Blasio | 1% | 1% |
| Andrew Yang | 1% | 1% |
| Julián Castro | <1% | 1% |
| Kirsten Gillibrand | <1% | 1% |
| Jay Inslee | <1% | <1% |
| Terry McAuliffe | <1% | <1% |
| Wayne Messam | <1% | n/a |
| Seth Moulton | <1% | n/a |
| Tim Ryan | <1% | n/a |
| Eric Swalwell | <1% | n/a |
| Marianne Williamson | <1% | <1% |
| Michael Bennet | 0% | <1% |
| Steve Bullock | 0% | 0% |
| John Delaney | 0% | 0% |
| Tulsi Gabbard | 0% | <1% |
| (VOL) Other | 1% | <1% |
| (VOL) No one | 3% | 2% |
| Mike Bloomberg | n/a | 2% |
| Sherrod Brown | n/a | 2% |
| Eric Holder | n/a | <1% |
| (VOL) Undecided | 20% | 15% |
| (n) | (330) | (310) |
15. I’m going to read you the names of some people who are running or might run for president in 2020. Please tell me if your general impression of each is favorable or unfavorable, or if you don’t really have an opinion. If you have not heard of the person, just let me know. [NAMES WERE ROTATED]
|
TREND: | Favorable | Unfavorable | No opinion | Not heard of | (n) |
| Former Vice President Joe Biden | 72% | 16% | 12% | 1% | (330) |
| — March 2019 | 76% | 13% | 9% | 2% | (310) |
| –January 2019 | 80% | 9% | 8% | 3% | (313) |
| Vermont Senator Bernie Sanders | 65% | 21% | 13% | 1% | (330) |
| — March 2019 | 70% | 17% | 10% | 3% | (310) |
| — January 2019 | 68% | 19% | 9% | 4% | (313) |
| Massachusetts Senator Elizabeth Warren | 51% | 19% | 18% | 12% | (330) |
| — March 2019 | 49% | 19% | 15% | 17% | (310) |
| — January 2019 | 57% | 17% | 16% | 11% | (313) |
| Former Texas Congressman Beto O’Rourke | 43% | 12% | 22% | 23% | (330) |
| — March 2019 | 38% | 12% | 21% | 29% | (310) |
| — January 2019 | 41% | 9% | 23% | 27% | (313) |
| Minnesota Senator Amy Klobuchar | 27% | 13% | 28% | 32% | (330) |
| — March 2019 | 26% | 13% | 29% | 33% | (310) |
| — January 2019 | 23% | 8% | 30% | 39% | (313) |
| New Jersey Senator Cory Booker | 40% | 16% | 24% | 20% | (330) |
| — March 2019 | 43% | 12% | 20% | 25% | (310) |
| — January 2019 | 44% | 11% | 20% | 25% | (313) |
| California Senator Kamala Harris | 50% | 10% | 19% | 21% | (330) |
| — March 2019 | 53% | 11% | 16% | 20% | (310) |
| — January 2019 | 46% | 13% | 21% | 20% | (313) |
| South Bend, Indiana Mayor Pete Buttigieg | 35% | 6% | 25% | 34% | (330) |
| — March 2019 | — | — | — | — | — |
| — January 2019 | 8% | 6% | 27% | 58% | (313) |
[QUESTIONS 16 & 17 WERE ROTATED]
16. Would it be better for the Democrats to nominate a person of color or nominate a white candidate to run against Trump, or doesn’t this matter? [CHOICES WERE ROTATED]
|
April 2019 | |
| Nominate a person of color | 5% |
| Nominate a white candidate | 6% |
| Does not matter | 87% |
| (VOL) Depends on the candidate | 1% |
| (VOL) Don’t know | 1% |
| (n) | (330) |
17. Would it be better for the Democrats to nominate a woman or nominate a man to run against Trump, or doesn’t this matter? [CHOICES WERE ROTATED]
|
April 2019 | |
| Nominate a woman | 7% |
| Nominate a man | 12% |
| Does not matter | 77% |
| (VOL) Depends on the candidate | 3% |
| (VOL) Don’t know | 1% |
| (n) | (330) |
[Q18-22 and 25-31 held for future release.]
[Q23-24 previously released.]
METHODOLOGY
The Monmouth University Poll was sponsored and conducted by the Monmouth University Polling Institute from April 11 to 15, 2019 with a national random sample of 801 adults age 18 and older, in English. This includes 320 contacted by a live interviewer on a landline telephone and 481 contacted by a live interviewer on a cell phone. The results in this poll release are based on a subsample of 330 registered voters who identify themselves as Democrats or lean toward the Democratic Party. Telephone numbers were selected through random digit dialing and landline respondents were selected with a modified Troldahl-Carter youngest adult household screen. Monmouth is responsible for all aspects of the survey design, data weighting and analysis. Final sample is weighted for region, age, education, gender and race based on US Census information. Data collection support provided by Braun Research (field) and Dynata (RDD sample). For results based on the Democratic voter sample, one can say with 95% confidence that the error attributable to sampling has a maximum margin of plus or minus 5.4 percentage points (unadjusted for sample design). Sampling error can be larger for sub-groups (see table below). In addition to sampling error, one should bear in mind that question wording and practical difficulties in conducting surveys can introduce error or bias into the findings of opinion polls.
| DEMOGRAPHICS (weighted) |
| DEMOCRATIC VOTERS |
| 37% Male |
| 63% Female |
| 27% 18-34 |
| 34% 35-54 |
| 39% 55+ |
| 58% White |
| 17% Black |
| 20% Hispanic |
| 5% Asian/Other |
| 64% No degree |
| 36% 4 year degree |
Click on pdf file link below for full methodology and crosstabs by key demographic groups.


