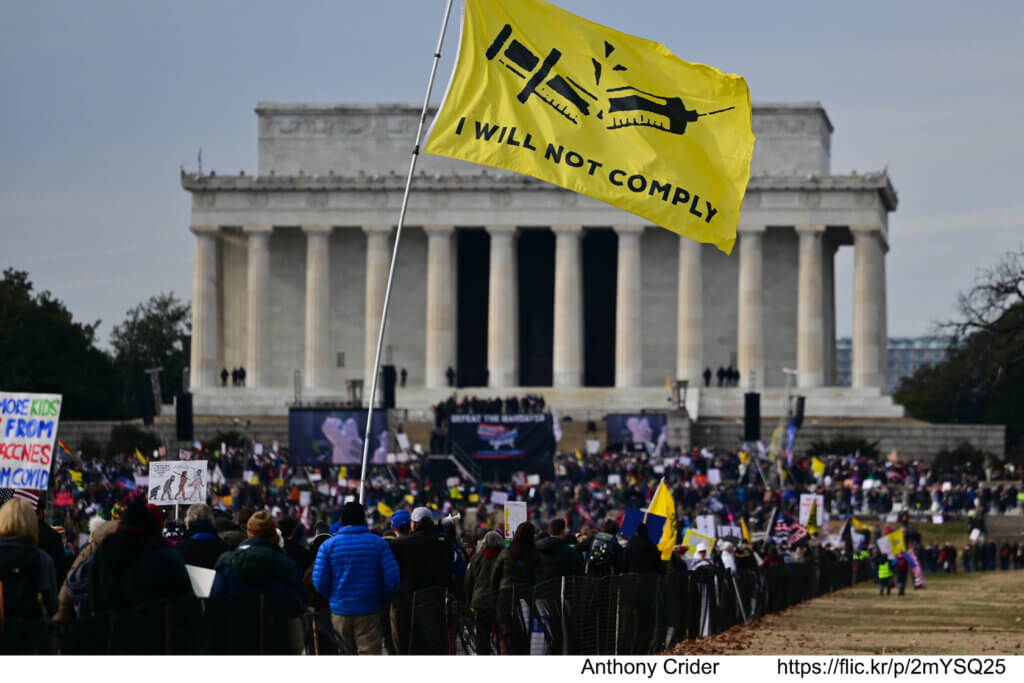
West Long Branch, NJ – Americans continue to be concerned about the spread of Covid, but the vast majority say it is time to accept it as part of life. The latest Monmouth (“Mon-muth”) University Poll finds a majority of the public continues to support some preventative measures, such as face mask and social distancing guidelines, but not others, such as workplace vaccine mandates. Also, faith in the ability of President Joe Biden and the federal government to get a handle on the pandemic continues to fade amid persistent opposition from nearly 1 in 5 American adults to getting vaccinated.
Fully 7 in 10 Americans (70%) agree with the sentiment that “it’s time we accept that Covid is here to stay and we just need to get on with our lives” – including 78% of those who report having gotten Covid and 65% of those who say they have not been infected. The main difference in the sense that it is time to move on is due to partisanship – ranging from 89% of Republicans and 71% of independents to 47% of Democrats. Only one-third of the public (34%) feels the country will get the outbreak under control and return to normal by the end of the year. In fact, more than 1 in 4 (28%) now believe a return to normalcy will never happen, which is up from 22% who felt this way in September and just 6% who were similarly pessimistic exactly a year ago.
“Americans’ worries about Covid haven’t gone away. It seems more to be a realization that we are not going to get this virus under control in a way that we thought was possible just last year,” said Patrick Murray, director of the independent Monmouth University Polling Institute.
Four in 10 Americans (40%) report that they have had Covid – or think they have had it – since the pandemic began, including 27% who said their infection was confirmed with a test. About one-third (36%) of people who have been vaccinated report also being infected with Covid (note: the poll did not ask whether infection occurred before or after vaccination) and about 6 in 10 (61%) of those who have not gotten a shot say they have been infected with the virus.
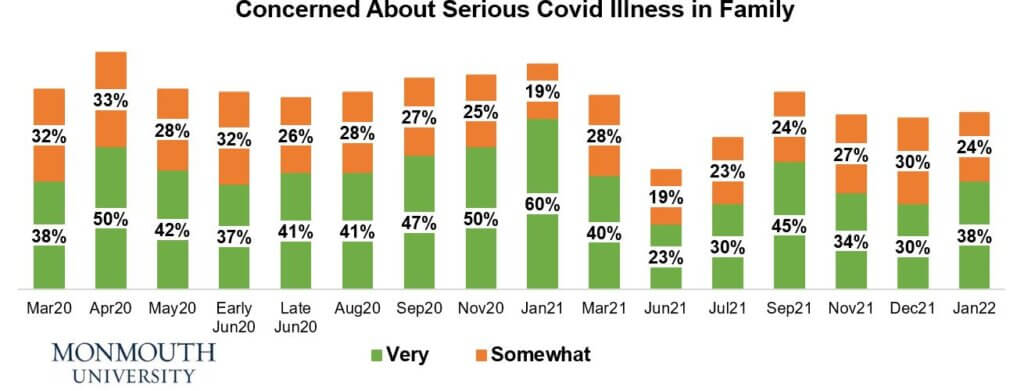
Half the public is either very (23%) or somewhat (27%) concerned about catching one of the new Covid variants. This concern includes 58% of those who have not had Covid, but also includes 38% of those who have already had it. The number of adults who are very concerned about catching a new variant is up somewhat from early December (14%) before the omicron variant really hit the U.S. Similarly, the number of people who are very concerned about a family member becoming seriously ill from the virus (38%) has increased since December (30%), but it is still lower than concern in September (45%) when the delta variant was spreading.
Even though concern about getting Covid has increased, a stable proportion of the public remains opposed to vaccination. While nearly half of American adults (45%) report getting a booster shot, a significant number (37%) remain unlikely to ever do so –which includes 17% who remain opposed even to getting the initial vaccination.
“A key factor in the public’s inclination to accept having to live with Covid is the intransigence of a sizable segment of the population on vaccination. It seems unlikely that herd immunity could ever be achieved through preventative measures,” said Murray.
The Monmouth University Poll also finds that just over half of Americans (52%) support instituting, or reinstituting, face mask and social distancing guidelines in their home state. This number is down from December (55%) and September (63%), but is the same as last July (52%) when Covid’s spread hit its lowest ebb so far. Less than half of the public (43%) supports requiring people to show proof of vaccination in order to work in an office or other setting where they are around other people. Support for this approach has declined steadily since September (53%), including 46% last month.
“We still see public support for maintaining some degree of public safety around Covid. However, there appears to be an acknowledgment that federal measures have not been effective, or at least have failed to be widely accepted,” said Murray.
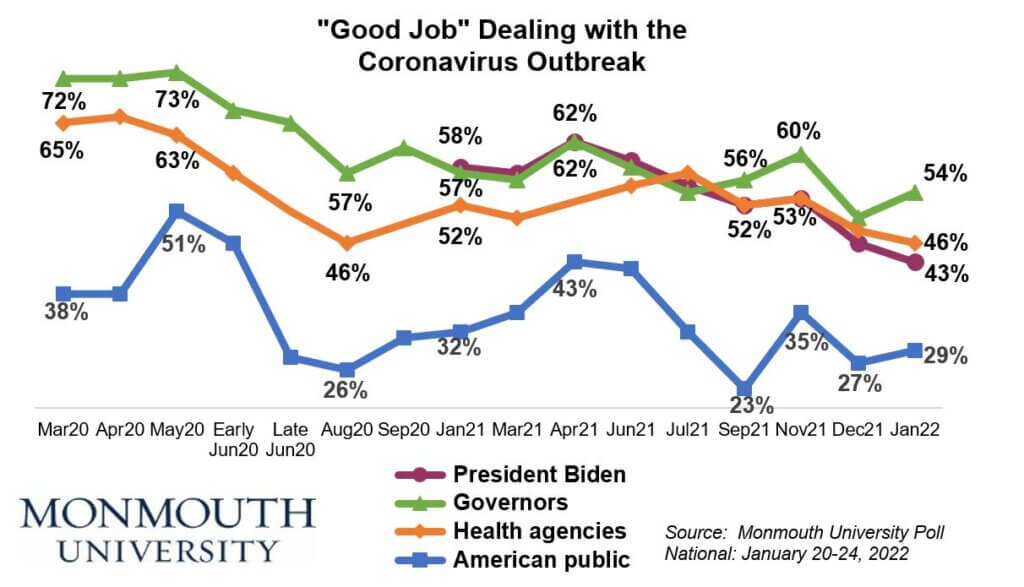
Ratings for how both the president and federal health agencies have handled the pandemic continue to slip. Just 43% say Biden has done a good job on this while 53% say he has done a bad job – the first time his rating on this metric has been underwater since he took office. Public opinion on the president’s handling of Covid was evenly split a month ago (46% good job and 46% bad job) and was consistently positive in polls prior to that. Views of federal health agencies’ handling of the pandemic have now dipped into negative territory (46% good job and 47% bad job) after declining but remaining positive a month ago (48% good and 41% bad).
At the same time, ratings for state governors’ Covid handling have improved slightly (54% good job and 41% bad job, compared with 50% good and 41% bad in December). Opinion on how the American public is dealing with the pandemic remains largely negative at 29% good job and 58% bad job (similar to 27% good and 56% bad in December).
The Monmouth University Poll was conducted by telephone from January 20 to 24, 2022 with 794 adults in the United States. The question results in this release have a margin of error of +/- 3.5 percentage points. The poll was conducted by the Monmouth University Polling Institute in West Long Branch, NJ.
QUESTIONS AND RESULTS
(* Some columns may not add to 100% due to rounding.)
[Q1-25 previously released.]
26.How concerned are you about someone in your family becoming seriously ill from the coronavirus outbreak – very concerned, somewhat concerned, not too concerned, or not at all concerned?
| TREND: | Jan. 2022 | Dec. 2021 | Nov. 2021 | Sept. 2021 | July 2021 | June 2021 | March 2021 | Jan. 2021 |
| Very concerned | 38% | 30% | 34% | 45% | 30% | 23% | 40% | 60% |
| Somewhat concerned | 24% | 30% | 27% | 24% | 23% | 19% | 28% | 19% |
| Not too concerned | 19% | 20% | 22% | 17% | 21% | 24% | 14% | 12% |
| Not at all concerned | 17% | 19% | 15% | 12% | 24% | 32% | 16% | 7% |
| (VOL) Don’t know | 0% | 0% | 1% | 1% | 0% | 1% | 0% | 0% |
| (VOL) Has already happened | 1% | 1% | 1% | 1% | 2% | 1% | 2% | 2% |
| (n) | (794) | (808) | (811) | (802) | (804) | (810) | (802) | (809) |
| TREND: Continued | Nov. 2020 | Early Sept. 2020 | Aug. 2020 | Late June 2020 | Early June 2020 | May 2020 | April 2020 | March 2020 |
| Very concerned | 50% | 47% | 41% | 41% | 37% | 42% | 50% | 38% |
| Somewhat concerned | 25% | 27% | 28% | 26% | 32% | 28% | 33% | 32% |
| Not too concerned | 13% | 13% | 18% | 17% | 14% | 14% | 9% | 18% |
| Not at all concerned | 10% | 12% | 13% | 15% | 16% | 16% | 7% | 12% |
| (VOL) Don’t know | 0% | 0% | 0% | 0% | 0% | 0% | 0% | 0% |
| (VOL) Has already happened | 1% | 0% | 1% | 1% | 0% | 0% | 0% | n/a |
| (n) | (810) | (867) | (868) | (867) | (807) | (808) | (857) | (851) |
27.At any time during the pandemic, did you ever have Covid or think you had Covid? [If YES: Was your Covid status confirmed with a test, were you given the diagnosis by a medical professional without a test, or did you just know you had Covid?]
| Jan. 2022 | |
| Yes, confirmed with a test | 27% |
| Yes, given the diagnosis without a test | 2% |
| Yes, just knew had Covid | 11% |
| No, have not had Covid | 59% |
| (VOL) Don’t know | 1% |
| (n) | (794) |
28.How concerned are you personally about catching one of the new variants of the Covid virus – very concerned, somewhat concerned, not too concerned, or not at all concerned?
| TREND: | Jan. 2022 | Dec. 2021 | July 2021 |
| Very concerned | 23% | 14% | 18% |
| Somewhat concerned | 27% | 32% | 30% |
| Not too concerned | 19% | 31% | 24% |
| Not at all concerned | 31% | 22% | 28% |
| (VOL) Don’t know | 0% | 1% | 0% |
| (VOL) Has already happened | 1% | 1% | 0% |
| (n) | (794) | (808) | (804) |
29.Please tell me if each of the following has done a good job or bad job dealing with the coronavirus outbreak. [ITEMS WERE ROTATED]
| TREND: | Good Job | Bad Job | (VOL) Mixed, depends | (VOL) Don’t know | (n) |
| President Biden | 43% | 53% | 3% | 1% | (794) |
| — December 2021 | 46% | 46% | 4% | 4% | (808) |
| — November 2021 | 53% | 41% | 2% | 3% | (811) |
| — September 2021 | 52% | 43% | 4% | 1% | (802) |
| — July 2021 | 55% | 38% | 4% | 3% | (804) |
| — June 2021 | 59% | 32% | 4% | 5% | (810) |
| — April 2021 | 62% | 31% | 3% | 3% | (800) |
| — March 2021 | 57% | 31% | 3% | 8% | (802) |
| — January 2021 | 58% | 23% | 5% | 15% | (809) |
| Your state’s governor | 54% | 41% | 3% | 2% | (794) |
| — December 2021 | 50% | 41% | 5% | 3% | (808) |
| — November 2021 | 60% | 35% | 3% | 3% | (811) |
| — September 2021 | 56% | 38% | 3% | 3% | (802) |
| — July 2021 | 54% | 42% | 3% | 2% | (804) |
| — June 2021 | 58% | 33% | 5% | 4% | (810) |
| — April 2021 | 62% | 34% | 3% | 2% | (800) |
| — March 2021 | 56% | 38% | 3% | 2% | (802) |
| — January 2021 | 57% | 38% | 3% | 2% | (809) |
| — Early September 2020 | 61% | 35% | 3% | 1% | (867) |
| — August 2020 | 57% | 35% | 5% | 3% | (868) |
| — Late June 2020 | 65% | 28% | 5% | 2% | (867) |
| — Early June 2020 | 67% | 28% | 3% | 1% | (807) |
| — May 2020 | 73% | 22% | 3% | 2% | (808) |
| — April 2020 | 72% | 21% | 4% | 3% | (857) |
| — March 2020 | 72% | 18% | 4% | 6% | (851) |
| The American public | 29% | 58% | 9% | 3% | (794) |
| — December 2021 | 27% | 56% | 12% | 5% | (808) |
| — November 2021 | 35% | 55% | 7% | 3% | (811) |
| — September 2021 | 23% | 65% | 10% | 2% | (802) |
| — July 2021 | 32% | 51% | 12% | 5% | (804) |
| — June 2021 | 42% | 40% | 14% | 4% | (810) |
| — April 2021 | 43% | 44% | 10% | 4% | (800) |
| — March 2021 | 35% | 53% | 11% | 1% | (802) |
| — January 2021 | 32% | 60% | 6% | 2% | (809) |
| — Early September 2020 | 31% | 57% | 10% | 2% | (867) |
| — August 2020 | 26% | 62% | 11% | 1% | (868) |
| — Late June 2020 | 28% | 59% | 11% | 3% | (867) |
| — Early June 2020 | 46% | 43% | 8% | 2% | (807) |
| — May 2020 | 51% | 33% | 13% | 2% | (808) |
| — April 2020 | 38% | 48% | 12% | 2% | (857) |
| — March 2020 | 38% | 45% | 14% | 3% | (851) |
| Health agencies in the federal government | 46% | 47% | 5% | 2% | (794) |
| — December 2021 | 48% | 41% | 6% | 5% | (808) |
| — November 2021 | 53% | 38% | 5% | 4% | (811) |
| — September 2021 | 52% | 38% | 6% | 3% | (802) |
| — July 2021 | 57% | 33% | 7% | 3% | (804) |
| — June 2021 | 55% | 33% | 6% | 5% | (810) |
| — April 2021 | n/a | n/a | n/a | n/a | n/a |
| — March 2021 | 50% | 37% | 8% | 5% | (802) |
| — January 2021 | 52% | 40% | 6% | 3% | (809) |
| — Early September 2020 | n/a | n/a | n/a | n/a | n/a |
| — August 2020 | 46% | 43% | 6% | 4% | (868) |
| — Late June 2020 | n/a | n/a | n/a | n/a | n/a |
| — Early June 2020 | 57% | 34% | 5% | 3% | (807) |
| — May 2020 | 63% | 25% | 7% | 4% | (808) |
| — April 2020 | 66% | 25% | 4% | 4% | (857) |
| — March 2020 | 65% | 24% | 8% | 4% | (851) |
30.Do you support or oppose instituting, or reinstituting, face mask and social distancing guidelines in your state at the current time?
| TREND: | Jan. 2022 | Dec. 2021 | Sept. 2021 | July 2021 |
| Support | 52% | 55% | 63% | 52% |
| Oppose | 45% | 42% | 34% | 46% |
| (VOL) Depends | 1% | 2% | 2% | n/a |
| (VOL) Don’t know | 2% | 2% | 1% | 2% |
| (n) | (794) | (808) | (802) | (804) |
31.Do you support or oppose requiring people to show proof of vaccination in order to go to work in an office or setting where they are around other people?
| TREND: | Jan. 2022 | Dec. 2021 | Nov. 2021 | Sept. 2021 |
| Support | 43% | 46% | 51% | 53% |
| Oppose | 53% | 50% | 47% | 45% |
| (VOL) Depends | 2% | 2% | 2% | 2% |
| (VOL) Don’t know | 2% | 2% | 1% | 1% |
| (n) | (794) | (808) | (811) | (802) |
32.When do you think the country will get the outbreak under control and be able to return to normal – in the next month or two, by the summer, before the end of the year, later than that, or never?
| TREND: | Jan. 2022 | March 2021 | Jan. 2021 |
| In the next month or two | 6% | 4% | 6% |
| By the summer | 13% | 17% | 23% |
| Before the end of the year | 15% | 40% | 39% |
| Later than that | 32% | 27% | 24% |
| Never | 28% | 9% | 6% |
| (VOL) Don’t know | 5% | 4% | 2% |
| (n) | (794) | (802) | (809) |
33.Do you tend to agree or disagree with the following statement: “It’s time we accept that Covid is here to stay and we just need to get on with our lives.”?
| Jan. 2022 | |
| Agree | 70% |
| Disagree | 28% |
| (VOL) Depends | 2% |
| (VOL) Don’t know | 1% |
| (n) | (794) |
34.Have you received at least one dose of Covid vaccine, or not? [If NOT:] Do you plan to get the Covid vaccine as soon as possible, will you continue to let other people get it first to see how it goes, or is it likely you will never get the vaccine if you can avoid it?
| TREND: | Jan. 2022 | Dec. 2021 | Nov. 2021 | Sept. 2021 | July 2021 | June 2021 | April 2021 | March 2021 | Jan. 2021 |
| Already received vaccine | 77% | 78% | 80% | 75% | 68% | 66% | 51% | 16%* | 6%* |
| As soon as possible | 1% | 0% | 1% | 2% | 2% | 2% | 14% | 38% | 50% |
| See how it goes | 3% | 5% | 4% | 6% | 9% | 9% | 12% | 21% | 19% |
| Likely will never get vaccine | 17% | 14% | 13% | 15% | 17% | 21% | 21% | 24% | 24% |
| (VOL) Don’t know | 3% | 3% | 3% | 2% | 4% | 2% | 2% | 1% | 2% |
| (n) | (794) | (808) | (811) | (802) | (804) | (810) | (800) | (802) | (809) |
* January/March 2021 polls did not specifically ask if person already got the vaccine, but included it as a volunteered response.
35.Have you received a booster shot of the Covid vaccine, or not? [If NOT:] How likely are you to get a booster shot of the vaccine – very likely, somewhat likely, not too likely, or not at all likely?
| TREND: | Jan. 2022 | Dec. 2021 | Nov. 2021 | Sept. 2021** |
| Already received booster | 45% | 24% | 10%* | 1%* |
| Very likely | 11% | 27% | 41% | 51% |
| Somewhat likely | 7% | 13% | 14% | 16% |
| Not too likely | 7% | 6% | 8% | 6% |
| Not at all likely | 10% | 10% | 9% | 9% |
| (VOL) Don’t know | 0% | 1% | 2% | 1% |
| Likely will never get vaccine (from Q34) | 20% | 17% | 16% | 17% |
| (n) | (794) | (808) | (811) | (802) |
* September/November 2021 polls did not specifically ask if person already got the booster, but included it as a volunteered response.
** September 2021 question included “…if it is made available.”
[Q36-42 held for future release.]
METHODOLOGY
The Monmouth University Poll was sponsored and conducted by the Monmouth University Polling Institute from January 20 to 24, 2022 with a probability-based national random sample of 794 adults age 18 and older. This includes 267 contacted by a live interviewer on a landline telephone and 527 contacted by a live interviewer on a cell phone, in English. Telephone numbers were selected through a mix of random digit dialing and list-based sampling. Landline respondents were selected with a modified Troldahl-Carter youngest adult household screen. Interviewing services were provided by Braun Research, with sample obtained from Dynata (RDD, n=476), Aristotle (list, n=119) and a panel of prior Monmouth poll participants (n=199). Monmouth is responsible for all aspects of the survey design, data weighting and analysis. The full sample is weighted for region, age, education, gender and race based on US Census information (ACS 2018 one-year survey). For results based on this sample, one can say with 95% confidence that the error attributable to sampling has a maximum margin of plus or minus 3.5 percentage points (unadjusted for sample design). Sampling error can be larger for sub-groups (see table below). In addition to sampling error, one should bear in mind that question wording and practical difficulties in conducting surveys can introduce error or bias into the findings of opinion polls.
| DEMOGRAPHICS (weighted) |
| Self-Reported |
| 31% Republican |
| 43% Independent |
| 26% Democrat |
| 49% Male |
| 51% Female |
| 30% 18-34 |
| 33% 35-54 |
| 38% 55+ |
| 63% White |
| 12% Black |
| 16% Hispanic |
| 9% Asian/Other |
| 68% No degree |
| 32% 4 year degree |
Click on pdf file link below for full methodology and crosstabs by key demographic groups.


