
West Long Branch, NJ – A clear majority of Americans support the second impeachment of former president Donald Trump. A majority also wants the Senate to convict him and bar him from holding office in the future according to the latest Monmouth (“Mon-muth”) University Poll, although most Republicans remain in his corner. Confidence in the 2020 election has ticked up since November, although a third of the public continues to believe that Joe Biden only won the presidency due to voter fraud. The poll also finds that Trump ended his presidency with a midrange approval rating but a high-end disapproval number.
A majority (56%) of Americans approve of the House of Representatives impeaching Trump for incitement of insurrection, while 42% disapprove. When the House impeached Trump the first time, 53% approved and 46% disapproved (January 2020). Partisan approval for the second impeachment stands at 92% among Democrats (versus 94% one year ago for the first impeachment), 52% among independents (51% in January 2020), and 13% among Republicans (versus 8% in January 2020).
When asked to characterize the incitement of insurrection charge, 53% say Trump’s conduct was definitely grounds for impeachment, 30% say some of his conduct was improper but did not rise to the level of impeachment, and 15% maintain he did nothing wrong. After Trump was acquitted in his first impeachment trial last year, 46% said his actions in that case were impeachable, 30% said they were improper but not impeachable, and 22% said he did nothing wrong (February 2020). Currently, 36% of Republicans say Trump did nothing wrong regarding the insurrection charge, which is down from 56% who said he did nothing wrong regarding the first impeachment charges of abuse of power and obstruction of Congress.
“There is somewhat more agreement that Trump did something wrong than there was with the first impeachment. But there are still a good number of Republican stalwarts who continue to stand with the former president regardless,” said Patrick Murray, director of the independent Monmouth University Polling Institute.
Just over half (52%) of the American public wants the U.S. Senate to convict Trump on the impeachment charge, while 44% do not. As a point of comparison, 49% supported removing Trump from office via impeachment in January 2020, while 48% were opposed. Of course, Trump cannot be removed from office now, but he can be barred from holding federal office in the future. Support for the Senate taking this action stands at 57%, compared with 41% who oppose this move. This latter action needs to be preceded by an impeachment conviction. When the small number of poll participants who initially opposed conviction but favored a ban on future office-holding were informed of this fact, support for conviction on the impeachment charge increased by three points to 55%.
The impeachment charge is tied to false claims designed to undermine public faith in the 2020 presidential election. Currently, 54% are very confident that the election was conducted fairly and accurately, which is up from 44% in mid-November. Another 12% are somewhat confident and 9% are not too confident, while 25% remain not at all confident – which is down slightly from 29% in November.
Despite the increase in confidence about the election, about one-third (32%) of the public believe that Biden only won the election due to voter fraud, while 65% believe he won it “fair and square.” This result is virtually unchanged from November when 34% believed that fraud determined the outcome or that Biden’s victory would be overturned. Fully 72% of Republicans persist in believing that Biden’s win is due to voter fraud. Among Americans who still believe Trump lost due to fraud, nearly two-thirds say it is time to move on, but one-third of this group – which equates to 10% of all American adults – say they will never accept Biden as president.
“A number of ostensible leaders in the Republican Party continue to peddle this false narrative and many more who know this claim is wrong have not been particularly outspoken in disavowing it. Their fellow partisans in the American public are simply following that lead,” said Murray.
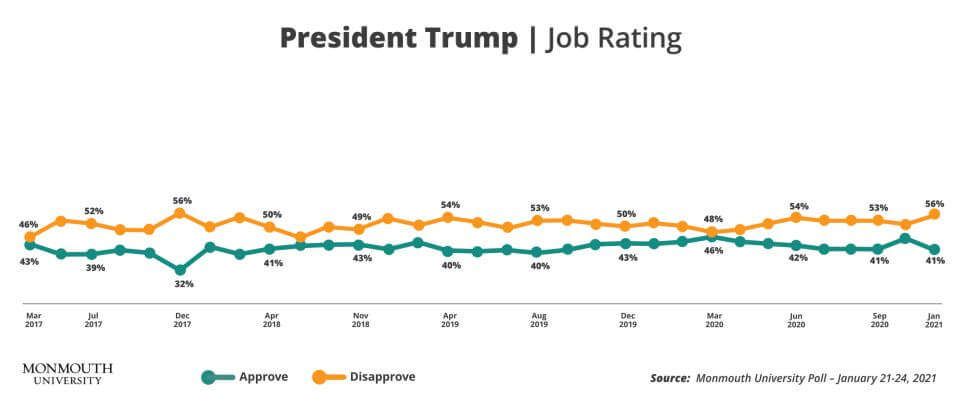
Trump ended his term with a job rating of 41% approve and 56% disapprove. His final approval rating stands at about the midpoint of where it ranged in Monmouth’s polling, which was generally between 39% and 44% throughout his term. The only exceptions to this were high points of 46% recorded in both March 2020 (as the coronavirus pandemic first hit) and November 2020 (just after the election) and a low point of 32% in December 2017 (when it looked like his hallmark tax plan was about to fall apart and the federal government was headed for a shutdown). The former president’s final disapproval rating of 56%, though, matches his previous record number holding that view (December 2017). Otherwise, disapproval of Trump ranged from 46% to 54% according to 31 national polls conducted by Monmouth during his presidency.
“Not once during Trump’s term did he have a majority of Americans behind him. And yet, a sizable share of the public still gives him at least a nominal thumbs up despite the chaos of the last four years. On this metric alone, this has to go down as one of the most – if not the most – divisive presidencies in our nation’s history,” said Murray.
The Monmouth University Poll was conducted by telephone from January 21 to 24, 2021 with 809 adults in the United States. The question results in this release have a margin of error of +/- 3.5 percentage points. The poll was conducted by the Monmouth University Polling Institute in West Long Branch, NJ.
QUESTIONS AND RESULTS
(* Some columns may not add to 100% due to rounding.)
[Q1-6 held for future release.]
7.Do you approve or disapprove of the job Donald Trump did as president?*
| TREND: | Jan. 2021 | Nov. 2020 | Early Sept. 2020 | Aug. 2020 | Late June 2020 | Early June 2020 | May 2020 | April 2020 | March 2020 | Feb. 2020 | Jan. 2020 |
| Approve | 41% | 46% | 41% | 41% | 41% | 42% | 43% | 44% | 46% | 44% | 43% |
| Disapprove | 56% | 51% | 53% | 53% | 53% | 54% | 51% | 49% | 48% | 50% | 52% |
| (VOL) No opinion | 3% | 3% | 5% | 7% | 7% | 4% | 6% | 6% | 6% | 5% | 5% |
| (n) | (809) | (810) | (867) | (868) | (867) | (807) | (808) | (857) | (851) | (902) | (903) |
| TREND: Continued | Dec. 2019 | Nov. 2019 | Sept. 2019 | Aug. 2019 | June 2019 | May 2019 | April 2019 | March 2019 | Jan. 2019 | Nov. 2018 | Aug. 2018 | June 2018 | April 2018 | March 2018 | Jan. 2018 |
| Approve | 43% | 43% | 41% | 40% | 41% | 40% | 40% | 44% | 41% | 43% | 43% | 43% | 41% | 39% | 42% |
| Disapprove | 50% | 51% | 53% | 53% | 50% | 52% | 54% | 51% | 54% | 49% | 50% | 46% | 50% | 54% | 50% |
| (VOL) No opinion | 8% | 6% | 6% | 7% | 9% | 8% | 6% | 5% | 5% | 8% | 7% | 11% | 9% | 8% | 8% |
| (n) | (903) | (908) | (1,161) | (800) | (751) | (802) | (801) | (802) | (805) | (802) | (805) | (806) | (803) | (803) | (806) |
| TREND: Continued | Dec. 2017 | Sept. 2017 | Aug. 2017 | July 2017 | May 2017 | March 2017 |
| Approve | 32% | 40% | 41% | 39% | 39% | 43% |
| Disapprove | 56% | 49% | 49% | 52% | 53% | 46% |
| (VOL) No opinion | 12% | 11% | 10% | 9% | 8% | 11% |
| (n) | (806) | (1,009) | (805) | (800) | (1,002) | (801) |
*Question wording prior to 2021 was “…is doing as president?”
[Q8-19 held for future release.]
20.Overall, how confident are you that the 2020 election was conducted fairly and accurately – very confident, somewhat confident, not too confident, or not at all confident?
| TREND: | Jan. 2021 | Nov. 2020 | PRIOR:* | Late Sept. 2020* | Early Sept. 2020* | Aug. 2020* |
| Very confident | 54% | 44% | 24% | 22% | 21% | |
| Somewhat confident | 12% | 16% | 36% | 39% | 42% | |
| Not too confident | 9% | 9% | 27% | 24% | 24% | |
| Not at all confident | 25% | 29% | 12% | 13% | 12% | |
| (VOL) Don’t know | 0% | 1% | 1% | 1% | 1% | |
| (n) | (809) | (810) | (809) | (758) | (785) |
* Prior polls asked registered voters only how confident they were “that the November election will be conducted fairly….”
21.Do you believe Joe Biden won this election fair and square, or do you believe that he only won it due to voter fraud?
| TREND: | Jan. 2021 | Nov. 2020 |
| Fair and square | 65% | 60% |
| Due to voter fraud | 32% | 32% |
| (VOL) Biden won’t be declared | n/a | 2% |
| (VOL) Don’t know | 3% | 6% |
| (n) | (809) | (810) |
[The following question was asked only of those who said Biden won due to voter fraud to Q21; n=238, m.o.e.=+/-6.4%.]
21A.Now that Biden is in office do you feel it is time to move on or will you never accept Biden as president?
| Jan. 2021 | |
| Time to move on | 63% |
| Will never accept Biden as president | 32% |
| (VOL) Don’t know | 5% |
| (n) | (238) |
22.Do you approve or disapprove of the House of Representatives decision earlier this month to impeach former President Trump for incitement of insurrection?
| COMPARISON: | Trump’s first impeachment | ||
| Jan. 2021 | Feb. 2020 | Jan. 2020 | |
| Approve | 56% | 51% | 53% |
| Disapprove | 42% | 46% | 46% |
| (VOL) Don’t know | 2% | 2% | 1% |
| (n) | (809) | (902) | (903) |
23.Which of the following comes closest to how you feel about the impeachment charge: A. Trump did nothing wrong; B. Some of Trump’s conduct was improper, but it did not rise to the level of impeachment; or C. Trump’s conduct was definitely grounds for impeachment?
| COMPARISON: | Trump’s first impeachment | |
| Jan. 2021 | Feb. 2020 | |
| A. Trump did nothing wrong | 15% | 22% |
| B. Improper, but not to level of impeachment | 30% | 30% |
| C. Definitely grounds for impeachment | 53% | 46% |
| (VOL) Don’t know | 2% | 2% |
| (n) | (809) | (902) |
24.Do you want the U.S. Senate to convict or not convict Donald Trump on this impeachment charge?
| Jan. 2021 | |
| Convict | 52% |
| Not convict | 44% |
| (VOL) Don’t know | 4% |
| (n) | (809) |
25.Would you favor or oppose the U.S. Senate barring Donald Trump from holding any federal office in the future?
| Jan. 2021 | |
| Favor | 57% |
| Oppose | 41% |
| (VOL) Don’t know | 2% |
| (n) | (809) |
[Q26-40 held for future release.]
METHODOLOGY
The Monmouth University Poll was sponsored and conducted by the Monmouth University Polling Institute from January 21 to 24, 2021 with a national random sample of 809 adults age 18 and older. This includes 298 contacted by a live interviewer on a landline telephone and 511 contacted by a live interviewer on a cell phone, in English. Telephone numbers were selected through random digit dialing and landline respondents were selected with a modified Troldahl-Carter youngest adult household screen. Monmouth is responsible for all aspects of the survey design, data weighting and analysis. The full sample is weighted for region, age, education, gender and race based on US Census information (ACS 2018 one-year survey). Data collection support provided by Braun Research (field) and Dynata (RDD sample). For results based on this sample, one can say with 95% confidence that the error attributable to sampling has a maximum margin of plus or minus 3.5 percentage points (unadjusted for sample design). Sampling error can be larger for sub-groups (see table below). In addition to sampling error, one should bear in mind that question wording and practical difficulties in conducting surveys can introduce error or bias into the findings of opinion polls.
| DEMOGRAPHICS (weighted) |
| Self-Reported |
| 25% Republican |
| 41% Independent |
| 34% Democrat |
| 49% Male |
| 51% Female |
| 30% 18-34 |
| 33% 35-54 |
| 37% 55+ |
| 64% White |
| 12% Black |
| 16% Hispanic |
| 8% Asian/Other |
| 70% No degree |
| 30% 4 year degree |
Click on pdf file link below for full methodology and crosstabs by key demographic groups.


