
West Long Branch, NJ – John Fetterman’s edge over Mehmet Oz on key issues in Pennsylvania’s U.S. Senate contest has narrowed, although the Democrat continues to be seen as having a better understanding of voters’ day-to-day concerns. The last Monmouth (“Mon-muth”) University Poll of this contest finds that concerns about Fetterman’s health, particularly in light of last week’s televised debate, have been raised by some voters, but the impact on their actual candidate choice has been minimal.
Nearly half of the electorate will either definitely (39%) or probably (9%) vote for Fetterman, which is similar to his support levels in prior Monmouth polls (48% total compared with 48% in early October and 49% in September). Oz, on the other hand, continues to make small but steady gains in support, with 32% definitely supporting him and 12% probably supporting. His combined 44% support level is about the same as 43% in early October and up from 39% in September, although it is worth noting that Oz’s “definite” support has increased by 7 points since early October, while Fetterman’s “definite” support has only gone up by 2 points. The increase in Oz’s overall backing has been most significant among independents, going from a combined 29% to 41% in Monmouth’s polling since September.
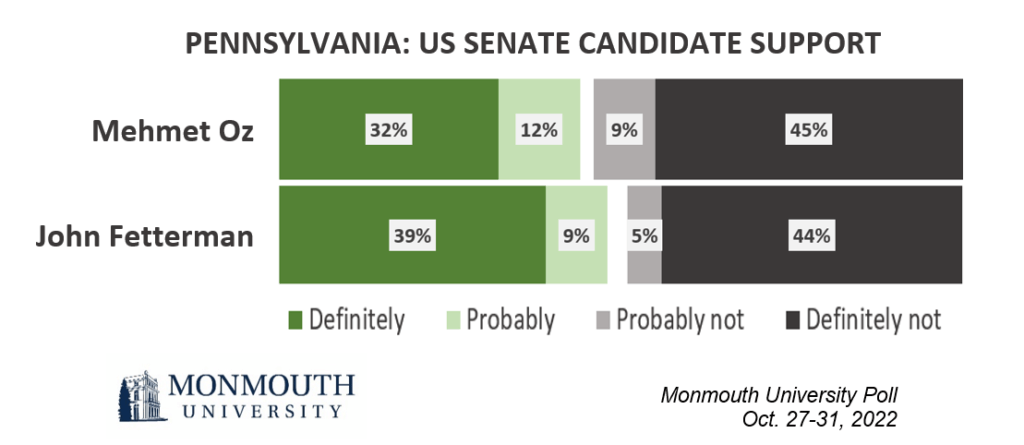
“The month-to-month shifts in support for Oz are not statistically significant. The overall trend suggests he has been chipping away with some voters who have not been completely comfortable with him, but that mainly happened prior to the debate. Fetterman’s performance may have had an impact on the margins but we don’t see any evidence of a wholesale shift in the race,” said Patrick Murray, director of the independent Monmouth University Polling Institute.
Nominally, more voters believe (48%) rather than disbelieve (38%) Fetterman’s explanation that his speaking problems do not affect his ability to think or do his job. Another 12% are unaware that Fetterman has had trouble speaking in public. In terms of direct impact, 3% of the Pennsylvania electorate – including 7% of independent voters – say they are reconsidering their candidate choice because of what they saw in last week’s debate. Another 22% say the debate raised serious concerns but did not cause them to reconsider their vote. Most voters either report no serious concerns from the debate (46%) or did not see or hear anything about the debate (27%). Still, fewer voters see Fetterman as capable of effectively serving a six-year senate term (48%) than say the same about Oz (59%).
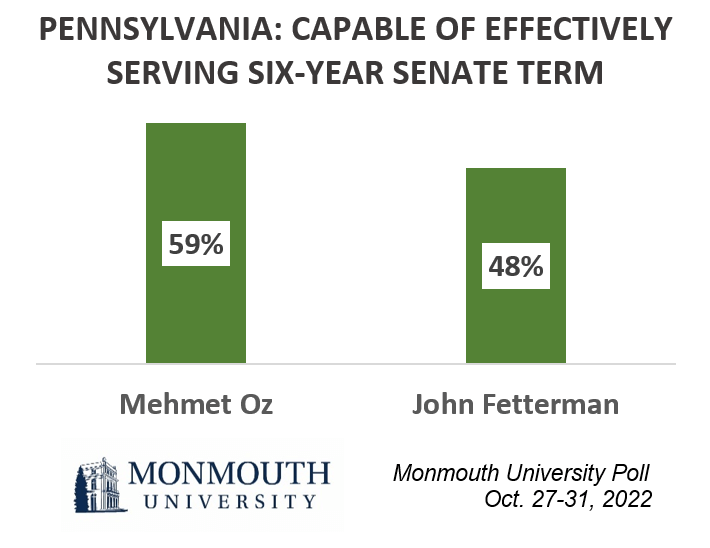
“We asked about each candidate’s ability to serve before we introduced any questions on Fetterman’s health issues in the poll. This means the differential response in these results is not a product of question priming, but rather suggests that at least some voters are considering the impact of his recent stroke. In the end, though, many other factors appear to be more pressing for voters,” said Murray.
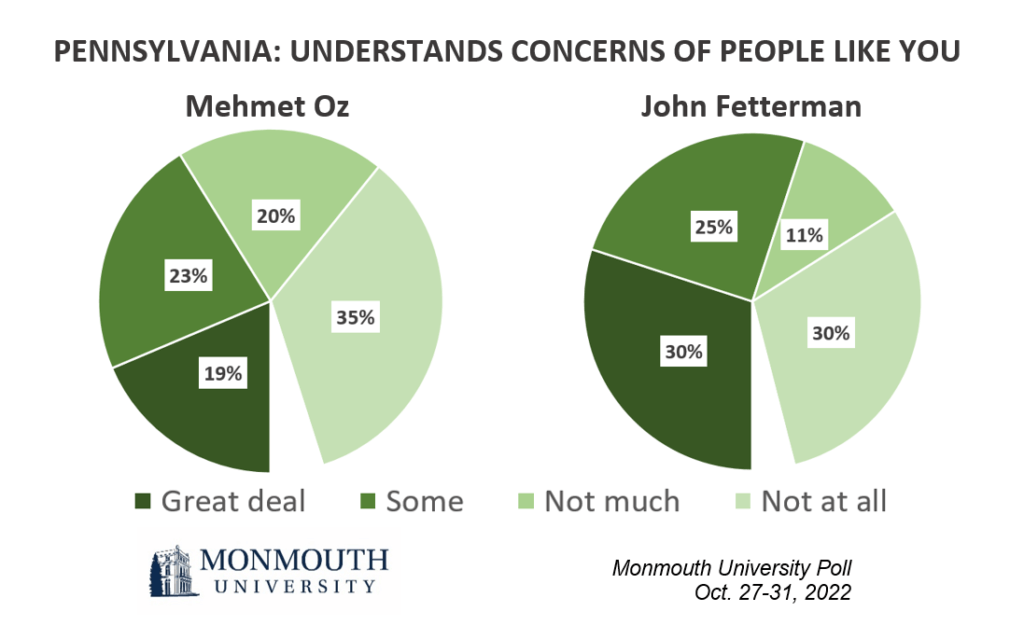
The poll finds that Fetterman’s issue advantage from earlier in the fall campaign has shrunk in some key areas. He still holds a small edge on being trusted more to handle jobs, the economy and cost of living – 46% to 38% for Oz – but he has lost his earlier leads on crime – now 42% Oz to 42% Fetterman – and immigration – 41% Oz to 37% Fetterman. On the other hand, Fetterman (55%) continues to outpace Oz (42%) for being seen as having at least some understanding of Pennsylvanians’ day-to-day concerns.
The poll does not attempt to predict turnout, but past voter history metrics and self-reported motivation give a picture of a range of possible outcomes. Among voters who participated in the 2020 presidential election, similar numbers definitely (39%) or probably (9%) support Fetterman as those who definitely (33%) or probably (12%) support Oz. The race is also close among those who voted in the 2018 “blue wave” midterm election, with support for Fetterman (42% definite and 7% probable) similar to that for Oz (35% definite and 10% probable). Among the 2 in 3 voters who are extremely motivated to turn out this year, support for Fetterman (46% definite and 5% probable) is slightly higher than for Oz (39% definite and 8% probable). Among voters who have already returned a mail ballot or intend to vote early – about one-quarter of the electorate – Fetterman has a clear edge with 68% backing him to just 25% for Oz. The Republican has greater support among those who plan to vote on Election Day – 52% compared with 41% who back the Democrat.
“Here’s your reminder that, regardless of the outcome, Oz will almost certainly have a lead in the Election Day vote tally. That gap will narrow and perhaps be overtaken as legally cast mail ballots are counted in the ensuing days. This fact won’t stop the conspiracy theorists, but there you have it,” said Murray.
Pennsylvania voters continue to have a largely negative view of the Republican nominee at 40% favorable and 53% unfavorable. Opinion is split on the Democrat at 47% favorable and 46% unfavorable. Both ratings have been fairly consistent throughout the fall campaign, with the exception of a small nominal shift in both Oz’s positives and Fetterman’s negatives; each has gone up by 4 points since September. Currently, 45% of voters have definitely ruled out voting for Oz and a similar 44% say the same for Fetterman. This number has been fairly consistent for the Republican all fall, although the current results represent a 6-point increase in opposition to the Democrat since September.
“Oz is hanging in this race despite the fact that most Pennsylvania voters don’t really like him,” said Murray.
Additionally, 4% of voters say they will definitely vote for a third-party candidate. These voters are equally divided between Democratic and Republican partisans, however, so it is not clear if they are drawing support away from one of the major party candidates more than the other.
In other poll results related to Fetterman’s health, more voters say he has been transparent about his current health status (50%) than say he has not been (41%). They are divided on whether there has been too much (31%), not enough (29%), or the right amount (29%) of media coverage of Fetterman’s health. More than 7 in 10 Pennsylvania voters personally know someone who has had stroke-related problems similar to Fetterman. However, this familiarity, or the lack thereof, has little impact on opinion about Fetterman’s health status or overall candidate support when controlling for partisanship.
The poll also finds Pennsylvania voters remain divided on their preference for which party should control Congress – 48% choose the Democrats and 45% choose the Republicans. Support for a GOP led Congress has dipped insignificantly by two points since early October while Democratic backing has held steady. In statistical terms, party preference for Congress has remained evenly divided throughout the fall.
The Monmouth University Poll was conducted by telephone from October 27 to 31, 2022 with 608 Pennsylvania registered voters. The question results in this release have a margin of error of +/- 4.5 percentage points for the full sample. The poll was conducted by the Monmouth University Polling Institute in West Long Branch, NJ.
QUESTIONS AND RESULTS
(* Some columns may not add to 100% due to rounding.)
1.Would you rather see the Republicans or the Democrats in control of Congress, or doesn’t this matter to you? [CHOICES WERE ROTATED] [If DOES NOT MATTER: If you had to lean one way or the other would you pick the Republicans or the Democrats?]
| TREND: | Late Oct. 2022 | Early Oct. 2022 | Sept. 2022 |
| Republicans | 41% | 41% | 40% |
| Not matter, but lean Rep | 4% | 6% | 7% |
| Democrats | 42% | 42% | 38% |
| Not matter, but lean Dem | 6% | 6% | 8% |
| Does not matter, no lean | 3% | 3% | 5% |
| (VOL) Don’t know | 3% | 1% | 1% |
| (n) | (608) | (610) | (605) |
2.Is it very important, somewhat important, or only a little important to have [Republicans/Democrats] in control of Congress? [CHOICE READ FROM Q1]
| TREND: | Late Oct. 2022 | Early Oct. 2022 | Sept. 2022 |
| Very important | 73% | 69% | 65% |
| Somewhat important | 14% | 18% | 18% |
| Only a little important | 6% | 6% | 8% |
| (VOL) Don’t know / Does not matter who controls Congress (from Q1) | 7% | 6% | 8% |
| (n) | (608) | (610) | (605) |
3/4.I am going to read you a list of candidates running for U.S. Senate in Pennsylvania this year. For each one, please tell me if you have definitely heard of them, not sure if you’ve heard of them, or if you’ve definitely not heard of them? [If DEFINITELY HEARD OF:] Do you have a very favorable, somewhat favorable, somewhat unfavorable, or very unfavorable opinion of them? [NAMES WERE ROTATED]
| TREND: | Very favorable | Somewhat favorable | Somewhat unfavorable | Very unfavorable | Heard of, no opinion (VOL) | Not sure if heard of | Definitely not heard of | (n) |
| Mehmet Oz, the Republican | 20% | 20% | 14% | 39% | 4% | 0% | 4% | (608) |
| — Early Oct. 2022 | 16% | 20% | 13% | 40% | 3% | 0% | 8% | (610) |
| — Sept. 2022 | 16% | 20% | 12% | 40% | 2% | 1% | 9% | (605) |
| John Fetterman, the Democrat | 27% | 20% | 9% | 37% | 3% | 1% | 3% | (608) |
| — Early Oct. 2022 | 30% | 18% | 8% | 36% | 3% | 2% | 2% | (610) |
| — Sept. 2022 | 29% | 18% | 11% | 31% | 3% | 1% | 7% | (605) |
[QUESTIONS 5 & 6 WERE ROTATED]
5.How likely are you to vote for Mehmet Oz in the election for U.S. Senate – will you definitely vote for him, probably vote for him, probably not vote for him, or definitely not vote for him?
| TREND: | Late Oct. 2022 | Early Oct. 2022 | Sept. 2022 |
| Definitely | 32% | 25% | 23% |
| Probably | 12% | 18% | 16% |
| Probably not | 9% | 8% | 11% |
| Definitely not | 45% | 46% | 45% |
| (VOL) Don’t know | 2% | 3% | 5% |
| (n) | (608) | (610) | (605) |
6.How likely are you to vote for John Fetterman in the election for U.S. Senate – will you definitely vote for him, probably vote for him, probably not vote for him, or definitely not vote for him?
| TREND: | Late Oct. 2022 | Early Oct. 2022 | Sept. 2022 |
| Definitely | 39% | 37% | 32% |
| Probably | 9% | 11% | 17% |
| Probably not | 5% | 7% | 9% |
| Definitely not | 44% | 40% | 38% |
| (VOL) Don’t know | 2% | 4% | 4% |
| (n) | (608) | (610) | (605) |
7.How likely are you to vote for one of the third party candidates running for U.S. Senate this year – will you definitely vote for one of them, probably vote for them, probably not vote for them, or definitely not vote for them?
| TREND: | Late Oct. 2022 | Early Oct. 2022 |
| Definitely | 4% | 4% |
| Probably | 10% | 13% |
| Probably not | 20% | 31% |
| Definitely not | 60% | 47% |
| (VOL) Don’t know | 5% | 6% |
| (n) | (608) | (610) |
[QUESTIONS 8 & 9 WERE ROTATED]
8.How much does Mehmet Oz understand the day to day concerns of people like you – a great deal, some, not much, or not at all?
| TREND: | Late Oct. 2022 | Early Oct. 2022 |
| Great deal | 19% | 15% |
| Some | 23% | 24% |
| Not much | 20% | 21% |
| Not at all | 35% | 37% |
| (VOL) Don’t know | 3% | 4% |
| (n) | (608) | (610) |
9.How much does John Fetterman understand the day to day concerns of people like you – a great deal, some, not much, or not at all?
| TREND: | Late Oct. 2022 | Early Oct. 2022 |
| Great deal | 30% | 34% |
| Some | 25% | 23% |
| Not much | 11% | 10% |
| Not at all | 30% | 28% |
| (VOL) Don’t know | 3% | 4% |
| (n) | (608) | (610) |
10.Who do you trust more on [READ ITEM] – Mehmet Oz, John Fetterman, both equally, or neither one? [ITEMS WERE ROTATED] [NAMES WERE ROTATED]
| TREND: | Mehmet Oz | John Fetterman | Both equally | Neither one | (VOL) Don’t know | (n) |
| Immigration | 41% | 37% | 5% | 13% | 5% | (608) |
| — Early Oct. 2022 | 37% | 41% | 5% | 14% | 3% | (610) |
| — Sept. 2022 | 34% | 34% | 4% | 21% | 7% | (605) |
| Gun control | 36% | 41% | 4% | 15% | 5% | (608) |
| — Early Oct. 2022 | 33% | 43% | 4% | 16% | 4% | (610) |
| — Sept. 2022 | 30% | 40% | 4% | 19% | 7% | (605) |
| Abortion | 34% | 47% | 3% | 13% | 3% | (608) |
| — Early Oct. 2022 | 29% | 48% | 3% | 16% | 5% | (610) |
| — Sept. 2022 | 26% | 44% | 2% | 21% | 7% | (605) |
| Jobs, the economy and cost of living | 38% | 46% | 3% | 12% | 2% | (608) |
| — Early Oct. 2022 | 36% | 45% | 5% | 12% | 2% | (610) |
| — Sept. 2022 | 36% | 41% | 4% | 16% | 4% | (605) |
| Defending your values | 38% | 43% | 4% | 13% | 1% | (608) |
| — Early Oct. 2022 | 34% | 44% | 4% | 16% | 2% | (610) |
| — Sept. 2022 | 34% | 43% | 2% | 17% | 3% | (605) |
| Crime | 42% | 42% | 5% | 10% | 1% | (608) |
| — Early Oct. 2022 | 38% | 45% | 3% | 11% | 3% | (610) |
| Elections and voting processes | 34% | 43% | 8% | 12% | 4% | (608) |
| — Early Oct. 2022 | 34% | 44% | 7% | 13% | 2% | (610) |
[Q11-18 held for future release.]
19.How motivated are you to vote in this year’s election – extremely motivated, very motivated, somewhat motivated, or not motivated?
| TREND: | Late Oct. 2022 | Early Oct. 2022 | Sept. 2022 |
| Extremely motivated | 66% | 70% | 64% |
| Very motivated | 19% | 17% | 21% |
| Somewhat motivated | 10% | 11% | 10% |
| Not motivated | 4% | 2% | 4% |
| (VOL) Don’t know | 0% | 0% | 1% |
| (n) | (608) | (610) | (605) |
20.Compared to past elections for U.S. Senate and Congress, are you more enthusiastic than usual, less enthusiastic, or about the same as past elections?
| TREND: | Late Oct. 2022 | Early Oct. 2022 | Sept. 2022 |
| More enthusiastic | 46% | 44% | 42% |
| Less enthusiastic | 12% | 10% | 10% |
| About the same | 42% | 46% | 48% |
| (VOL) Don’t know | 1% | 0% | 1% |
| (n) | (608) | (610) | (605) |
[Q21 held for future release.]
22.Have you already voted in the upcoming general election, or not? [If ALREADY VOTED:] How did you vote this year – in person at an early voting location or by mail ballot? [IF NOT VOTED YET:] How will you vote this year – in person on Election Day, in person at an early voting location, by mail ballot, or won’t you vote at all?
| TREND: | Late Oct. 2022 | Early Oct. 2022 |
| Will vote in person on Election Day | 72% | 75% |
| Already voted in person | 2% | n/a |
| Will vote in person early | 2% | 2% |
| Already voted by mail | 17% | n/a |
| Will vote by mail | 5% | 21% |
| Won’t vote at all | 1% | 1% |
| (VOL) Don’t know | 0% | 1% |
| (n) | (608) | (610) |
[QUESTIONS 23 & 24 WERE ROTATED]
23.Would you say Mehmet Oz is capable of effectively serving a six year term as senator, or not?
| Late Oct. 2022 | |
| Yes, is capable | 59% |
| No, is not | 39% |
| (VOL) Don’t know | 2% |
| (n) | (608) |
24.Would you say John Fetterman is capable of effectively serving a six year term as senator, or not?
| Late Oct. 2022 | |
| Yes, is capable | 48% |
| No, is not | 49% |
| (VOL) Don’t know | 3% |
| (n) | (608) |
25.Have you seen or heard anything about John Fetterman having trouble speaking in public, or have you not heard anything about this?
| Late Oct. 2022 | |
| Yes, heard | 88% |
| No, not heard | 12% |
| (n) | (608) |
26.Fetterman says his speaking problems are the result of a stroke and they do not affect his ability to think or carry out his job. Do you tend to believe Fetterman’s description of his condition, or not?
| Late Oct. 2022 | |
| Yes, believe | 48% |
| No, not believe | 38% |
| (VOL) Don’t know | 3% |
| Not aware (from Q25) | 12% |
| (n) | (608) |
27.Did you see or hear any part of Tuesday’s televised debate between Fetterman and Oz? [If YES:] Did what you see or hear cause you to reconsider who you might support in this election, give you serious concerns but not change your mind about your vote, or not give you serious concerns?
| Late Oct. 2022 | |
| Yes, reconsider support | 3% |
| Yes, serious concern, but not change vote | 22% |
| Yes, not serious concern | 46% |
| (VOL) Don’t know | 1% |
| Did not see/hear debate | 27% |
| (n) | (608) |
28.Do you feel John Fetterman has been transparent about his current health status, or not?
| Late Oct. 2022 | |
| Transparent | 50% |
| Not | 41% |
| (VOL) Don’t know | 8% |
| (n) | (608) |
29.Do you think the media coverage of Fetterman’s health has been too much, the right amount, or not enough?
| Late Oct. 2022 | |
| Too much | 31% |
| Right amount | 29% |
| Not enough | 29% |
| (VOL) Don’t know | 10% |
| (n) | (608) |
30.Have you personally known someone who suffered from a stroke and had similar problems to Fetterman’s, or have you not personally known someone in this situation?
| Late Oct. 2022 | |
| Yes | 72% |
| No | 23% |
| (VOL) Don’t know | 5% |
| (n) | (608) |
METHODOLOGY
The Monmouth University Poll was sponsored and conducted by the Monmouth University Polling Institute from October 27 to 31, 2022 with a probability-based random sample of 608 Pennsylvania voters drawn from a list of active registered voters who participated in at least one general election since 2016 or have newly registered since the 2020 election. This includes 182 contacted by a live interviewer on a landline telephone and 426 contacted by a live interviewer on a cell phone, in English. Monmouth is responsible for all aspects of the survey design, data weighting and analysis. The full sample is weighted for party registration, age, gender, race, education, and region based on state voter registration list information and U.S. Census information (CPS 2018 supplement). Data collection support provided by Braun Research (field) and Aristotle (voter sample). For results based on this sample, one can say with 95% confidence that the error attributable to sampling has a maximum margin of plus or minus 4.5 percentage points (adjusted for sample design effects). Sampling error can be larger for sub-groups (see table below). In addition to sampling error, one should bear in mind that question wording and practical difficulties in conducting surveys can introduce error or bias into the findings of opinion polls.
| DEMOGRAPHICS (weighted) |
| REGISTERED VOTERS |
| Party Registration |
| 42% Republican |
| 14% Other/none |
| 44% Democrat |
| Self-Reported Party |
| 37% Republican |
| 27% Independent |
| 36% Democrat |
| 48% Male |
| 52% Female |
| 21% 18-34 |
| 22% 35-49 |
| 29% 50-64 |
| 28% 65+ |
| 83% White, non-Hispanic |
| 10% Black |
| 5% Hispanic |
| 2% Asian/other |
| 63% No degree |
| 37% 4 year degree |
Click on pdf file link below for full methodology and crosstabs by key demographic groups.