
West Long Branch, NJ – Most Pennsylvania voters hold a positive view of Josh Shapiro, the Democratic candidate for governor, while opinion of Republican Doug Mastriano is generally negative. The Monmouth (“Mon-muth”) University Poll finds that support in their respective partisan bases is stronger for Shapiro than it is for Mastriano. As the state legislature considers a constitutional amendment removing the right to abortion, most voters say they are satisfied with current laws as they stand.
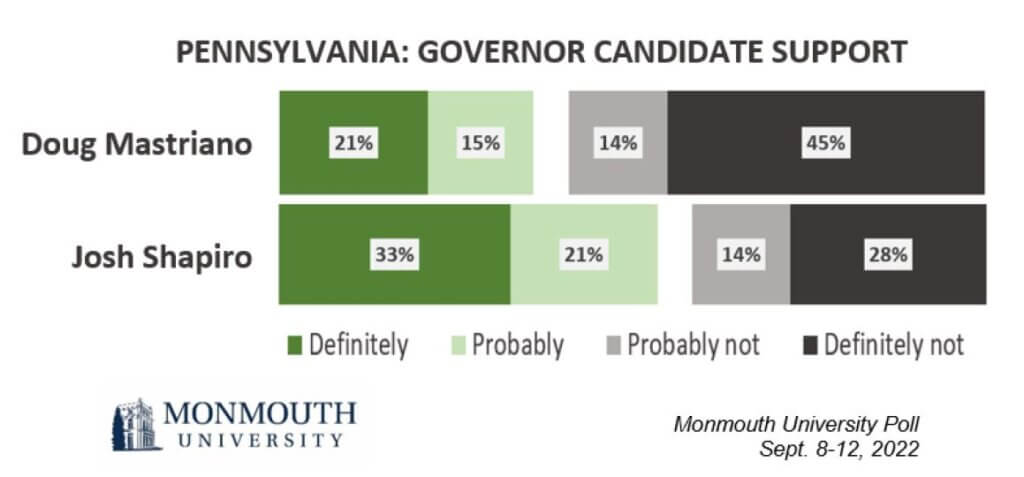
More than half of potential voters say they will either definitely (33%) or probably (21%) vote for Shapiro in November. Just over one-third currently feel they will definitely (21%) or probably (15%) vote for Mastriano. Significantly more Pennsylvania voters say they definitely will not vote for Mastriano (45%) than the number who completely rule out Shapiro (28%). Among voters who identify as Democrats, 66% say they are definitely prepared to support Shapiro now and just 2% have definitely ruled him out. Among Republicans, 47% say they are definitely prepared to support Mastriano now while 13% have definitely ruled him out.
“Mastriano’s core partisan support is weaker than Shapiro’s right now, but we would expect most of that to come home in November. However, having one in 10 GOP voters eliminate their nominee from contention at this stage makes it a much harder climb for the Republican against a fairly popular Democrat,” said Patrick Murray, director of the independent Monmouth University Polling Institute.
Mastriano does best in the central part of Pennsylvania – 49% of voters there are inclined to vote for him – but not nearly as strong as Shapiro is in the eastern (61%) and western (58%) parts of the commonwealth. Among white voters who do not hold a four-year college degree – a key component of the Republican bloc in recent election cycles – 47% say they will definitely or probably vote for Mastriano, but a similar 43% say they are inclined to back Shapiro.
Shapiro has a decidedly positive personal rating of 55% favorable to 33% unfavorable, while Mastriano holds a net negative rating of 36% favorable to 48% unfavorable. Interestingly, 8% of voters say they have a favorable opinion of both candidates, while 9% are favorable toward neither. About 1 in 4 voters do not have a clearly favorable opinion of one candidate over the other. Among this “up for grabs” group, 35% will definitely or probably vote for Mastriano and 27% say the same about Shapiro.
“Only half the potential electorate is firmly committed to a candidate right now. There are certainly paths for Mastriano to pick up support by activating voters who may be on the fence, but he does have quite a bit of ground to make up,” said Murray.
Recent U.S. Supreme Court cases on abortion and guns have thrown these issues into the spotlight in state races. The legislature is poised to put an amendment on the ballot next year declaring that Pennsylvania’s constitution does not grant a right to abortion access. Currently, just 15% of Pennsylvania voters say that the commonwealth’s current abortion laws are not strict enough. Half (51%) say they are about right and 19% actually say they are too strict. Another 15% have no opinion.
“Only 13% of Pennsylvania voters name abortion as one of the country’s top issues, but it will be interesting to see how this plays in the governor’s race as well as legislative contests this year given that the new legislature will have to vote on the proposed amendment,” said Murray.
On another controversial issue impacted by a recent Supreme Court decision, 41% of voters feel Pennsylvania’s current gun ownership laws are not strict enough. Another 44% say they are about right and just 10% say they are too strict. Only 5% have no opinion on Pennsylvania’s current gun laws. Voters in the eastern portion of the commonwealth (52%) are most likely to feel that current gun ownership laws are not strict enough. They are joined by 39% of voters in western Pennsylvania and just 25% of voters in the central region.
The Monmouth University Poll was conducted by telephone from September 8 to 12, 2022 with 605 Pennsylvania registered voters. The question results in this release have a margin of error of +/- 4.0 percentage points. The poll was conducted by the Monmouth University Polling Institute in West Long Branch, NJ.
QUESTIONS AND RESULTS
(* Some columns may not add to 100% due to rounding.)
[Q1-10 previously released.]
11/12.I am going to read you a list of candidates running for Governor in Pennsylvania this year. For each one, please tell me if you have definitely heard of them, not sure if you’ve heard of them, or if you’ve definitely not heard of them?
[If DEFINITELY HEARD OF:] For each of the following, please tell me if you have a very favorable, somewhat favorable, somewhat unfavorable, or very unfavorable opinion of them. [NAMES WERE ROTATED]
Very favorable | Somewhat favorable | Somewhat unfavorable | Very unfavorable | Heard of, no opinion (VOL) | Not sure if heard of | Definitely not heard of | (n) | |
| Doug Mastriano, the Republican | 18% | 18% | 9% | 39% | 5% | 3% | 9% | (605) |
| Josh Shapiro, the Democrat | 30% | 25% | 13% | 20% | 5% | 2% | 6% | (605) |
| Matt Hackenburg, the Libertarian | 0% | 2% | 2% | 1% | 2% | 7% | 86% | (605) |
| Christina DiGiulio, of the Green Party | 0% | 4% | 3% | 1% | 2% | 7% | 82% | (605) |
| Joe Soloski, of the Keystone Party | 0% | 1% | 1% | 0% | 1% | 6% | 91% | (605) |
[QUESTIONS 13 & 14 WERE ROTATED]
13.How likely are you to vote for Doug Mastriano in the election for governor – will you definitely vote for him, probably vote for him, probably not vote for him, or definitely not vote for him?
| Sept. 2022 | |
| Definitely | 21% |
| Probably | 15% |
| Probably not | 14% |
| Definitely not | 45% |
| (VOL) Don’t know | 5% |
| (n) | (605) |
14.How likely are you to vote for Josh Shapiro in the election for governor – will you definitely vote for him, probably vote for him, probably not vote for him, or definitely not vote for him?
| Sept. 2022 | |
| Definitely | 33% |
| Probably | 21% |
| Probably not | 14% |
| Definitely not | 28% |
| (VOL) Don’t know | 5% |
| (n) | (605) |
[QUESTIONS 15 & 16 WERE ROTATED]
15.Do you feel Pennsylvania’s current abortion laws are too strict, not strict enough, or about right?
| Sept. 2022 | |
| Too strict | 19% |
| Not strict enough | 15% |
| About right | 51% |
| (VOL) Don’t know | 15% |
| (n) | (605) |
16.Do you feel Pennsylvania’s current gun ownership laws are too strict, not strict enough, or about right?
| Sept. 2022 | |
| Too strict | 10% |
| Not strict enough | 41% |
| About right | 44% |
| (VOL) Don’t know | 5% |
| (n) | (605) |
[Q17-27 previously released.]
METHODOLOGY
The Monmouth University Poll was sponsored and conducted by the Monmouth University Polling Institute from September 8 to 12, 2022 with a probability-based random sample of 605 Pennsylvania voters drawn from a list of active registered voters who participated in at least one general election since 2016 or have newly registered since the 2020 election. This includes 183 contacted by a live interviewer on a landline telephone and 422 contacted by a live interviewer on a cell phone, in English. Monmouth is responsible for all aspects of the survey design, data weighting and analysis. The full sample is weighted for party registration, age, gender, race, education, and region based on state voter registration list information and U.S. Census information (CPS 2018 supplement). Data collection support provided by Braun Research (field) and Aristotle (voter sample). For results based on this sample, one can say with 95% confidence that the error attributable to sampling has a maximum margin of plus or minus 4.0 percentage points (unadjusted for sample design). Sampling error can be larger for sub-groups (see table below). In addition to sampling error, one should bear in mind that question wording and practical difficulties in conducting surveys can introduce error or bias into the findings of opinion polls.
| DEMOGRAPHICS (weighted) |
| REGISTERED VOTERS |
| Party Registration |
| 42% Republican |
| 13% Other/none |
| 45% Democrat |
| Self-Reported Party |
| 34% Republican |
| 34% Independent |
| 32% Democrat |
| 47% Male |
| 53% Female |
| 21% 18-34 |
| 22% 35-49 |
| 29% 50-64 |
| 28% 65+ |
| 84% White, non-Hispanic |
| 10% Black |
| 2% Hispanic |
| 3% Asian/other |
| 62% No degree |
| 38% 4 year degree |
Click on pdf file link below for full methodology and crosstabs by key demographic groups.