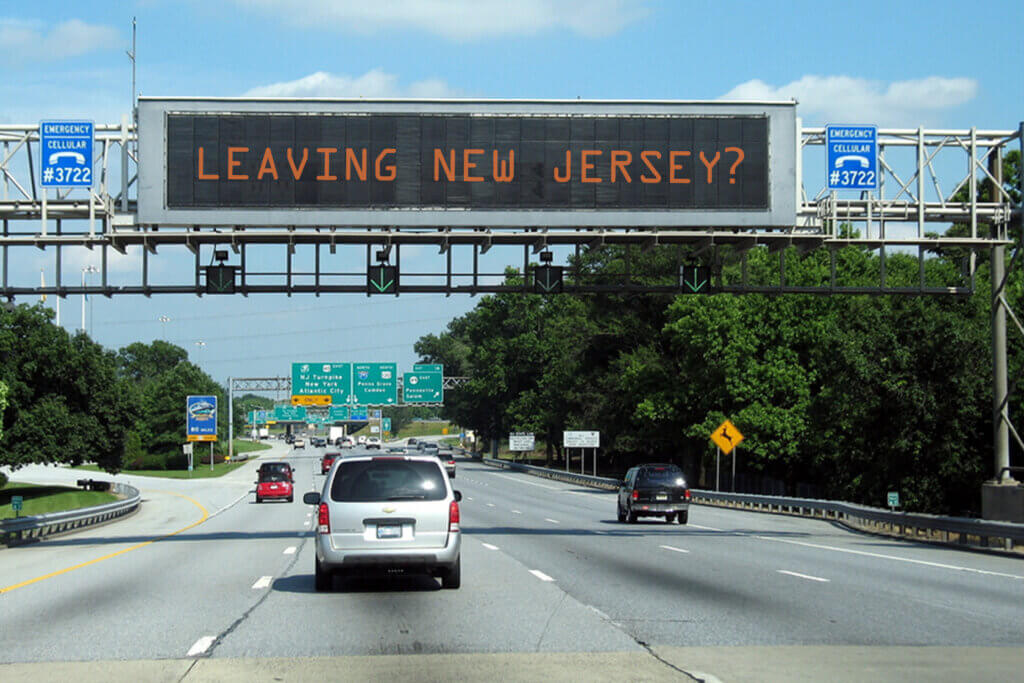
West Long Branch, NJ – The public’s views of New Jersey’s quality of life and rating of the state as a good place to live are toward the higher end of their historical range. However, the number of residents who want to leave the state is at a high point, according to the Monmouth (“Mon-muth”) University Poll. The desire to exit New Jersey is showing a marked partisan gap, with more Republicans wanting to leave, that was not evident in prior years. Regardless, the state’s property tax burden remains the top reason people cite for their intention to get out of New Jersey, as it has been in the past.
Monmouth’s exclusive Garden State Quality of Life Index score now stands at +27, which is in line with last year’s +25 rating. The index number had jumped to +37 at the beginning of the pandemic in April 2020. In the years prior it tended to range between +18 and +31, with an outlying low point of +13 registered in February 2019. The current reading is toward the higher end of index scores since Monmouth first started tracking this quality of life metric in 2010.
The quality of life index score has increased in most areas of the state over the past year, including the Central Hills (up 9 points to +42), Northern Shore (up 8 to +34), Delaware Valley (up 7 to +27), Garden Core (up 6 to +19), and Route 1 Corridor (up 5 to +28). It has dropped slightly in the Northeast (down 3 points to +28) and by a larger number in the Urban Core counties (down 7 to +16).
“It’s worth noting that the areas with the least positive views of New Jersey’s quality of life are the heavily Democratic urban areas and the heavily Republican rural counties,” said Patrick Murray, director of the independent Monmouth University Polling Institute.
The Garden State Quality of Life Index was created by the Monmouth University Polling Institute in 2010 to serve as a resident-based indicator of the quality of life offered by the state of New Jersey. The index is based on five separate poll questions: overall opinion of the state as a place to live – which contributes half the index score – and ratings of one’s hometown, the performance of local schools, the quality of the local environment, and feelings of safety in one’s own neighborhood. The index can potentially range from –100 to +100.
A little under 2 in 3 New Jerseyans say the state is either an excellent (19%) or good (45%) place to live, while 22% say it is only fair and 13% rate the state as poor. The current positive rating of 64% is between last year’s 59% result and 68% in 2020. The all-time high mark for the state rating was 84% positive in February 1987. The record low was 50% in February 2019, but it improved to 61% by September of that year.
While the overall state rating has improved, a larger than ever number of New Jerseyans (59%) say they would like to move out of the state at some point. Prior polls that asked this question between 2007 and 2014 found from 49% to 53% who wanted to leave. In all those instances, overall positive ratings of the state were similar to where they are today (between 61% and 63%) while the Garden State Quality of Life Index was significantly lower in 2014 (+18) than it is today (+27).
| GARDEN STATE QUALITY OF LIFE INDEX | |||||||||||
| GENDER | AGE | RACE | INCOME | ||||||||
| NJ TOTAL | Male | Female | 18-34 | 35-54 | 55+ | White | Black/ Hispanic | <$50K | $50-100K | >$100K | |
| April 2022 | +27 | +24 | +30 | +24 | +25 | +31 | +30 | +23 | +18 | +24 | +35 |
| May 2021 | +25 | +20 | +29 | +24 | +24 | +27 | +25 | +20 | +17 | +25 | +31 |
| April 2020 | +37 | +34 | +41 | +34 | +38 | +40 | +43 | +26 | +29 | +37 | +44 |
| September 2019 | +24 | +21 | +26 | +21 | +20 | +32 | +31 | +13 | +18 | +20 | +33 |
| February 2019 | +13 | +14 | +12 | +10 | +11 | +18 | +17 | +4 | +2 | +14 | +20 |
| April 2018 | +18 | +16 | +20 | +22 | +14 | +20 | +22 | +5 | +8 | +16 | +27 |
| July 2017 | +25 | +25 | +24 | +15 | +26 | +30 | +32 | +6 | +8 | +23 | +41 |
| July 2015 | +18 | +18 | +18 | +25 | +11 | +20 | +24 | +5 | n/a | n/a | n/a |
| February 2015 | +23 | +21 | +26 | +26 | +18 | +28 | +29 | +10 | +13 | +30 | +31 |
| September 2014 | +18 | +19 | +17 | +12 | +20 | +20 | +23 | +5 | +13 | +15 | +30 |
| April 2014 | +25 | +24 | +25 | +31 | +20 | +25 | +27 | +16 | +17 | +24 | +33 |
| February 2014 | +23 | +28 | +18 | +23 | +21 | +26 | +27 | +11 | +8 | +23 | +35 |
| December 2013 | +24 | +25 | +23 | +24 | +21 | +27 | +29 | +10 | +10 | +24 | +35 |
| September 2013 | +26 | +26 | +26 | +27 | +23 | +30 | +33 | +10 | +17 | +25 | +42 |
| April 2013 | +21 | +19 | +24 | +19 | +19 | +27 | +29 | +3 | +12 | +19 | +35 |
| February 2013 | +29 | +28 | +30 | +30 | +27 | +31 | +36 | +12 | +20 | +30 | +36 |
| December 2012 | +30 | +31 | +29 | +30 | +30 | +30 | +36 | +14 | +17 | +33 | +38 |
| September 2012 | +24 | +28 | +20 | +16 | +21 | +32 | +30 | +5 | +10 | +23 | +37 |
| July 2012 | +27 | +26 | +29 | +21 | +31 | +30 | +32 | +16 | +16 | +31 | +37 |
| April 2012 | +31 | +33 | +28 | +25 | +30 | +37 | +36 | +19 | +24 | +28 | +42 |
| February 2012 | +25 | +20 | +30 | +25 | +24 | +26 | +29 | +13 | +17 | +23 | +38 |
| October 2011 | +24 | +24 | +24 | +23 | +21 | +29 | +31 | +7 | +15 | +25 | +31 |
| August 2011 | +22 | +25 | +19 | +27 | +19 | +21 | +26 | +9 | +9 | +22 | +32 |
| May 2011 | +23 | +24 | +22 | +23 | +22 | +23 | +26 | +14 | +15 | +22 | +32 |
| December 2010 | +21 | +20 | +23 | +23 | +20 | +23 | +26 | +13 | +15 | +21 | +31 |
| GARDEN STATE QUALITY OF LIFE INDEX | ||||||||||
| REGION | COMMUNITY TYPE | |||||||||
| North East | Urban Core | Route 1 Corridor | Central Hills | Northern Shore | Delaware Valley | Garden Core | Urban | Stable Town | Growing Suburb | |
| April 2022 | +28 | +16 | +28 | +42 | +34 | +27 | +19 | +15 | +31 | +31 |
| May 2021 | +31 | +23 | +23 | +33 | +26 | +20 | +13 | +20 | +26 | +26 |
| April 2020 | +41 | +30 | +40 | +49 | +46 | +33 | +21 | +18 | +41 | +45 |
| September 2019 | +20 | +10 | +23 | +42 | +32 | +26 | +17 | +6 | +30 | +30 |
| February 2019 | +21 | -1 | +16 | +27 | +21 | -3 | +9 | -1 | +15 | +19 |
| April 2018 | +24 | +8 | +18 | +34 | +18 | +14 | +11 | +2 | +23 | +24 |
| July 2017 | +25 | +18 | +34 | +33 | +35 | +22 | +13 | +7 | +31 | +29 |
| July 2015 | +21 | +4 | +22 | +35 | +22 | +17 | +10 | -2 | +28 | +23 |
| February 2015 | +31 | +13 | +24 | +38 | +31 | +11 | +19 | +11 | +30 | +27 |
| September 2014 | +23 | +8 | +12 | +42 | +27 | +18 | +4 | +10 | +22 | +19 |
| April 2014 | +24 | +10 | +22 | +43 | +29 | +25 | +23 | +4 | +26 | +33 |
| February 2014 | +27 | +16 | +20 | +37 | +30 | +14 | +16 | +6 | +28 | +28 |
| December 2013 | +31 | +15 | +26 | +40 | +25 | +14 | +17 | +5 | +29 | +30 |
| September 2013 | +27 | +8 | +21 | +52 | +33 | +27 | +19 | +1 | +34 | +32 |
| April 2013 | +31 | +4 | +19 | +38 | +22 | +21 | +21 | -3 | +30 | +27 |
| February 2013 | +31 | +17 | +35 | +37 | +36 | +25 | +23 | +11 | +33 | +36 |
| December 2012 | +36 | +18 | +26 | +47 | +40 | +21 | +31 | +9 | +37 | +37 |
| September 2012 | +29 | +14 | +17 | +45 | +33 | +26 | +13 | -1 | +27 | +31 |
| July 2012 | +37 | +12 | +30 | +37 | +34 | +22 | +18 | +8 | +34 | +34 |
| April 2012 | +38 | +26 | +27 | +44 | +34 | +22 | +28 | +20 | +35 | +36 |
| February 2012 | +33 | +17 | +27 | +35 | +29 | +19 | +22 | +11 | +31 | +29 |
| October 2011 | +31 | +6 | +22 | +45 | +35 | +18 | +23 | -1 | +31 | +34 |
| August 2011 | +24 | +16 | +21 | +38 | +27 | +26 | +6 | +4 | +29 | +25 |
| May 2011 | +28 | +17 | +16 | +41 | +29 | +22 | +20 | +6 | +29 | +28 |
| December 2010 | +26 | +15 | +22 | +38 | +23 | +14 | +17 | +12 | +23 | +27 |
“It’s a bit of a head-scratcher. Positive ratings of New Jersey as a place to live have ticked up a bit. But so has the sense that people want to get out of here someday. One possible explanation is that residents appreciate the benefits that New Jersey has to offer, but the cost of living does not make it sustainable in the long run,” said Murray.
Regardless of whether they want to leave, 36% of current state residents say it is very likely they will move out of the state at some point in their lives. This is a jump from 26% who said the same in 2014 and 28% in 2007. Demographically, there has been a much bigger jump in this sentiment among younger adults under age 35 (up 17 points from 2014 to 42%) than among those age 35 to 54 (up 10 points to 43%) or 55 and older (up 8 points to 26%).
Six in ten of those who say they are at least somewhat likely to leave New Jersey cite financial concerns, with property taxes (26%) leading the list. Another 7% cite other taxes, 7% point to high housing costs, and 19% refer to the high cost of living in general. These are the same reasons people gave for wanting to leave in 2014, but there are more of them now.
Republicans (69%) and independents (64%) are much more likely than Democrats (47%) to say they want to leave the state. In 2014, however, similar number of Republicans (48%) and Democrats (46%) said they wanted to leave the state. The partisan results were also similar in 2007 (49% Republicans and 44% Democrats). In both years, independents were actually a little more likely than either partisan group to say they wanted to move out of New Jersey (55% in 2014 and 54% in 2007).
“Politics may also be playing a subtle role in wanting to get out of the state. We are already aware of the self-sorting that has gone on for the past generation where people gravitate to communities and counties within their states where the neighbors are more like them ideologically. Who knows? As individual states become redder or bluer, maybe we are starting to see the same thing happening across state lines,” said Murray
Turning back to other metrics that make up the Garden State Quality of Life Index, nearly 3 in 4 New Jerseyans rate their own town or city as an excellent (32%) or good (41%) place to live. The 73% positive hometown rating is slightly lower than last year (76%) and the record high in 2020 (79%).
The current poll registers ratings for local environmental quality at 76% positive – 31% excellent and 45% good, which is in line with last year’s results. School ratings have also been stable, now standing at 63% positive – 24% excellent and 39% good – compared with 64% in 2021. The percentage of Garden State residents who currently feel very safe in their own neighborhoods at night stands at 65%, similar to 67% last year.
The Monmouth University Poll was conducted by telephone from March 31 to April 4, 2022 with 802 New Jersey adults. The question results in this release have a margin of error of +/- 3.5 percentage points. The poll was conducted by the Monmouth University Polling Institute in West Long Branch, NJ.
QUESTIONS AND RESULTS
(* Some columns may not add to 100% due to rounding.)
1.Overall, how would you rate New Jersey as a place to live – excellent, good, only fair, or poor?
| TREND*: | Excellent/ Good | Excellent | Good | Only Fair | Poor | (VOL) Don’t know | (n) |
| April 2022 | 64% | 19% | 45% | 22% | 13% | 1% | (802) |
| May 2021 | 59% | 16% | 43% | 27% | 14% | 0% | (706) |
| April 2020 | 68% | 24% | 44% | 23% | 7% | 1% | (704) |
| September 2019 | 61% | 15% | 46% | 26% | 12% | 1% | (713) |
| February 2019 | 50% | 11% | 39% | 32% | 17% | 1% | (604) |
| April 2018 | 54% | 15% | 39% | 29% | 17% | 1% | (703) |
| July 2017 | 59% | 15% | 44% | 28% | 13% | 0% | (800) |
| May 2016 | 62% | 16% | 46% | 28% | 10% | 0% | (806) |
| July 2015 | 55% | 12% | 43% | 30% | 15% | 0% | (503) |
| May 2015 | 63% | 13% | 50% | 27% | 10% | 1% | (500) |
| February 2015 | 63% | 15% | 48% | 25% | 11% | 1% | (805) |
| September 2014 | 61% | 13% | 48% | 25% | 13% | 1% | (802) |
| June 2014 | 62% | 15% | 47% | 26% | 11% | 0% | (800) |
| April 2014 | 64% | 15% | 49% | 26% | 10% | 0% | (803) |
| February 2014 | 63% | 15% | 48% | 26% | 11% | 0% | (803) |
| December 2013 | 65% | 20% | 45% | 26% | 9% | 0% | (802) |
| September 2013 | 65% | 19% | 46% | 25% | 10% | 1% | (783) |
| April 2013 | 61% | 15% | 46% | 27% | 11% | 0% | (806) |
| February 2013 | 68% | 18% | 50% | 24% | 7% | 1% | (803) |
| December 2012 | 72% | 20% | 52% | 21% | 5% | 1% | (816) |
| September 2012 | 65% | 15% | 50% | 23% | 11% | 0% | (805) |
| July 2012 | 69% | 17% | 52% | 23% | 8% | 0% | (803) |
| April 2012 | 70% | 20% | 50% | 23% | 7% | 0% | (804) |
| February 2012 | 62% | 15% | 47% | 26% | 11% | 1% | (803) |
| October 2011 | 67% | 15% | 52% | 24% | 8% | 0% | (817) |
| August 2011 | 57% | 14% | 43% | 31% | 11% | 1% | (802) |
| May 2011 | 59% | 14% | 45% | 29% | 11% | 0% | (807) |
| December 2010 | 63% | 17% | 46% | 26% | 10% | 1% | (2864) |
| October 2007 | 63% | 17% | 46% | 25% | 12% | 1% | (1001) |
| August 2004 | 68% | 22% | 46% | 21% | 10% | 1% | (800) |
| May 2003 | 72% | 20% | 52% | 23% | 5% | 0% | (1002) |
| April 2001 | 76% | 23% | 53% | 19% | 4% | 1% | (802) |
| March 2000 | 76% | 25% | 51% | 17% | 6% | 0% | (800) |
| May 1999 | 76% | 22% | 54% | 19% | 5% | 0% | (800) |
| February 1994 | 71% | 18% | 53% | 22% | 7% | 0% | (801) |
| March 1990 | 68% | 21% | 47% | 25% | 6% | 1% | (800) |
| February 1988 | 78% | 27% | 51% | 17% | 4% | 1% | (800) |
| February 1987 | 84% | 31% | 53% | 11% | 4% | 0% | (800) |
| May 1985 | 81% | 29% | 52% | 14% | 3% | 1% | (500) |
| October 1984 | 80% | 29% | 51% | 15% | 4% | 1% | (1000) |
| January 1981 | 66% | 16% | 50% | 26% | 7% | 1% | (1003) |
| July 1980 | 68% | 18% | 50% | 23% | 7% | 2% | (1005) |
[Q2-31 previously released.]
32.How would you rate your town or city as a place to live –excellent, good, only fair, or poor?
| TREND*: | Excellent/ Good | Excellent | Good | Only Fair | Poor | (VOL) Don’t know | (n) |
| April 2022 | 73% | 32% | 41% | 20% | 7% | 0% | (802) |
| May 2021 | 76% | 33% | 43% | 19% | 5% | 0% | (706) |
| April 2020 | 79% | 39% | 40% | 16% | 5% | 0% | (704) |
| September 2019 | 72% | 32% | 40% | 20% | 7% | 0% | (713) |
| February 2019 | 67% | 30% | 37% | 21% | 11% | 0% | (604) |
| April 2018 | 71% | 30% | 41% | 20% | 9% | 0% | (703) |
| July 2017 | 77% | 37% | 40% | 16% | 7% | 0% | (800) |
| July 2015 | 71% | 29% | 42% | 19% | 10% | 0% | (503) |
| February 2015 | 72% | 29% | 43% | 21% | 7% | 0% | (805) |
| September 2014 | 69% | 24% | 45% | 22% | 10% | 0% | (802) |
| April 2014 | 71% | 27% | 44% | 20% | 9% | 0% | (803) |
| February 2014 | 70% | 31% | 39% | 23% | 7% | 0% | (803) |
| December 2013 | 70% | 29% | 41% | 21% | 8% | 1% | (802) |
| September 2013 | 72% | 32% | 40% | 18% | 9% | 1% | (783) |
| April 2013 | 67% | 29% | 38% | 25% | 8% | 0% | (806) |
| February 2013 | 73% | 30% | 43% | 20% | 7% | 0% | (803) |
| December 2012 | 74% | 32% | 42% | 17% | 9% | 0% | (816) |
| September 2012 | 72% | 33% | 39% | 19% | 9% | 0% | (805) |
| July 2012 | 74% | 32% | 42% | 18% | 7% | 1% | (803) |
| April 2012 | 76% | 34% | 42% | 17% | 7% | 0% | (804) |
| February 2012 | 74% | 33% | 41% | 21% | 5% | 0% | (803) |
| October 2011 | 73% | 26% | 47% | 20% | 8% | 0% | (817) |
| August 2011 | 76% | 28% | 48% | 18% | 6% | 0% | (802) |
| May 2011 | 73% | 33% | 40% | 20% | 7% | 0% | (807) |
| December 2010 | 73% | 27% | 46% | 20% | 8% | 0% | (2864) |
| May 2003 | 74% | 29% | 45% | 19% | 7% | 0% | (1002) |
| April 2001 | 73% | 28% | 45% | 21% | 6% | 0% | (802) |
| May 1995 | 70% | 30% | 40% | 21% | 8% | 0% | (802) |
| June 1994 | 72% | 31% | 41% | 19% | 9% | 0% | (801) |
| September 1988 | 72% | 26% | 46% | 18% | 9% | 1% | (500) |
| October 1984 | 71% | 30% | 41% | 21% | 7% | 1% | (999) |
| June 1980 | 67% | 23% | 44% | 24% | 9% | 0% | (1005) |
| May 1977 | 66% | 25% | 41% | 24% | 10% | 0% | (1005) |
[QUESTIONS 33-35 WERE ROTATED]
33.How would you rate the quality of the environment in the area where you live – excellent, good, only fair, or poor?
| TREND*: | Excellent/ Good | Excellent | Good | Only Fair | Poor | (VOL) Don’t know | (n) |
| April 2022 | 76% | 31% | 45% | 17% | 7% | 0% | (802) |
| May 2021 | 76% | 32% | 44% | 18% | 6% | 0% | (706) |
| April 2020 | 81% | 36% | 45% | 15% | 4% | 0% | (704) |
| September 2019 | 72% | 31% | 41% | 22% | 6% | 1% | (713) |
| February 2019 | 71% | 27% | 44% | 21% | 8% | 0% | (604) |
| April 2018 | 73% | 29% | 44% | 20% | 6% | 1% | (703) |
| July 2017 | 76% | 37% | 39% | 14% | 8% | 1% | (800) |
| July 2015 | 71% | 27% | 44% | 20% | 9% | 0% | (503) |
| February 2015 | 72% | 27% | 45% | 23% | 4% | 0% | (805) |
| September 2014 | 72% | 24% | 48% | 21% | 5% | 1% | (802) |
| April 2014 | 76% | 27% | 49% | 18% | 6% | 0% | (803) |
| February 2014 | 73% | 29% | 44% | 21% | 6% | 0% | (803) |
| December 2013 | 69% | 27% | 42% | 24% | 7% | 0% | (802) |
| September 2013 | 75% | 30% | 45% | 18% | 7% | 1% | (783) |
| April 2013 | 70% | 27% | 43% | 22% | 7% | 0% | (806) |
| February 2013 | 71% | 26% | 45% | 24% | 4% | 2% | (803) |
| December 2012 | 73% | 25% | 48% | 20% | 7% | 1% | (816) |
| September 2012 | 72% | 30% | 42% | 20% | 7% | 0% | (805) |
| July 2012 | 74% | 30% | 44% | 19% | 7% | 1% | (803) |
| April 2012 | 75% | 30% | 45% | 18% | 6% | 1% | (804) |
| February 2012 | 77% | 29% | 48% | 17% | 5% | 0% | (803) |
| October 2011 | 72% | 25% | 47% | 19% | 9% | 0% | (817) |
| August 2011 | 79% | 31% | 48% | 16% | 5% | 0% | (802) |
| May 2011 | 79% | 33% | 46% | 15% | 6% | 0% | (807) |
| December 2010 | 66% | 14% | 52% | 25% | 9% | 0% | (2864) |
| April 2001 | 70% | 27% | 43% | 22% | 7% | 1% | (402) |
| September 1988 | 53% | 10% | 43% | 31% | 15% | 1% | (500) |
34.How would you rate the job your local schools are doing – excellent, good, only fair, or poor?
| TREND*: | Excellent/ Good | Excellent | Good | Only Fair | Poor | (VOL) Don’t know | (n) |
| April 2022 | 63% | 24% | 39% | 16% | 11% | 10% | (802) |
| May 2021 | 64% | 24% | 40% | 18% | 8% | 10% | (706) |
| April 2020 | 73% | 33% | 40% | 16% | 4% | 7% | (704) |
| September 2019 | 60% | 26% | 34% | 23% | 9% | 9% | (713) |
| February 2019 | 59% | 19% | 40% | 22% | 10% | 9% | (604) |
| April 2018 | 60% | 24% | 36% | 23% | 10% | 7% | (703) |
| July 2017 | 65% | 26% | 39% | 20% | 10% | 6% | (800) |
| July 2015 | 60% | 27% | 33% | 22% | 9% | 8% | (503) |
| February 2015 | 61% | 21% | 40% | 24% | 8% | 7% | (805) |
| September 2014 | 60% | 21% | 39% | 24% | 9% | 7% | (802) |
| April 2014 | 63% | 24% | 39% | 22% | 9% | 6% | (803) |
| February 2014 | 61% | 22% | 39% | 22% | 10% | 7% | (803) |
| December 2013 | 60% | 20% | 40% | 23% | 12% | 5% | (802) |
| September 2013 | 62% | 24% | 38% | 21% | 7% | 9% | (783) |
| April 2013 | 59% | 21% | 38% | 27% | 9% | 5% | (806) |
| February 2013 | 64% | 24% | 40% | 20% | 7% | 9% | (803) |
| December 2012 | 61% | 21% | 40% | 23% | 7% | 9% | (816) |
| September 2012 | 61% | 27% | 34% | 21% | 10% | 8% | (805) |
| July 2012 | 61% | 22% | 39% | 20% | 11% | 8% | (803) |
| April 2012 | 63% | 23% | 40% | 21% | 7% | 8% | (804) |
| February 2012 | 68% | 26% | 42% | 16% | 8% | 8% | (803) |
| October 2011 | 60% | 21% | 39% | 20% | 13% | 7% | (817) |
| August 2011 | 63% | 19% | 44% | 26% | 6% | 5% | (802) |
| May 2011 | 63% | 24% | 39% | 22% | 10% | 6% | (807) |
| December 2010 | 64% | 24% | 40% | 23% | 8% | 5% | (2864) |
| August 2004 | 61% | 24% | 37% | 17% | 12% | 9% | (800) |
| April 2001 | 64% | 21% | 43% | 21% | 6% | 9% | (802) |
| September 1999 | 62% | 18% | 44% | 21% | 9% | 8% | (802) |
| September 1998 | 62% | 20% | 42% | 23% | 9% | 7% | (804) |
| February 1996 | 60% | 20% | 40% | 20% | 11% | 9% | (804) |
| September 1993 | 52% | 16% | 36% | 29% | 14% | 5% | (801) |
| January 1992 | 53% | 15% | 38% | 26% | 15% | 5% | (800) |
| October 1987 | 60% | 14% | 46% | 23% | 6% | 11% | (500) |
| October 1986 | 55% | 15% | 40% | 26% | 10% | 9% | (800) |
| October 1983 | 59% | 16% | 43% | 23% | 10% | 8% | (802) |
| May 1978 | 52% | 12% | 40% | 25% | 12% | 11% | (1003) |
35.How safe do you feel in your neighborhood at night – very safe, somewhat safe, or not at all safe?
| TREND*: | Very safe | Somewhat safe | Not at all safe | (VOL) Don’t know | (n) |
| April 2022 | 65% | 29% | 5% | 0% | (802) |
| May 2021 | 67% | 31% | 2% | 0% | (706) |
| April 2020 | 74% | 22% | 3% | 1% | (704) |
| September 2019 | 68% | 27% | 5% | 0% | (713) |
| February 2019 | 64% | 29% | 7% | 0% | (604) |
| April 2018 | 65% | 29% | 5% | 0% | (703) |
| July 2017 | 71% | 22% | 6% | 0% | (800) |
| July 2015 | 67% | 27% | 6% | 0% | (503) |
| February 2015 | 62% | 33% | 4% | 0% | (805) |
| September 2014 | 58% | 36% | 6% | 0% | (802) |
| April 2014 | 66% | 30% | 4% | 1% | (803) |
| February 2014 | 67% | 28% | 6% | 0% | (803) |
| December 2013 | 60% | 33% | 7% | 0% | (802) |
| September 2013 | 65% | 27% | 7% | 1% | (783) |
| April 2013 | 66% | 28% | 6% | 0% | (806) |
| February 2013 | 63% | 30% | 6% | 1% | (803) |
| December 2012 | 64% | 29% | 6% | 1% | (816) |
| September 2012 | 65% | 25% | 6% | 0% | (805) |
| July 2012 | 60% | 32% | 7% | 1% | (803) |
| April 2012 | 64% | 31% | 5% | 1% | (804) |
| February 2012 | 62% | 32% | 5% | 0% | (803) |
| October 2011 | 62% | 31% | 7% | 0% | (817) |
| August 2011 | 63% | 31% | 6% | 0% | (802) |
| May 2011 | 68% | 27% | 5% | 0% | (807) |
| December 2010 | 59% | 35% | 6% | 0% | (2864) |
| February 1993 | 42% | 44% | 13% | 0% | (801) |
| October 1987 | 51% | 36% | 11% | 2% | (499) |
| October 1984 | 53% | 36% | 9% | 2% | (500) |
| May 1981 | 43% | 43% | 13% | 1% | (497) |
36.As things stand now, would you like to move out of New Jersey at some point or would you like to stay here for the rest of your life?
| TREND: | April 2022 | Sept. 2014 | April 2010 | Sept. 2009 | Oct. 2007 |
| Move out of New Jersey | 59% | 50% | 53% | 50% | 49% |
| Stay in New Jersey | 38% | 45% | 43% | 43% | 44% |
| (VOL) Don’t know | 3% | 5% | 4% | 7% | 7% |
| (n) | (802) | (802) | (804) | (900) | (801) |
37.
Regardless of whether you want to leave New Jersey, how likely is it that you will actually move out of the state at some point in your life – very, somewhat, not too, or not all likely?
| TREND: | April 2022 | Sept. 2014 | Oct. 2007 |
| Very likely | 36% | 26% | 28% |
| Somewhat likely | 30% | 32% | 32% |
| Not too likely | 17% | 17% | 16% |
| Not all likely | 17% | 23% | 23% |
| (VOL) Don’t know | 1% | 2% | 1% |
| (n) | (802) | (802) | (801) |
[Question 37A was asked of those who are likely to move out of New Jersey at some point: n=519, moe=+/-4.3 %.]
37A.What is the top reason why you are likely to move out of New Jersey? [LIST WAS NOT READ]
| TREND: | April 2022 | Sept. 2014 |
| Property taxes | 26% | 24% |
| Other taxes (income, sales) | 7% | 6% |
| High housing costs | 7% | 5% |
| Cost of living in general | 19% | 19% |
| TOTAL taxes/costs | 59% | 54% |
| Economic/job opportunity | 8% | 12% |
| Change of scenery | 5% | 12% |
| Be closer to family | 3% | 4% |
| Weather | 10% | 6% |
| Corruption/bad government | 4% | 2% |
| Congestion, overdevelopment | 2% | 2% |
| Environment, health | 2% | 3% |
| Schools | 0% | 1% |
| Crime | 1% | 2% |
| Bad place to raise a family | 0% | 2% |
| Other/No answer | 6% | 2% |
| (n) | (519) | (426) |
[Q38-45 previously released.]
* Note: All trend results prior to 2005 come from Rutgers University’s Eagleton Poll.
METHODOLOGY
The Monmouth University Poll was sponsored and conducted by the Monmouth University Polling Institute from March 31 to April 4, 2022 with a probability-based random sample of 802 New Jersey adults age 18 and older, in English. This includes 280 contacted by a live interviewer on a landline telephone and 522 contacted by a live interviewer on a cell phone. Telephone numbers were selected through random digit dialing and landline respondents were selected with a modified Troldahl-Carter youngest adult household screen. Monmouth is responsible for all aspects of the survey design, data weighting and analysis. The full sample is weighted for region, age, education, gender and race based on US Census information (ACS 2018 one-year survey). Data collection support provided by Braun Research (field) and Dynata (RDD sample). For results based on this sample, one can say with 95% confidence that the error attributable to sampling has a maximum margin of plus or minus 3.5 percentage points (unadjusted for sample design). Sampling error can be larger for sub-groups (see table below). In addition to sampling error, one should bear in mind that question wording and practical difficulties in conducting surveys can introduce error or bias into the findings of opinion polls.
Standard Region (by county):
North – Bergen, Essex, Hudson, Morris, Passaic, Sussex, Union, Warren
Central – Hunterdon, Mercer, Middlesex, Monmouth, Somerset
South – Atlantic, Burlington, Camden, Cape May, Cumberland, Gloucester, Ocean, Salem
Expanded Region (by county): Northeast (Bergen, Passaic), Urban Core (Essex, Hudson), Route 1 Corridor (Mercer, Middlesex, Union), Central Hills (Hunterdon, Morris, Somerset), Northern Shore (Monmouth, Ocean), Delaware Valley (Burlington, Camden, Gloucester), Garden Core (Atlantic, Cape May, Cumberland, Salem, Sussex, Warren).
| DEMOGRAPHICS (weighted) |
| Self-Reported |
| 24% Republican |
| 40% Independent |
| 36% Democrat |
| 49% Male |
| 51% Female |
| 28% 18-34 |
| 34% 35-54 |
| 38% 55+ |
| 58% White |
| 12% Black |
| 19% Hispanic |
| 11% Asian/Other |
| 61% No degree |
| 39% 4 year degree |
Click on pdf file link below for full methodology and crosstabs by key demographic groups.


