
West Long Branch, NJ – New Jersey residents’ views of the quality of life in their home state have tumbled to an all-time low. Currently, just half the public gives positive marks to the Garden State as a place to live. At the same time, the Monmouth University Poll also finds that residents’ opinions of their own local communities remain positive and have not changed much at all over the past year.
Just half of New Jersey residents say the state is either an excellent (11%) or good (39%) place to call home, while 32% say it is only fair and 17% rate it as poor. The current positive rating of 50% has dropped from the 54% result in last year’s Monmouth poll, marking an all-time low for this metric in New Jersey opinion polls going back to 1980. Over the past decade, this rating has generally been in the mid-60s. Prior to that, positive rating of the state was frequently in the 70s, even reaching as high as 84% in 1987.
“Yikes! The state rating has bounced around the last few years, but this latest result marks a precipitous drop from any prior reading. This is a huge warning sign for the state’s political leadership. If New Jerseyans aren’t confident that the situation will turn around, they will start voting with their feet,” said Patrick Murray, director of the independent Monmouth University Polling Institute.
Monmouth’s exclusive Garden State Quality of Life Index score now stands at a record low of +13, which is down from +18 in April 2018 and +25 in July 2017. Over the past eight years, this index had ranged from +18 to a high of +31 (April 2012).
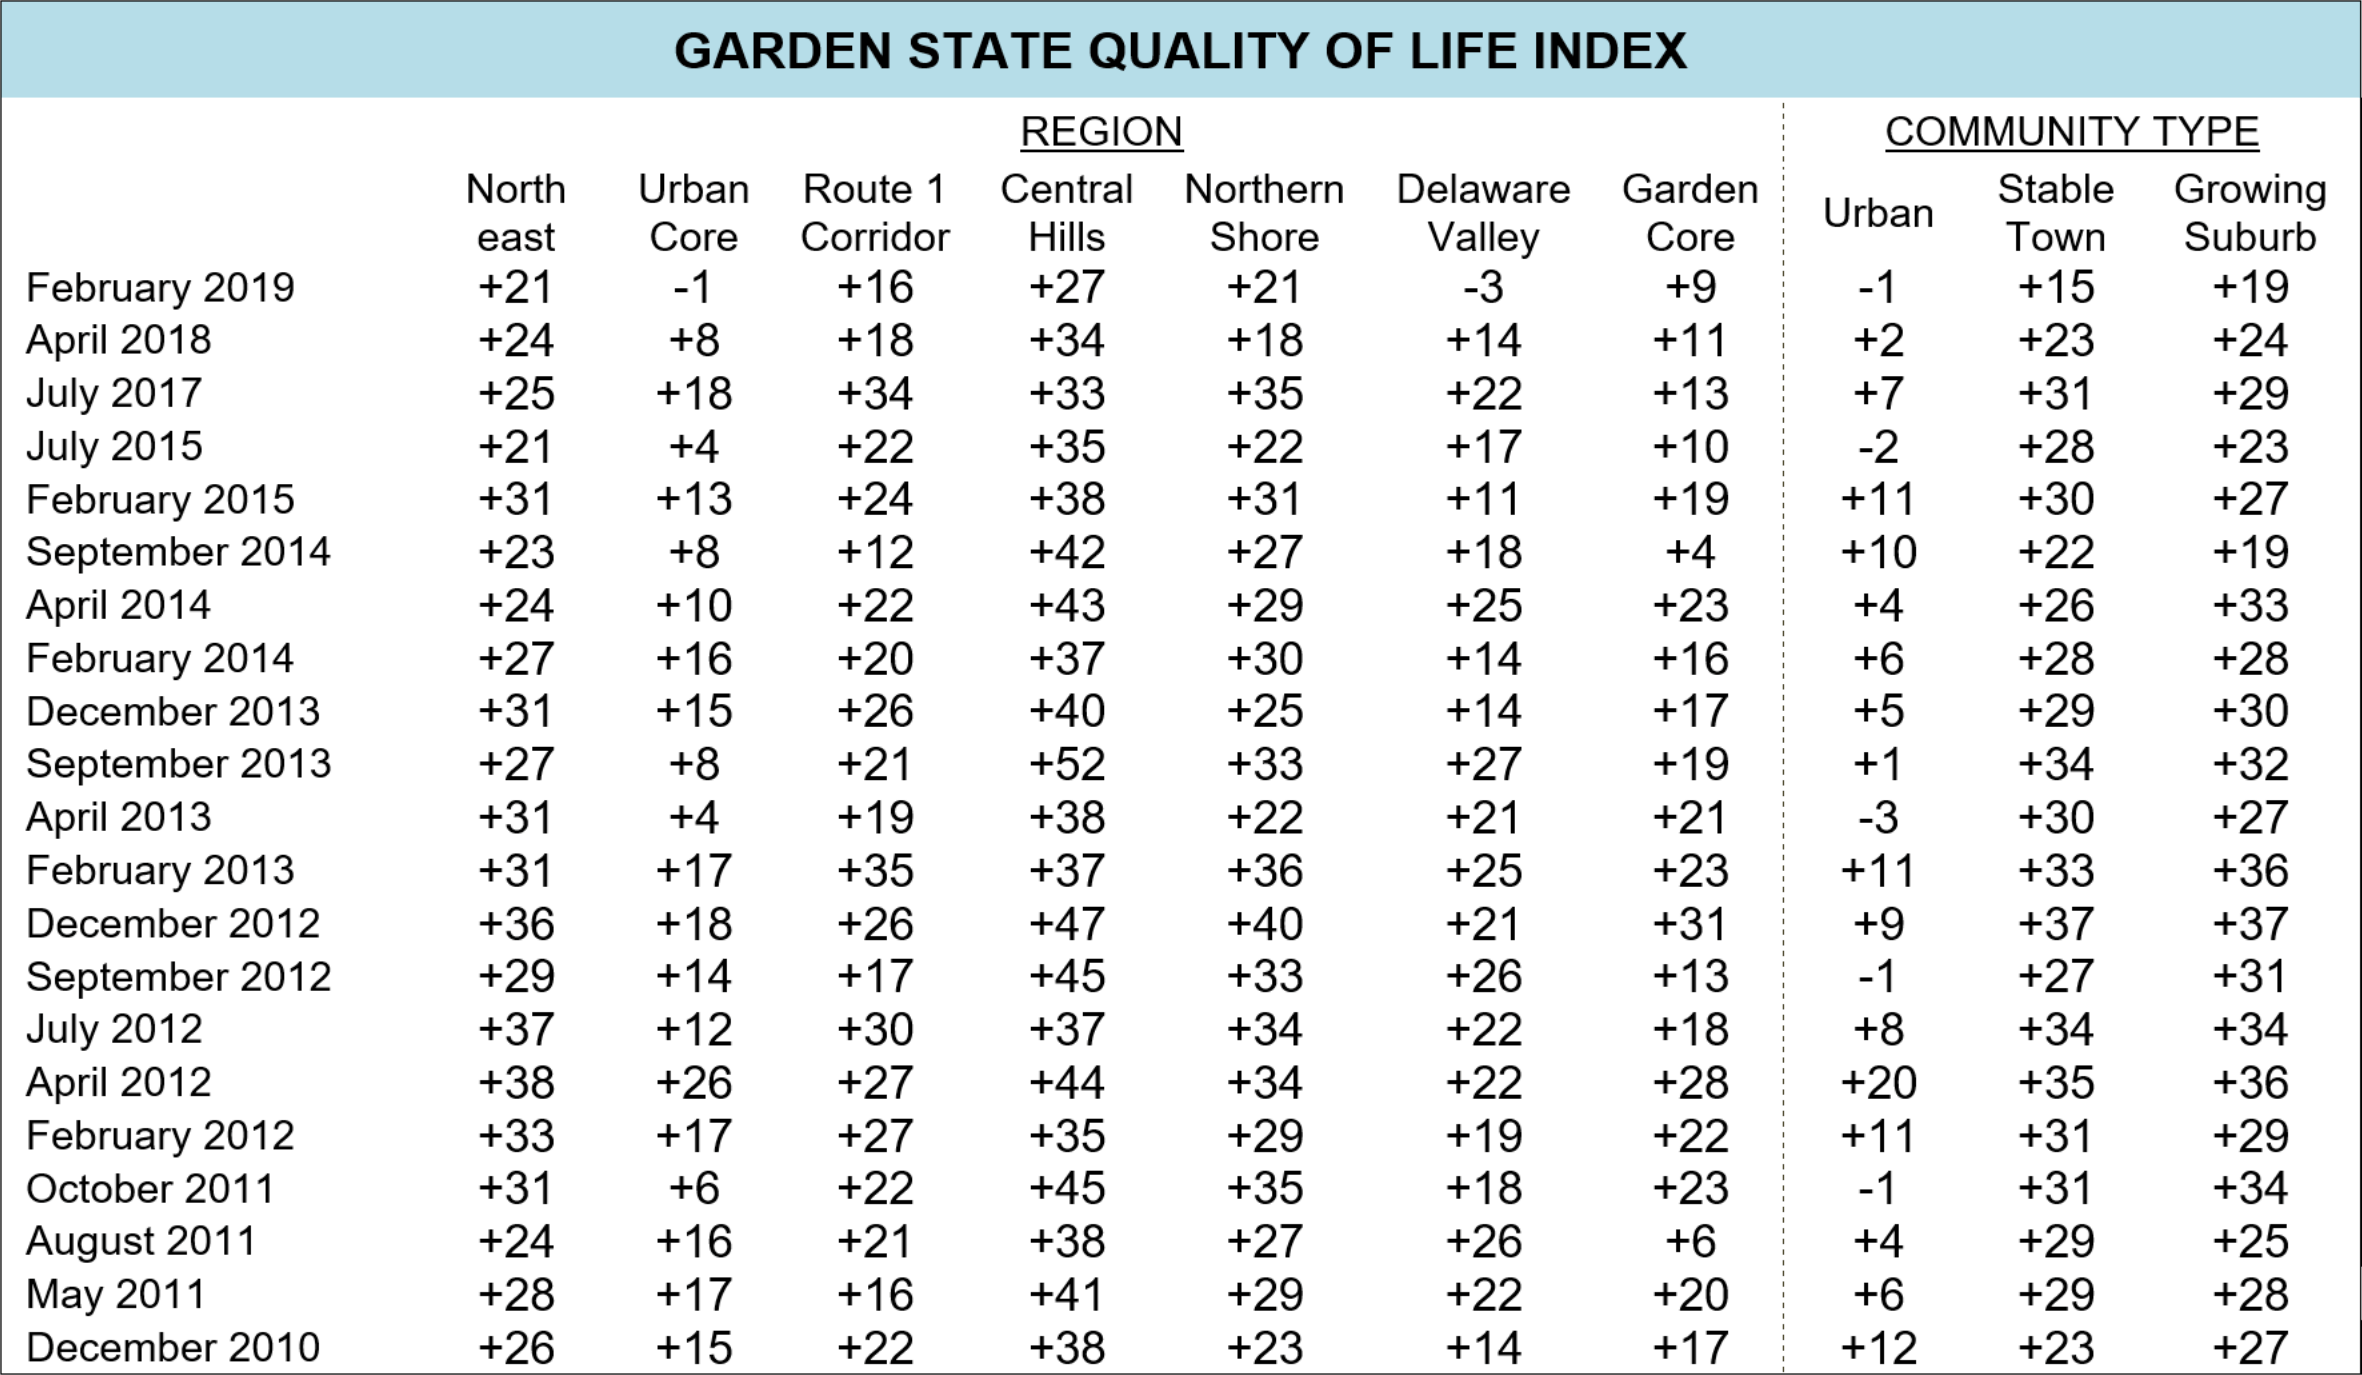
The quality of life index score took its biggest hit in the Philadelphia suburbs, dropping 17 points from a +14 score last year to –3 currently in the Delaware Valley (Burlington, Camden, Gloucester). A significant 9 point drop was also recorded in the state’s Urban Core (Essex, Hudson) going from +8 last year to –1 in the current poll. While the affluent Central Hills area (Hunterdon, Morris, Somerset) retains the highest index score at +27, this is down 7 points from +34 last year. The Northern Shore (Monmouth, Ocean) is the only region where the index score has ticked up over the past year, from +18 to +21. The Garden State Quality of Life Index has been more stable in the Northeast region (from +24 to +21), the Route 1 Corridor (from +18 to +16), and the less populated Garden Core counties (from +11 to +9).
The Garden State Quality of Life Index was created by the Monmouth University Polling Institute in 2010 to serve as a resident-based indicator of the quality of life offered by the state of New Jersey. The index is based on five separate poll questions: overall opinion of the state as a place to live – which contributes half the index score – and ratings of one’s hometown, the performance of local schools, the quality of the local environment, and feelings of safety in one’s own neighborhood. The index can potentially range from -100 to +100.
Two-in-three New Jerseyans rate their own town or city as an excellent (30%) or good (37%) place to live, with 21% saying it is only fair and 11% rating it as poor. The current 67% positive rating for local communities is down from 71% last year and is at the lower end of the range for this question since 2000.
The percentage of Garden State residents who currently say they feel very safe in their own neighborhoods at night (64%) is similar to last year’s poll (65%). Another 29% say they feel somewhat safe and 7% do not feel safe at all. This result is within the range for this question over the past decade.
Ratings for the job local schools are doing stands at 59% positive – 19% excellent and 40% good – which is similar to the 60% result in 2018. Another 22% rate their schools as only fair and 10% say they are poor.
The current poll registers relatively high ratings for local environmental quality at 71% positive – 27% excellent and 44% good – which is just slightly off last year’s mark of 73%. Another 21% rate the local environment as only fair and 8% say it is poor.
“New Jerseyans seem to separate their views of the state as a whole from how they feel about their own neighborhoods. The question is how much longer this can go on before statewide problems override the benefits of living in their local community,” said Murray. Monmouth released a poll earlier this month where 45% of New Jerseyans named property taxes as the state’s most pressing issue.
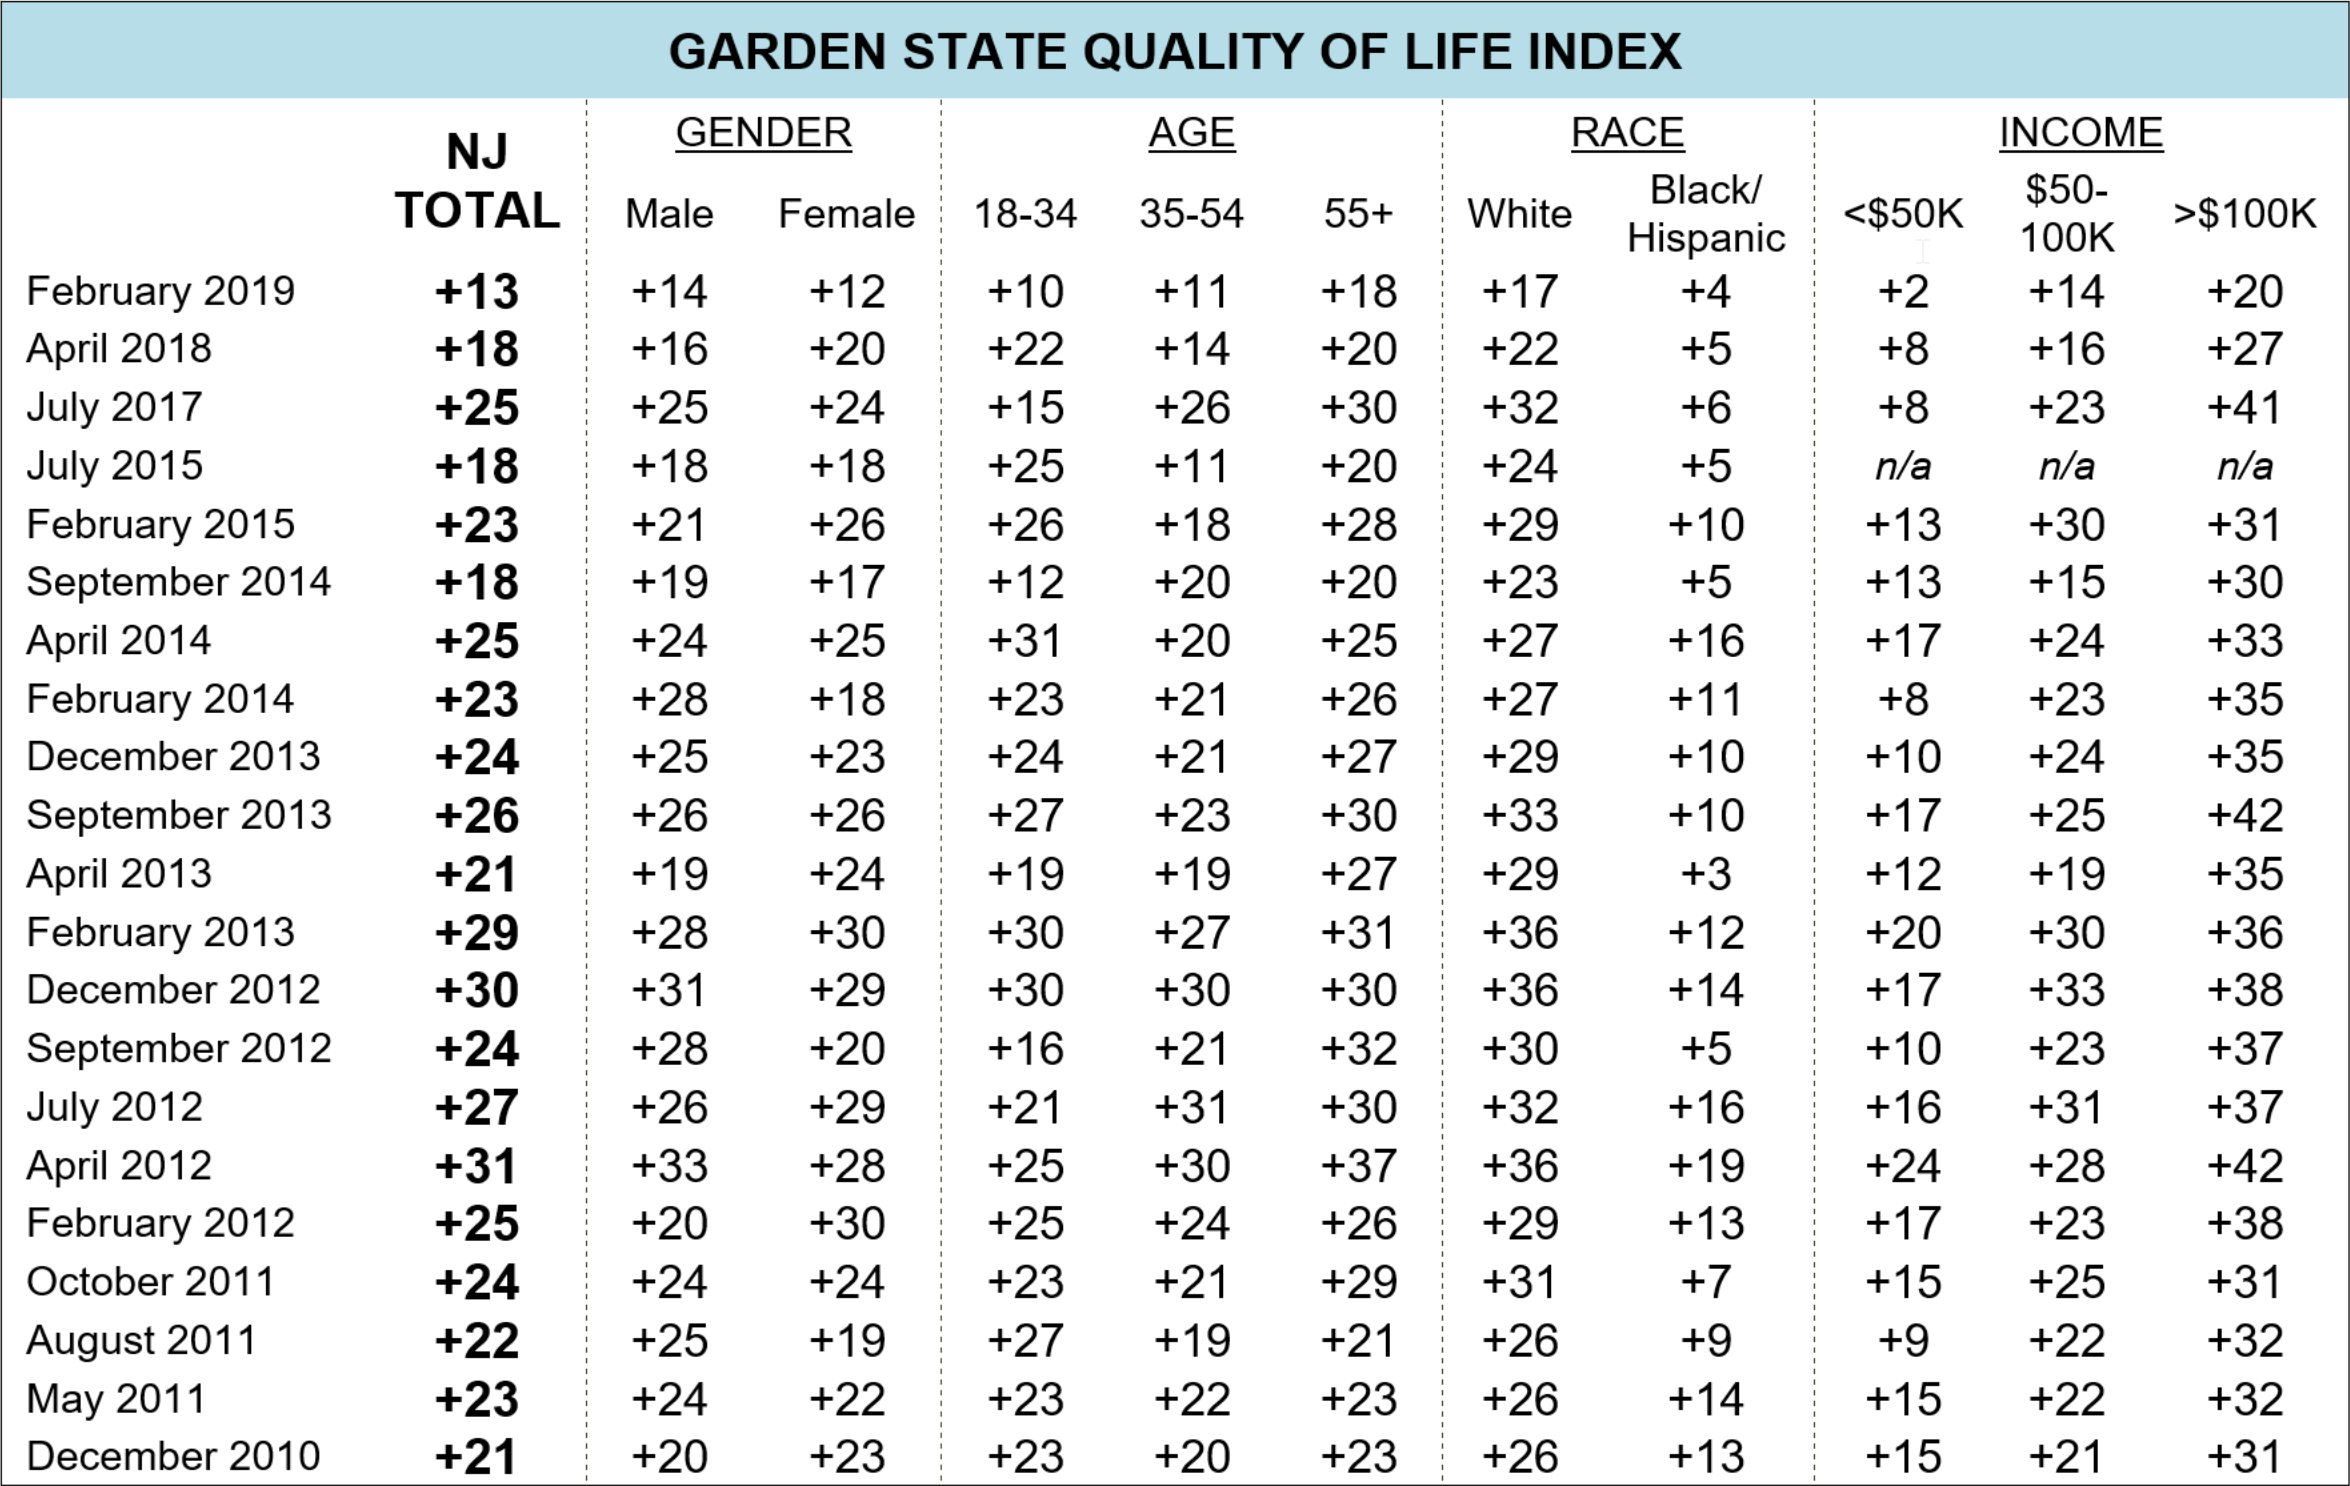
There have been a number of demographic shifts in the key state rating question since last year. Positive reviews of New Jersey as a place to live have held steady among men (47%) while they have dropped by 9 points among women (51%). By age, the state rating has dropped 11 points among those 18 to 34 years old (47%) and by 5 points among those 35 to 54 years old (47%) but has ticked up 2 points among those age 55 and older (54%). The state rating has dropped by 7 points among white non-Hispanic residents (49%) but is an insignificant one point higher among New Jerseyans of color (52%) compared to last year. The state rating is down by 12 points among those earning over $100,000 a year (49%), but it has actually increased by 10 points among those earning less than $50,000 (57%). The rating is down 3 points among those earning between $50,000 and $100,000 (48%).
“Older low-income residents seem to be okay with the direction New Jersey is going. It’s the younger wealth generators who are increasingly unhappy with it. Policymakers have to ask themselves how the state will be able to serve the first group if the latter group flees the state,” said Murray.
The Monmouth University Poll was conducted by telephone from February 8 to 10, 2019 with 604 New Jersey adults. The question results in this release have a margin of error of +/- 4.0 percentage points. The poll was conducted by the Monmouth University Polling Institute in West Long Branch, NJ.
QUESTIONS AND RESULTS
(* Some columns may not add to 100% due to rounding.)
undefined. Overall, how would you rate New Jersey as a place to live – excellent, good, only fair, or poor?
| TREND: |
Excellent/ | Excellent | Good | Only Fair | Poor | (VOL) Don’t know |
(n) |
|
February 2019 | 50% | 11% | 39% | 32% | 17% | 1% | (604) |
|
April 2018 | 54% | 15% | 39% | 29% | 17% | 1% | (703) |
|
July 2017 | 59% | 15% | 44% | 28% | 13% | 0% | (800) |
|
May 2016 | 62% | 16% | 46% | 28% | 10% | 0% | (806) |
|
July 2015 | 55% | 12% | 43% | 30% | 15% | 0% | (503) |
|
May 2015 | 63% | 13% | 50% | 27% | 10% | 1% | (500) |
|
February 2015 | 63% | 15% | 48% | 25% | 11% | 1% | (805) |
|
September 2014 | 61% | 13% | 48% | 25% | 13% | 1% | (802) |
|
June 2014 | 62% | 15% | 47% | 26% | 11% | 0% | (800) |
|
April 2014 | 64% | 15% | 49% | 26% | 10% | 0% | (803) |
|
February 2014 | 63% | 15% | 48% | 26% | 11% | 0% | (803) |
|
December 2013 | 65% | 20% | 45% | 26% | 9% | 0% | (802) |
|
September 2013 | 65% | 19% | 46% | 25% | 10% | 1% | (783) |
|
April 2013 | 61% | 15% | 46% | 27% | 11% | 0% | (806) |
|
February 2013 | 68% | 18% | 50% | 24% | 7% | 1% | (803) |
|
December 2012 | 72% | 20% | 52% | 21% | 5% | 1% | (816) |
|
September 2012 | 65% | 15% | 50% | 23% | 11% | 0% | (805) |
|
July 2012 | 69% | 17% | 52% | 23% | 8% | 0% | (803) |
|
April 2012 | 70% | 20% | 50% | 23% | 7% | 0% | (804) |
|
February 2012 | 62% | 15% | 47% | 26% | 11% | 1% | (803) |
|
October 2011 | 67% | 15% | 52% | 24% | 8% | 0% | (817) |
|
August 2011 | 57% | 14% | 43% | 31% | 11% | 1% | (802) |
|
May 2011 | 59% | 14% | 45% | 29% | 11% | 0% | (807) |
|
December 2010 | 63% | 17% | 46% | 26% | 10% | 1% | (2864) |
|
October 2007 | 63% | 17% | 46% | 25% | 12% | 1% | (1001) |
|
August 2004 | 68% | 22% | 46% | 21% | 10% | 1% | (800) |
|
May 2003 | 72% | 20% | 52% | 23% | 5% | 0% | (1002) |
|
April 2001 | 76% | 23% | 53% | 19% | 4% | 1% | (802) |
|
March 2000 | 76% | 25% | 51% | 17% | 6% | 0% | (800) |
|
May 1999 | 76% | 22% | 54% | 19% | 5% | 0% | (800) |
|
February 1994 | 71% | 18% | 53% | 22% | 7% | 0% | (801) |
|
March 1990 | 68% | 21% | 47% | 25% | 6% | 1% | (800) |
|
February 1988 | 78% | 27% | 51% | 17% | 4% | 1% | (800) |
|
February 1987 | 84% | 31% | 53% | 11% | 4% | 0% | (800) |
|
May 1985 | 81% | 29% | 52% | 14% | 3% | 1% | (500) |
|
October 1984 | 80% | 29% | 51% | 15% | 4% | 1% | (1000) |
|
January 1981 | 66% | 16% | 50% | 26% | 7% | 1% | (1003) |
|
July 1980 | 68% | 18% | 50% | 23% | 7% | 2% | (1005) |
[Q2-24 previously released.]
25. How would you rate your town or city as a place to live – excellent, good, only fair, or poor?
| TREND: |
Excellent/ | Excellent | Good | Only Fair | Poor | (VOL) Don’t know |
(n) |
|
February 2019 | 67% | 30% | 37% | 21% | 11% | 0% | (604) |
|
April 2018 | 71% | 30% | 41% | 20% | 9% | 0% | (703) |
|
July 2017 | 77% | 37% | 40% | 16% | 7% | 0% | (800) |
|
July 2015 | 71% | 29% | 42% | 19% | 10% | 0% | (503) |
|
February 2015 | 72% | 29% | 43% | 21% | 7% | 0% | (805) |
|
September 2014 | 69% | 24% | 45% | 22% | 10% | 0% | (802) |
|
April 2014 | 71% | 27% | 44% | 20% | 9% | 0% | (803) |
|
February 2014 | 70% | 31% | 39% | 23% | 7% | 0% | (803) |
|
December 2013 | 70% | 29% | 41% | 21% | 8% | 1% | (802) |
|
September 2013 | 72% | 32% | 40% | 18% | 9% | 1% | (783) |
|
April 2013 | 67% | 29% | 38% | 25% | 8% | 0% | (806) |
|
February 2013 | 73% | 30% | 43% | 20% | 7% | 0% | (803) |
|
December 2012 | 74% | 32% | 42% | 17% | 9% | 0% | (816) |
|
September 2012 | 72% | 33% | 39% | 19% | 9% | 0% | (805) |
|
July 2012 | 74% | 32% | 42% | 18% | 7% | 1% | (803) |
|
April 2012 | 76% | 34% | 42% | 17% | 7% | 0% | (804) |
|
February 2012 | 74% | 33% | 41% | 21% | 5% | 0% | (803) |
|
October 2011 | 73% | 26% | 47% | 20% | 8% | 0% | (817) |
|
August 2011 | 76% | 28% | 48% | 18% | 6% | 0% | (802) |
|
May 2011 | 73% | 33% | 40% | 20% | 7% | 0% | (807) |
|
December 2010 | 73% | 27% | 46% | 20% | 8% | 0% | (2864) |
|
May 2003 | 74% | 29% | 45% | 19% | 7% | 0% | (1002) |
|
April 2001 | 73% | 28% | 45% | 21% | 6% | 0% | (802) |
|
May 1995 | 70% | 30% | 40% | 21% | 8% | 0% | (802) |
|
June 1994 | 72% | 31% | 41% | 19% | 9% | 0% | (801) |
|
September 1988 | 72% | 26% | 46% | 18% | 9% | 1% | (500) |
|
October 1984 | 71% | 30% | 41% | 21% | 7% | 1% | (999) |
|
June 1980 | 67% | 23% | 44% | 24% | 9% | 0% | (1005) |
|
May 1977 | 66% | 25% | 41% | 24% | 10% | 0% | (1005) |
[QUESTIONS 26-28 WERE ROTATED]
26. How would you rate the quality of the environment in the area where you live – excellent, good, only fair, or poor?
| TREND: |
Excellent/ | Excellent | Good | Only Fair | Poor | (VOL) Don’t know |
(n) |
|
February 2019 | 71% | 27% | 44% | 21% | 8% | 0% | (604) |
|
April 2018 | 73% | 29% | 44% | 20% | 6% | 1% | (703) |
|
July 2017 | 76% | 37% | 39% | 14% | 8% | 1% | (800) |
|
July 2015 | 71% | 27% | 44% | 20% | 9% | 0% | (503) |
|
February 2015 | 72% | 27% | 45% | 23% | 4% | 0% | (805) |
|
September 2014 | 72% | 24% | 48% | 21% | 5% | 1% | (802) |
|
April 2014 | 76% | 27% | 49% | 18% | 6% | 0% | (803) |
|
February 2014 | 73% | 29% | 44% | 21% | 6% | 0% | (803) |
|
December 2013 | 69% | 27% | 42% | 24% | 7% | 0% | (802) |
|
September 2013 | 75% | 30% | 45% | 18% | 7% | 1% | (783) |
|
April 2013 | 70% | 27% | 43% | 22% | 7% | 0% | (806) |
|
February 2013 | 71% | 26% | 45% | 24% | 4% | 2% | (803) |
|
December 2012 | 73% | 25% | 48% | 20% | 7% | 1% | (816) |
|
September 2012 | 72% | 30% | 42% | 20% | 7% | 0% | (805) |
|
July 2012 | 74% | 30% | 44% | 19% | 7% | 1% | (803) |
|
April 2012 | 75% | 30% | 45% | 18% | 6% | 1% | (804) |
|
February 2012 | 77% | 29% | 48% | 17% | 5% | 0% | (803) |
|
October 2011 | 72% | 25% | 47% | 19% | 9% | 0% | (817) |
|
August 2011 | 79% | 31% | 48% | 16% | 5% | 0% | (802) |
|
May 2011 | 79% | 33% | 46% | 15% | 6% | 0% | (807) |
|
December 2010 | 66% | 14% | 52% | 25% | 9% | 0% | (2864) |
|
April 2001 | 70% | 27% | 43% | 22% | 7% | 1% | (402) |
|
September 1988 | 53% | 10% | 43% | 31% | 15% | 1% | (500) |
27. How would you rate the job your local schools are doing – excellent, good, only fair, or poor?
| TREND: |
Excellent/ | Excellent | Good | Only Fair | Poor | (VOL) Don’t know |
(n) |
|
February 2019 | 59% | 19% | 40% | 22% | 10% | 9% | (604) |
|
April 2018 | 60% | 24% | 36% | 23% | 10% | 7% | (703) |
|
July 2017 | 65% | 26% | 39% | 20% | 10% | 6% | (800) |
|
July 2015 | 60% | 27% | 33% | 22% | 9% | 8% | (503) |
|
February 2015 | 61% | 21% | 40% | 24% | 8% | 7% | (805) |
|
September 2014 | 60% | 21% | 39% | 24% | 9% | 7% | (802) |
|
April 2014 | 63% | 24% | 39% | 22% | 9% | 6% | (803) |
|
February 2014 | 61% | 22% | 39% | 22% | 10% | 7% | (803) |
|
December 2013 | 60% | 20% | 40% | 23% | 12% | 5% | (802) |
|
September 2013 | 62% | 24% | 38% | 21% | 7% | 9% | (783) |
|
April 2013 | 59% | 21% | 38% | 27% | 9% | 5% | (806) |
|
February 2013 | 64% | 24% | 40% | 20% | 7% | 9% | (803) |
|
December 2012 | 61% | 21% | 40% | 23% | 7% | 9% | (816) |
|
September 2012 | 61% | 27% | 34% | 21% | 10% | 8% | (805) |
|
July 2012 | 61% | 22% | 39% | 20% | 11% | 8% | (803) |
|
April 2012 | 63% | 23% | 40% | 21% | 7% | 8% | (804) |
|
February 2012 | 68% | 26% | 42% | 16% | 8% | 8% | (803) |
|
October 2011 | 60% | 21% | 39% | 20% | 13% | 7% | (817) |
|
August 2011 | 63% | 19% | 44% | 26% | 6% | 5% | (802) |
|
May 2011 | 63% | 24% | 39% | 22% | 10% | 6% | (807) |
|
December 2010 | 64% | 24% | 40% | 23% | 8% | 5% | (2864) |
|
August 2004 | 61% | 24% | 37% | 17% | 12% | 9% | (800) |
|
April 2001 | 64% | 21% | 43% | 21% | 6% | 9% | (802) |
|
September 1999 | 62% | 18% | 44% | 21% | 9% | 8% | (802) |
|
September 1998 | 62% | 20% | 42% | 23% | 9% | 7% | (804) |
|
February 1996 | 60% | 20% | 40% | 20% | 11% | 9% | (804) |
|
September 1993 | 52% | 16% | 36% | 29% | 14% | 5% | (801) |
|
January 1992 | 53% | 15% | 38% | 26% | 15% | 5% | (800) |
|
October 1987 | 60% | 14% | 46% | 23% | 6% | 11% | (500) |
|
October 1986 | 55% | 15% | 40% | 26% | 10% | 9% | (800) |
|
October 1983 | 59% | 16% | 43% | 23% | 10% | 8% | (802) |
|
May 1978 | 52% | 12% | 40% | 25% | 12% | 11% | (1003) |
28. How safe do you feel in your neighborhood at night – very safe, somewhat safe, or not at all safe?
| TREND: |
Very | Somewhat safe | Not at all safe | (VOL) Don’t know |
(n) |
|
February 2019 | 64% | 29% | 7% | 0% | (604) |
|
April 2018 | 65% | 29% | 5% | 0% | (703) |
|
July 2017 | 71% | 22% | 6% | 0% | (800) |
|
July 2015 | 67% | 27% | 6% | 0% | (503) |
|
February 2015 | 62% | 33% | 4% | 0% | (805) |
|
September 2014 | 58% | 36% | 6% | 0% | (802) |
|
April 2014 | 66% | 30% | 4% | 1% | (803) |
|
February 2014 | 67% | 28% | 6% | 0% | (803) |
|
December 2013 | 60% | 33% | 7% | 0% | (802) |
|
September 2013 | 65% | 27% | 7% | 1% | (783) |
|
April 2013 | 66% | 28% | 6% | 0% | (806) |
|
February 2013 | 63% | 30% | 6% | 1% | (803) |
|
December 2012 | 64% | 29% | 6% | 1% | (816) |
|
September 2012 | 65% | 25% | 6% | 0% | (805) |
|
July 2012 | 60% | 32% | 7% | 1% | (803) |
|
April 2012 | 64% | 31% | 5% | 1% | (804) |
|
February 2012 | 62% | 32% | 5% | 0% | (803) |
|
October 2011 | 62% | 31% | 7% | 0% | (817) |
|
August 2011 | 63% | 31% | 6% | 0% | (802) |
|
May 2011 | 68% | 27% | 5% | 0% | (807) |
|
December 2010 | 59% | 35% | 6% | 0% | (2864) |
|
February 1993 | 42% | 44% | 13% | 0% | (801) |
|
October 1987 | 51% | 36% | 11% | 2% | (499) |
|
October 1984 | 53% | 36% | 9% | 2% | (500) |
|
May 1981 | 43% | 43% | 13% | 1% | (497) |
[Q29-37 held for future release.]
Note: All trend results prior to 2005 come from Rutgers University’s Eagleton Poll.
METHODOLOGY
The Monmouth University Poll was sponsored and conducted by the Monmouth University Polling Institute from February 8 to 10, 2019 with a random sample of 604 New Jersey adults age 18 and older, in English. This includes 301 contacted by a live interviewer on a landline telephone and 303 contacted by a live interviewer on a cell phone. Telephone numbers were selected through random digit dialing and landline respondents were selected with a modified Troldahl-Carter youngest adult household screen. Monmouth is responsible for all aspects of the survey design, data weighting and analysis. Final sample is weighted for region, age, education, gender and race based on US Census information. Data collection support provided by Braun Research (field) and SSI (RDD sample). For results based on this sample, one can say with 95% confidence that the error attributable to sampling has a maximum margin of plus or minus 4.0 percentage points (unadjusted for sample design). Sampling error can be larger for sub-groups (see table below). In addition to sampling error, one should bear in mind that question wording and practical difficulties in conducting surveys can introduce error or bias into the findings of opinion polls.
Region in this report is defined by county boundaries: Northeast (Bergen, Passaic), Urban Core (Essex, Hudson), Route 1 Corridor (Mercer, Middlesex, Union), Central Hills (Hunterdon, Morris, Somerset), Northern Shore (Monmouth, Ocean), Delaware Valley (Burlington, Camden, Gloucester), and Garden Core (Atlantic, Cape May, Cumberland, Salem, Sussex, Warren).
| DEMOGRAPHICS (weighted) |
| Self-Reported |
| 20% Republican |
| 45% Independent |
| 34% Democrat |
| 48% Male |
| 52% Female |
| 29% 18-34 |
| 37% 35-54 |
| 34% 55+ |
| 58% White |
| 13% Black |
| 18% Hispanic |
| 10% Asian/Other |
| 64% No college degree |
| 36% College graduate |
Click on pdf file link below for full methodology and crosstabs by key demographic groups.


