West Long Branch, NJ – Two first-term Democratic U.S. House incumbents in Iowa are leading in their reelection bids, although the contest in CD3, featuring a rematch from 2018, is a little closer than in CD1. The Monmouth (“Mon-muth”) University Poll finds contrasting pictures for the state’s two open-seat races. Democratic-held CD3 is a tight contest right now, while in CD4, the Republican is on track to retain the only GOP-held seat in Iowa’s House delegation.
“At the current stage of the race, voters seem willing to give both Democratic incumbents a second term. The only Democratic-held seat prior to 2018 is the one most likely to flip right now. It looks like Republicans can breathe a sigh of relief in the fourth district with Steve King out of the picture,” said Patrick Murray, director of the independent Monmouth University Polling Institute.
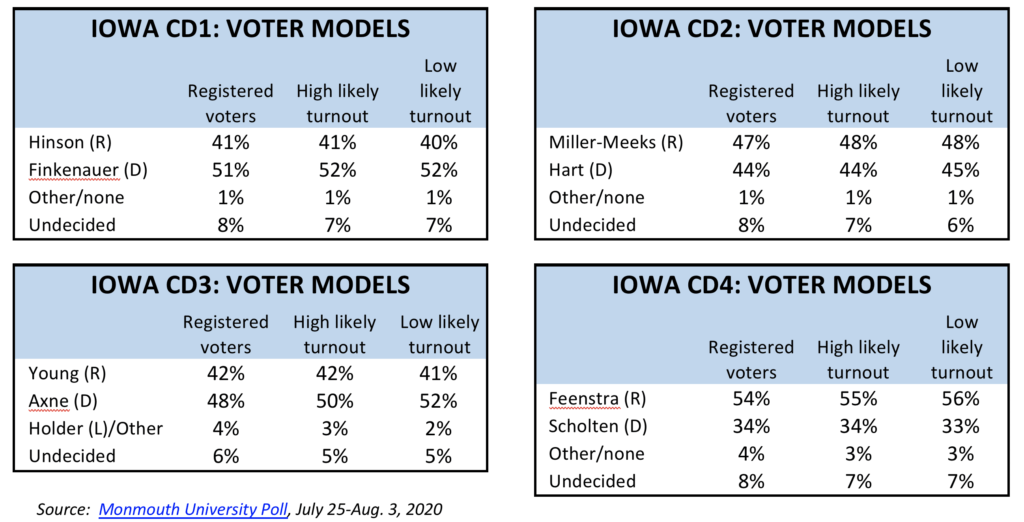
CD1: First-term Rep. Abby Finkenauer holds a sizable lead over state legislator Ashley Hinson in her bid to win a second term. The race stands at 51% for the Democrat to 41% for the Republican among all registered voters, with 8% undecided. The incumbent maintains her advantage among likely voters in both a high turnout scenario (52% to 41%) and in a low turnout scenario (52% to 40%).
Finkenauer has an 18 point edge (57% to 39%) in the four counties she won by just over 13 points in 2018 (including Black Hawk, Dubuque, Linn, Winneshiek). The race is virtually tied – 43% Hinson and 42% Finkenauer – in the remaining counties, which former Rep. Rod Blum won by 9 points combined two years ago. Men are divided 46% for Hinson and 44% for Finkenauer, but women prefer the incumbent by a 58% to 34% margin.
CD2: The tightest battle in the state is the open-seat race to replace the retiring 14-year incumbent, Dave Loebsack. Among registered voters in the district, Republican Mariannette Miller-Meeks has 47% and Democrat Rita Hart has 44%, with 8% undecided. This is Miller-Meeks’ fourth bid for the seat. She lost by 18 points in 2008, but came within 5 points of defeating Loebsack in both 2010 and 2014. The Republican maintains a slight edge among likely voters in both a high turnout scenario (48% to 44%) and in a low turnout scenario (48% to 45%).
Hart only has a 8 point edge (50% to 42%) in the nine counties that Loebsack won by 23 points in 2018 (including Cedar, Clinton, Des Moines, Jefferson, Johnson, Lee, Muscatine, Scott, Wapello). Miller-Meeks, on the other hand, has a commanding 34 point lead (61% to 27%) in the counties that Loebsack lost by a combined 14 points. Men overwhelmingly back Miller-Meeks by 60% to 33%, while women prefer Hart by a 55% to 33% margin.
CD3: In a rematch of the 2018 contest that saw this district flip from Republican to Democrat, first-term incumbent Cindy Axne has a small 48% to 42% lead over former Rep. David Young among registered voters. Another 2% back Libertarian Bryan Jack Holder and 6% are undecided. The Democrat’s lead increases slightly among likely voters in both a high turnout scenario (50% to 42%) and in a low turnout scenario (52% to 41%).
Axne has a 21 point lead (56% to 35%) in populous Polk County, which she won by 16 points in 2018. Young has a 14 point lead (52% to 38%) in the remainder of the district – an area he won by 17 points two years ago. Men back Young by 49% to 41% for Axne, but women prefer the incumbent by a larger 57% to 34% margin.
CD4: The outlook for this race changed dramatically when long-time Rep. Steve King lost the Republican primary to Randy Feenstra. Democrat J.D. Scholten was hoping to improve on his narrow 3-point loss to the controversial incumbent two years ago, but the current poll results suggest otherwise. Feenstra has a commanding 54% to 34% lead over Scholten among registered voters, with 8% undecided. The Republican’s advantage widens among likely voters in both a high turnout scenario (55% to 34%) and in a low turnout scenario (56% to 33%).
Scholten has a 7 point lead (48% to 41%) in the six counties he won by 17 points in 2018 (including Boone, Cerro Gordo, Floyd, Story, Webster, Woodbury). Feenstra, though, has amassed a 40 point advantage (64% to 24%) in the remaining counties that King won by 17 points as a group two years ago. Feenstra leads among both men (63% to 26%) and women (47% to 42%).
The Monmouth University Poll was conducted by telephone and online from July 25 to August 3, 2020 with 1,665 Iowa registered voters sampled from a voter list file. The question results in this release have a margin of error between +/- 4.4 and +/- 5.1 percentage points, depending on the congressional district. The poll was conducted by the Monmouth University Polling Institute in West Long Branch, NJ.
QUESTIONS AND RESULTS
(* Some columns may not add to 100% due to rounding.)
[Note: the following is Question #5 from the Iowa statewide telephone poll previously released.]
CD1.If the election for U.S. House of Representatives in your district was held today, would you vote for Ashley Hinson the Republican or Abby Finkenauer the Democrat? [NAMES WERE ROTATED] [If UNDECIDED: If you had to vote for one of the following candidates at this moment, who do you lean toward – Ashley Hinson or Abby Finkenauer?]
| REGISTERED VOTERS (with leaners) | August 2020 |
| Ashley Hinson | 41% |
| Abby Finkenauer | 51% |
| (VOL) Other | 1% |
| (VOL) No one | <1% |
| (VOL) Undecided | 8% |
| (n) | (391) |
CD2.If the election for U.S. House of Representatives in your district was held today, would you vote for Mariannette Miller-Meeks the Republican or Rita Hart the Democrat? [NAMES WERE ROTATED] [If UNDECIDED: If you had to vote for one of the following candidates at this moment, who do you lean toward – Mariannette Miller-Meeks or Rita Hart?]
| REGISTERED VOTERS (with leaners) | August 2020 |
| Mariannette Miller-Meeks | 47% |
| Rita Hart | 44% |
| (VOL) Other | <1% |
| (VOL) No one | 1% |
| (VOL) Undecided | 8% |
| (n) | (374) |
CD3.If the election for U.S. House of Representatives in your district was held today, would you vote for David Young the Republican, Cindy Axne the Democrat, or Bryan Jack Holder the Libertarian? [NAMES WERE ROTATED] [If UNDECIDED: If you had to vote for one of the following candidates at this moment, who do you lean toward – David Young or Cindy Axne?]
| REGISTERED VOTERS (with leaners) | August 2020 |
| David Young | 42% |
| Cindy Axne | 48% |
| Bryan Jack Holder | 2% |
| (VOL) Other | 1% |
| (VOL) No one | 1% |
| (VOL) Undecided | 6% |
| (n) | (507) |
CD4.If the election for U.S. House of Representatives in your district was held today, would you vote for Randy Feenstra the Republican or J.D. Scholten the Democrat? [NAMES WERE ROTATED] [If UNDECIDED: If you had to vote for one of the following candidates at this moment, who do you lean toward – Randy Feenstra or J.D. Scholten?]
| REGISTERED VOTERS (with leaners) | August 2020 |
| Randy Feenstra | 54% |
| J.D. Scholten | 34% |
| (VOL) Other | 1% |
| (VOL) No one | 3% |
| (VOL) Undecided | 8% |
| (n) | (393) |
METHODOLOGY
The Monmouth University Poll was sponsored and conducted by the Monmouth University Polling Institute from July 25 to August 3, 2020 with a statewide random sample of 1,665 Iowa voters drawn from a list of registered voters. This includes 401 contacted by a live interviewer in English (176 on a landline telephone and 225 on a cell phone) and 1,264 conducted online in English recruited via email invitation from a voter list file. Monmouth is responsible for all aspects of the survey design, data weighting and analysis. The full sample is weighted for party registration, age, gender, race, education, and region based on state voter registration list information and U.S. Census information (CPS 2018 supplement). Data collection support provided by Braun Research (phone field) and Aristotle (phone and email voter samples). For results based on the full voter sample, one can say with 95% confidence that the error attributable to sampling has a maximum margin of plus or minus 4.4 to 5.1 percentage points (unadjusted for sample design), depending on the congressional district. Sampling error can be larger for sub-groups (see table below). In addition to sampling error, one should bear in mind that question wording and practical difficulties in conducting surveys can introduce error or bias into the findings of opinion polls.
| DEMOGRAPHICS (weighted) REGISTERED VOTERS | ||||
| CD 1 | CD 2 | CD 3 | CD 4 | |
| Party Registration | ||||
| Republican | 30% | 31% | 34% | 41% |
| Other/none | 35% | 33% | 31% | 33% |
| Democrat | 35% | 36% | 35% | 26% |
| Self-Reported Party | ||||
| Republican | 30% | 32% | 32% | 40% |
| Independent | 39% | 35% | 34% | 38% |
| Democrat | 31% | 33% | 33% | 21% |
| Male | 50% | 50% | 49% | 51% |
| Female | 50% | 50% | 51% | 49% |
| 18-34 | 22% | 22% | 22% | 22% |
| 35-49 | 21% | 22% | 25% | 20% |
| 50-64 | 27% | 26% | 27% | 27% |
| 65+ | 30% | 29% | 26% | 31% |
| White, non-Hispanic | 93% | 91% | 89% | 93% |
| Other | 7% | 10% | 11% | 7% |
| No degree | 71% | 65% | 59% | 76% |
| 4 year degree | 29% | 35% | 41% | 24% |
Click on pdf file link below for full methodology and crosstabs by key demographic groups.