West Long Branch, NJ – Both the presidential contest and the U.S. Senate race in Iowa are very competitive according to the Monmouth (“Mon-muth”) University Poll. Democrats are more likely than Republicans to say they will take advantage of the vote by mail application all voters will receive this fall. In other issues, Iowans part ways with their governor on how much in-person instruction schools should be required to provide this fall.
Among all registered voters in Iowa, Donald Trump is supported by 48% and Joe Biden is supported by 45%. Another 3% say they will vote for Libertarian Jo Jorgensen and 3% are undecided. These results include 38% who are certain to vote for Trump and 36% who say the same for Biden. At the other end of the spectrum, 45% say they are not at all likely to vote for the incumbent and 46% say the same for challenger.
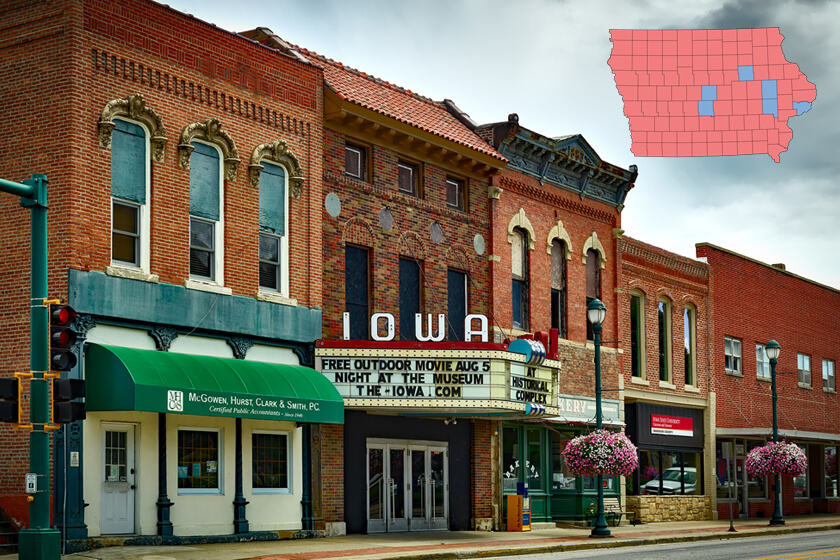
Biden has a small edge in 13 counties where the vote margins were closest in the 2016 presidential election. The Democrat currently holds a 52% to 45% lead among registered voters in these swing counties* which Hillary Clinton took by a combined one-point margin. The poll also finds that Biden racks up a large margin (62% to 31%) in three counties – including the state’s largest, Polk – that as a group went for Clinton by 17 points in 2016. Trump has a sizable lead (59% to 34%) in the counties he won by a combined 30 points four years ago.
The two major party candidates are in strong positions with their fellow partisans – Trump among Republicans (91% to 6%) and Biden among Democrats (95% to 3%). Independents are divided 47% for Trump and 41% for Biden. The poll finds a split in vote choice by education in Iowa, but it is not nearly as large as the national gap. Trump has a small advantage among white voters without a college degree (51% to 41%), while Biden has a practically imperceptible edge among white college graduates (48% to 46%).
“Iowa looks to be more competitive than four years ago. There is a lot of parity between Trump and Biden in both the strength of their support and the preferences of key demographic groups,” said Patrick Murray, director of the independent Monmouth University Polling Institute. Trump won Iowa by nine points in 2016.
The race remains tight when different likely voter models are applied. A model based on a higher level of turnout than 2016 puts the race at 48% Trump and 46% Biden while one reflecting lower turnout produces a similar 47% Trump and 47% Biden result. Republicans (36%) are somewhat more likely than Democrats (28%) to feel very optimistic about the 2020 presidential election, but a larger number of Democrats (46%) than Republicans (34%) say they are more enthusiastic about voting this year compared to past elections.
“One of the reasons Biden may do nominally better in a lower turnout scenario is that his voters are slightly more motivated. It’s not a statistically significant difference, though, and this race is currently up for grabs no matter how you slice it,” said Murray.
| IOWA: VOTER MODELS | ||||
| Presidential vote choice: | Registered voters | High likely turnout | Low likely turnout | |
| Trump | 48% | 48% | 47% | |
| Biden | 45% | 46% | 47% | |
| Jorgensen | 3% | 2% | 2% | |
| Other | <1% | <1% | <1% | |
| Undecided | 3% | 3% | 3% | |
| Source: Monmouth University Poll, July 30-Aug. 3, 2020 | ||||
Overall, 45% of Iowa voters have a favorable opinion of Trump and 50% have an unfavorable view. Biden gets a similar rating of 43% favorable and 49% unfavorable. Slightly more Iowa voters have a very unfavorable opinion of Trump (45%) than Biden (38%).
In the election for U.S. Senate, Republican incumbent Joni Ernst (48%) and Democratic challenger Theresa Greenfield (45%) are locked in a tight battle. Libertarian Rick Stewart earns 2%, independent Suzanne Herzog has 1%, and another 3% are undecided. The race remains knotted up when looking at likely voters as well, using either a high turnout (48% Ernst and 47% Greenfield) or low turnout (48% Ernst and 47% Greenfield) scenario.
“Ernst won a competitive open seat contest six years ago. Greenfield is giving the incumbent a run for her money to hold onto it,” said Murray.
The poll also finds that 40% of Iowa voters say it is very likely they will vote by mail rather than in person this November. Another 17% are somewhat likely to do this, 12% are not too likely, and 30% are not at all likely. All active voters will receive a vote-by-mail application for the 2020 general election. Just 20% report that they regularly voted by mail in past elections.
Most Democrats (61%) say they are very likely to vote by mail this year, compared to just 19% of Republicans. Just under half (43%) of independents are very likely to vote by mail. Overall, 41% of Iowa voters are very confident that their mail ballot, if they choose to vote this way, will be counted accurately (61% of Democrats, 38% of independents, and 29% of Republicans). However, 32% are very concerned that conducting the November election mainly by mail will lead to voter fraud (59% of Republicans, 27% of independents, and 7% of Democrats).
“The partisan divide on vote by mail will probably not be as stark in the fall as these poll numbers suggest. But any gap could affect the outcome if the margins remain as thin as they are right now,” said Murray.
– Covid and the return to school –
President Trump earns a split decision from Iowa voters on his handling of the coronavirus outbreak – 49% say he has done a good job and 49% a bad job. Gov. Kim Reynolds gets better reviews at 58% good job and 39% bad job. However, voters tend to disagree with the governor on some key aspects of her pandemic policy. For example, nearly 3 in 4 (73%) say that individual towns and cities should be allowed to establish face mask rules that are stricter than statewide regulations. This includes 94% of Democrats, 68% of independents, and even 59% of Reynolds’ fellow Republicans.
There is also bipartisan opposition to the governor’s directive that all Iowa schools have students spend at least half their instruction time in the classroom. Just 24% of voters agree with this requirement while 69% say individual districts should be able to decide how much in-classroom instruction schools provide. This latter view is shared by 85% of Democrats, 68% of independents, and 55% of Republicans. Partisans split, though, over whether all schools should provide at least some in-person instruction. Just over half of all voters (54%) say they should have to do this while 37% say districts should be able to provide all instruction remotely. While 76% of Republicans say that school districts should be required to provide at least some in-person instruction, just 31% of Democrats agree. Opinion of independent voters (52%) on this requirement lands between the two party extremes.
The Monmouth University Poll was conducted by telephone from July 30 to August 3, 2020 with 401 Iowa registered voters. The question results in this release have a margin of error of +/- 4.9 percentage points. The poll was conducted by the Monmouth University Polling Institute in West Long Branch, NJ.
* 2016 presidential margin by county groupings:
Swing (31% of turnout) – 13 counties where the winning margin for either candidate was less than 10 points, with a cumulative vote of 46.7% Clinton and 45.7% Trump (Black Hawk, Cerro Gordo, Clinton, Dallas, Des Moines, Dubuque, Jefferson, Linn, Marshall, Muscatine, Poweshiek, Scott, Winneshiek).
Clinton (23% of turnout) – 3 counties where Clinton won by more than 10 points, with a cumulative vote of 54.5% to 37.3% (Johnson, Polk, Story).
Trump (46% of turnout) – 83 counties where Trump won by more than 10 points, with a cumulative vote of 61.7% to 32.0%.
QUESTIONS AND RESULTS
(* Some columns may not add to 100% due to rounding.)
1.If the election for President was today, would you vote for … Donald Trump the Republican, Joe Biden the Democrat, Jo Jorgensen the Libertarian, or another candidate? [NAMES WERE ROTATED] [If UNDECIDED: If you had to vote for one of the following candidates at this moment, who do you lean toward – Donald Trump or Joe Biden?]
| REGISTERED VOTERS (with leaners) | August 2020 |
| Donald Trump | 48% |
| Joe Biden | 45% |
| Jo Jorgensen | 3% |
| Another candidate | <1% |
| (VOL) No one | <1% |
| (VOL) Undecided | 3% |
| (n) | (401) |
[1A. If Trump/Biden voter, ASK: Are you certain about your vote choice, or might you change your mind before election day?]
[QUESTIONS 2 & 3 WERE ROTATED]
2.What is the likelihood that you might vote for Donald Trump in November – very likely, somewhat likely, not too likely, or not at all likely?
| REGISTERED VOTERS | August 2020 |
| Certain for Trump (from Q1/A) | 38% |
| Very likely | 4% |
| Somewhat likely | 8% |
| Not too likely | 6% |
| Not at all likely | 45% |
| (VOL) Don’t know | 0% |
| (n) | (401) |
3.What is the likelihood that you might vote for Joe Biden in November – very likely, somewhat likely, not too likely, or not at all likely?
| REGISTERED VOTERS | August 2020 |
| Certain for Biden (from Q1/A) | 36% |
| Very likely | 3% |
| Somewhat likely | 9% |
| Not too likely | 7% |
| Not at all likely | 46% |
| (VOL) Don’t know | 0% |
| (n) | (401) |
4.If the election for U.S. Senate was today, would you vote for … Joni Ernst the Republican, Theresa Greenfield the Democrat, Rick Stewart the Libertarian, or Suzanne Herzog an independent candidate? [NAMES WERE ROTATED] [If UNDECIDED: If you had to vote for one of the following candidates at this moment, who do you lean toward – Joni Ernst or Theresa Greenfield?]
| REGISTERED VOTERS (with leaners) | August 2020 |
| Joni Ernst | 48% |
| Theresa Greenfield | 45% |
| Rick Stewart | 2% |
| Suzanne Herzog | 1% |
| (VOL) No one | 1% |
| (VOL) Undecided | 3% |
| (n) | (401) |
[Q5 held for future release.]
[QUESTIONS 6 & 7 WERE ROTATED]
6.Is your general impression of Donald Trump very favorable, somewhat favorable, somewhat unfavorable, or very unfavorable, or do you have no opinion?
| REGISTERED VOTERS | August 2020 |
| Very favorable | 26% |
| Somewhat favorable | 19% |
| Somewhat unfavorable | 5% |
| Very unfavorable | 45% |
| No opinion | 6% |
| (n) | (401) |
7.Is your general impression of Joe Biden very favorable, somewhat favorable, somewhat unfavorable, or very unfavorable, or do you have no opinion?
| REGISTERED VOTERS | August 2020 |
| Very favorable | 18% |
| Somewhat favorable | 25% |
| Somewhat unfavorable | 11% |
| Very unfavorable | 38% |
| No opinion | 8% |
| (n) | (401) |
8.Do you feel optimistic or pessimistic about the 2020 presidential election? [Is that very or somewhat optimistic/pessimistic]?
| REGISTERED VOTERS | August 2020 |
| Very optimistic | 28% |
| Somewhat optimistic | 34% |
| Somewhat pessimistic | 17% |
| Very pessimistic | 14% |
| (VOL) Neither, don’t care | 2% |
| (VOL) Don’t know | 4% |
| (n) | (401) |
9.How motivated are you to vote in the November election for president – very motivated, somewhat motivated, or not that motivated?
| REGISTERED VOTERS | August 2020 |
| Very motivated | 83% |
| Somewhat motivated | 13% |
| Not that motivated | 4% |
| (VOL) Don’t know | 0% |
| (n) | (401) |
10.Compared to past elections, are you more enthusiastic than usual, less enthusiastic, or about the same as past elections?
| REGISTERED VOTERS | August 2020 |
| More enthusiastic | 35% |
| Less enthusiastic | 15% |
| About the same | 51% |
| (VOL) Don’t know | 0% |
| (n) | (401) |
11.Looking back at recent elections, did you usually vote in person or vote by mail?
| REGISTERED VOTERS | August 2020 |
| In person | 78% |
| By mail | 19% |
| (VOL) Both equally | 1% |
| (VOL) Have not voted in recent elections | 2% |
| (VOL) Don’t know | 0% |
| (n) | (401) |
12.All active voters in Iowa will receive an application to vote by mail for the November election. How likely are you to cast your vote by mail rather than in person – very likely, somewhat likely, not too likely, or not at all likely?
| REGISTERED VOTERS | August 2020 |
| Very likely | 40% |
| Somewhat likely | 17% |
| Not too likely | 12% |
| Not at all likely | 30% |
| (VOL) Don’t know | 1% |
| (n) | (401) |
[QUESTIONS 13 & 14 WERE ROTATED]
13.If you do vote by mail, how confident are you that your vote will be counted accurately – very confident, somewhat confident, not too confident, or not at all confident?
| REGISTERED VOTERS | August 2020 |
| Very confident | 41% |
| Somewhat confident | 26% |
| Not too confident | 10% |
| Not at all confident | 21% |
| (VOL) Don’t know | 1% |
| (n) | (401) |
14.How concerned are you that conducting the November election mainly by mail will lead to voter fraud – very concerned, somewhat concerned, not too concerned, or not at all concerned?
| REGISTERED VOTERS | August 2020 |
| Very concerned | 32% |
| Somewhat concerned | 23% |
| Not too concerned | 14% |
| Not at all concerned | 31% |
| (VOL) Don’t know | 0% |
| (n) | (401) |
[QUESTIONS 15 & 16 WERE ROTATED]
15.Has Donald Trump done a good job or bad job handling the coronavirus outbreak? [Is that very or somewhat good/bad?]
| REGISTERED VOTERS | August 2020 |
| Very good | 27% |
| Somewhat good | 22% |
| Somewhat bad | 8% |
| Very bad | 41% |
| (VOL) Don’t know | 2% |
| (n) | (401) |
16.Has Governor Kim Reynolds done a good job or bad job handling the coronavirus outbreak? [Is that very or somewhat good/bad?]
| REGISTERED VOTERS | August 2020 |
| Very good | 28% |
| Somewhat good | 30% |
| Somewhat bad | 14% |
| Very bad | 25% |
| (VOL) Don’t know | 3% |
| (n) | (401) |
17.Should individual towns and cities be allowed to establish rules about wearing face masks that are stricter than the statewide rules, or should they not be allowed to do this?
| REGISTERED VOTERS | August 2020 |
| Should be allowed | 73% |
| Should not be allowed | 24% |
| (VOL) Depends | 2% |
| (VOL) Don’t know | 1% |
| (n) | (401) |
18.Should all Iowa schools be required to have students spend at least half their instruction time in the classroom or should individual districts be allowed to decide how much time is spent in the classroom?
| REGISTERED VOTERS | August 2020 |
| All Iowa schools should be required | 24% |
| Individual districts be allowed to decide | 69% |
| (VOL) Depends | 2% |
| (VOL) Don’t know | 5% |
| (n) | (401) |
19.Should individual school districts be allowed to provide all instruction remotely, or should they be required to provide at least some in classroom instruction?
| REGISTERED VOTERS | August 2020 |
| Allowed to provide all instruction remotely | 37% |
| Required to provide at least some in classroom | 54% |
| (VOL) Depends | 6% |
| (VOL) Don’t know | 3% |
| (n) | (401) |
METHODOLOGY
The Monmouth University Poll was sponsored and conducted by the Monmouth University Polling Institute from July 30 to August 3, 2020 with a statewide random sample of 401 Iowa voters drawn from a list of registered voters. This includes 176 contacted by a live interviewer on a landline telephone and 225 contacted by a live interviewer on a cell phone, in English. Monmouth is responsible for all aspects of the survey design, data weighting and analysis. The full sample is weighted for party registration, age, gender, race, education, and region based on state voter registration list information and U.S. Census information (CPS 2018 supplement). Data collection support provided by Braun Research (field) and Aristotle (voter sample). For results based on the full voter sample, one can say with 95% confidence that the error attributable to sampling has a maximum margin of plus or minus 4.9 percentage points (unadjusted for sample design). Sampling error can be larger for sub-groups (see table below). In addition to sampling error, one should bear in mind that question wording and practical difficulties in conducting surveys can introduce error or bias into the findings of opinion polls.
| DEMOGRAPHICS (weighted) |
| REGISTERED VOTERS |
| Party Registration |
| 34% Republican |
| 32% Other/none |
| 34% Democrat |
| Self-Reported Party |
| 34% Republican |
| 36% Independent |
| 30% Democrat |
| 49% Male |
| 51% Female |
| 22% 18-34 |
| 22% 35-49 |
| 26% 50-64 |
| 29% 65+ |
| 91% White, non-Hispanic |
| 9% Other |
| 68% No degree |
| 32% 4 year degree |
Click on pdf file link below for full methodology and crosstabs by key demographic groups.