West Long Branch, NJ – The campaign for governor of Virginia remains up for grabs, with Republican Ed Gillespie and Democrat Ralph Northam locked in a one point race. The Monmouth University Poll finds the race becoming more regionally divided, with Gillespie widening the gap in Western Virginia and Northam picking up steam in Northern Virginia. Northam has a better net favorable rating, but Gillespie has built issue advantages in some key areas.
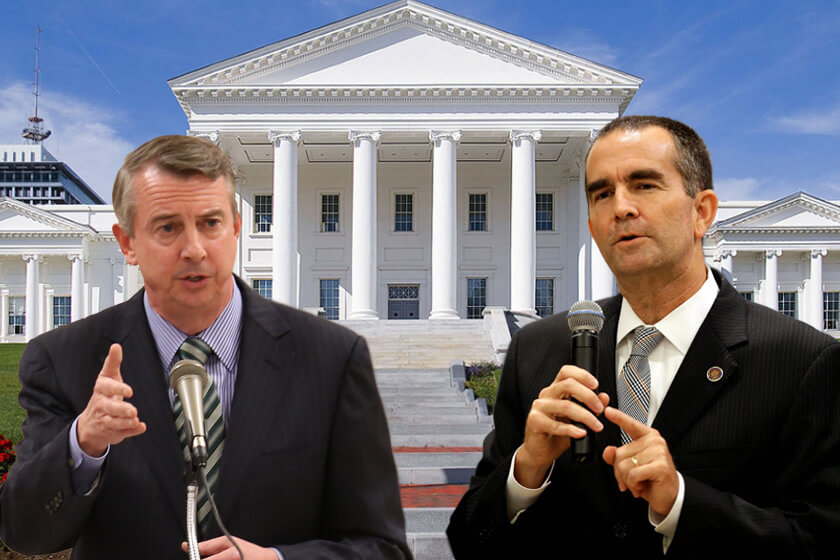
Currently, 48% of likely voters support Gillespie, the former national GOP party leader, and 47% support Northam, the Commonwealth’s current lieutenant governor. Libertarian Cliff Hyra gets 3% of the vote and 3% are undecided. Last month, Northam had a 49% to 44% edge over Gillespie while the race was tied at 44% each in July.
“This has never been more than a five point race in Monmouth’s polling, and that means either candidate has a very real shot at winning this thing. We have seen lots of little movement that has either helped or hurt each candidate but with neither one being able to break out,” said Patrick Murray, director of the independent Monmouth University Polling Institute.
Regional political differences play a significant role in Virginia election outcomes. Northam has expanded his vote share in Northern Virginia to 64% over 32% for Gillespie, compared with a 56% to 39% lead in September. Gillespie, on the other hand, has built up his lead in the conservative western part of the Commonwealth, now with a 64% to 31% lead over Northam there compared with a 50% to 43% edge last month. Eastern Virginia – Northam’s home region which backed Democrats in recent elections for governor and U.S. Senate – has become more competitive, now split at 48% for the Republican and 45% for the Democrat, whereas Northam had a 49%-40% lead in September. Central Virginia – which tends to be a swing region – remains tight at 47% for Gillespie and 44% for Northam, which is similar to September’s close margin of 49% Northam and 48% Gillespie.
“As the northern and western parts of Virginia revert to their partisan norms, the battle for swing voters will occur right down the I-95 corridor,” said Murray.
The poll found the Republican nominee has gained ground on some key campaign issues, particularly in conservative and swing areas of the state. Among all Virginia voters, Gillespie is preferred over Northam on handling jobs and the economy by a 41% to 29% margin, which is slightly better than his 38% to 33% edge on this concern in September. In particular, Gillespie now has a 43% to 24% advantage on the jobs issue in Eastern Virginia, reversing a 31% to 37% deficit there last month.
Gillespie also maintains his advantage on handling crime – 40% of Virginia voters prefer the Republican and 24% choose the Democrat. Gillespie had a 35%-27% edge on this issue in September. He has enjoyed big gains on this concern in Western Virginia, where he now holds a 55% to 13% advantage over Northam. Last month, Gillespie had a smaller 41%-26% advantage on the crime issue in this region.
“Painting Northam as soft on crime, especially with the MS-13 gang spots, appears to have been effective. This is a game of inches right now, so any small advantage counts,” said Murray.
Northam, on the other hand, continues to have the upper hand when it comes to handling health care (42% to 32%) and education (39% to 27%). Both of these gaps are slightly, but not significantly, more narrow than in September when the Democrat had a 45%-29% edge on health care and a 45%-28% edge on education. Most of this slippage comes from voters in the western part of the Commonwealth, where Gillespie is now preferred over Northam on health care (44% to 28%) and education (34% to 22%). Northam had held a slight advantage on both issues in Western Virginia just last month (40%-36% for health care and 40%-34% for education).
“In last week’s debate, Northam made a specific appeal to voters in the western part of the state on issues such as education and health care. It doesn’t appear to have worked,” said Murray.
Northam’s campaign has tried to make Donald Trump an issue in this contest, but few voters say the president is a major factor in their vote for governor. This tactic does appear to be helping the Democrat in the DC suburbs, however. Just over 4-in-10 Commonwealth voters say Trump is either a major (29%) or minor factor (14%) in their gubernatorial vote choice. This has changed very little from a Monmouth University Poll taken in July. In Northern Virginia, however, more than half (54%) say Trump is a factor in their vote, which is up from 41% who said the same three months ago. The president’s job rating among all likely voters stands at 38% approve and 55% disapprove, which is nearly identical to his 40%-55% rating last month. His rating is more negative, though, among NoVa voters at 20%-73%.
“It is difficult to tease out a specific Trump effect from all the other considerations Virginians make in deciding how to vote in this race. But it does appear that the president may be an increasing factor in places where Democrats tend to dominate, which could end up helping Northam’s turnout in the DC suburbs,” said Murray.
Northam’s campaign is also trying to portray the GOP nominee as a lobbyist who is out of touch with Virginia voters, but there doesn’t seem to be a lot of differentiation between the two candidates on this metric. Nearly half of likely voters (48%) say Gillespie understands the day to day concerns of people like them, while 39% say he does not. Similarly, 45% of voters say Northam understands the day to day concerns of people like them, while 39% say he does not.
Overall voter opinion of Gillespie is split at 41% favorable and 37% unfavorable – compared with 42%-31% last month. Overall voter opinion of Northam is more positive at 40% favorable and 27% unfavorable – compared with 45%-27% last month.
“Ralph Northam is the less disliked candidate, but he can’t shake Ed Gillespie on some key issues,” said Murray.
Northam’s vote share may also have taken a slight hit by a drop in his current boss’s approval rating. Governor Terry McAuliffe earns a 49% approve and 37% disapprove rating from voters likely to cast ballots in this year’s race. While this result is still a net positive, it is down slightly from the incumbent’s 55%-36% rating last month.
The Monmouth University Poll was conducted by telephone from October 12 to 16, 2017 with 408 Virginia residents likely to vote in the 2017 gubernatorial election. The results in this release have a margin of error of +/- 4.9 percent. The poll was conducted by the Monmouth University Polling Institute in West Long Branch, NJ.
QUESTIONS AND RESULTS
(* Some columns may not add to 100% due to rounding.)
1/2. If the election for governor was today, would you vote for Ed Gillespie the Republican, Ralph Northam the Democrat, or Cliff Hyra the Libertarian? [IF UNDECIDED: If you had to vote for one of the following at this moment, do you lean more toward Ed Gillespie or Ralph Northam?] [NAMES WERE ROTATED]
| TREND: Likely voters with leaners | Oct. 2017 | Sept. 2017 | July 2017 |
| Ed Gillespie | 48% | 44% | 44% |
| Ralph Northam | 47% | 49% | 44% |
| Cliff Hyra | 3% | 2% | 3% |
| (VOL) Other/write-in | 0% |
<1% |
<1% |
| (VOL) Undecided | 3% | 4% | 9% |
| (n) | (408) | (499) | (502) |
[QUESTIONS 3 & 4 WERE ROTATED]
3. Is your general impression of Ed Gillespie favorable or unfavorable, or do you have no opinion of him?
| TREND: | Oct. 2017 | Sept. 2017 | July 2017 |
| Favorable | 41% | 42% | 36% |
| Unfavorable | 37% | 31% | 20% |
| No opinion | 22% | 28% | 44% |
| (n) | (408) | (499) | (502) |
4. Is your general impression of Ralph Northam favorable or unfavorable, or do you have no opinion of him?
| TREND: | Oct. 2017 | Sept. 2017 | July 2017 |
| Favorable | 40% | 45% | 38% |
| Unfavorable | 27% | 27% | 16% |
| No opinion | 33% | 28% | 46% |
| (n) | (408) | (499) | (502) |
[QUESTIONS 5 & 6 WERE ROTATED]
5. Do you approve or disapprove of the job Donald Trump is doing as president?
| TREND: | Oct. 2017 | Sept. 2017 | July 2017 |
| Approve | 38% | 40% | 37% |
| Disapprove | 55% | 55% | 57% |
| (VOL) Don’t know | 6% | 6% | 6% |
| (n) | (408) | (499) | (502) |
6. Do you approve or disapprove of the job Terry McAuliffe is doing as governor?
| TREND: | Oct. 2017 | Sept. 2017 | July 2017 |
| Approve | 49% | 55% | 52% |
| Disapprove | 37% | 36% | 37% |
| (VOL) Don’t know | 13% | 9% | 11% |
| (n) | (408) | (499) | (502) |
[QUESTIONS 7 & 8 WERE ROTATED]
7. Do you think Ed Gillespie does or does not understand the day to day concerns of people like you?
| Oct. 2017 | |
| Does | 48% |
| Does not | 39% |
| (VOL) Don’t know | 13% |
| (n) | (408) |
8. Do you think Ralph Northam does or does not understand the day to day concerns of people like you?
| Oct. 2017 | |
| Does | 45% |
| Does not | 39% |
| (VOL) Don’t know | 17% |
| (n) | (408) |
9. I’m going to read you a list of issues that the next governor may have to handle. Regardless of who you will vote for, please tell me who is likely to do a good job on each issue – only Ed Gillespie, only Ralph Northam, both of them, or neither of them. [ITEMS WERE ROTATED]
Jobs and the economy
| TREND: | Oct. 2017 | Sept. 2017 |
| Only Gillespie | 41% | 38% |
| Only Northam | 29% | 33% |
| Both | 17% | 14% |
| Neither | 9% | 8% |
| (VOL) Don’t know | 4% | 7% |
| (n) | (408) | (499) |
Education
| TREND: | Oct. 2017 | Sept. 2017 |
| Only Gillespie | 27% | 28% |
| Only Northam | 39% | 45% |
| Both | 16% | 11% |
| Neither | 11% | 8% |
| (VOL) Don’t know | 7% | 8% |
| (n) | (408) | (499) |
Health care
| TREND: | Oct. 2017 | Sept. 2017 |
| Only Gillespie | 32% | 29% |
| Only Northam | 42% | 45% |
| Both | 6% | 7% |
| Neither | 13% | 12% |
| (VOL) Don’t know | 6% | 8% |
| (n) | (408) | (499) |
Crime
| TREND: | Oct. 2017 | Sept. 2017 |
| Only Gillespie | 40% | 35% |
| Only Northam | 24% | 27% |
| Both | 20% | 19% |
| Neither | 10% | 10% |
| (VOL) Don’t know | 6% | 10% |
| (n) | (408) | (499) |
10. Is Donald Trump a major factor, minor factor, or not a factor in deciding how you will vote for governor?
| TREND: | Oc. 2017 | July 2017 |
| Major factor | 29% | 26% |
| Minor factor | 14% | 14% |
| Not a factor | 57% | 59% |
| (VOL) Don’t know | 0% | 1% |
| (n) | (408) | (502) |
METHODOLOGY
The Monmouth University Poll was sponsored and conducted by the Monmouth University Polling Institute from October 12 to 16, 2017 with a statewide random sample of 408 likely Virginia voters drawn from a list of registered voters who voted in at least two of the last four general elections or have registered to vote since January 2016, and indicate they are likely to vote in the upcoming election. This includes 225 contacted by a live interviewer on a landline telephone and 183 contacted by a live interviewer on a cell phone. Monmouth is responsible for all aspects of the survey design, data weighting and analysis. Final sample is weighted for region, party primary voting history, age, gender, and race based on state voter registration list and U.S. Census information. Data collection support provided by Braun Research (field) and Aristotle (voter sample). For results based on this sample, one can say with 95% confidence that the error attributable to sampling has a maximum margin of plus or minus 4.9 percentage points (unadjusted for sample design). Sampling error can be larger for sub-groups (see table below). In addition to sampling error, one should bear in mind that question wording and practical difficulties in conducting surveys can introduce error or bias into the findings of opinion polls.
VA Regions:
NoVa – Loudon, Fairfax, Arlington, and Prince William counties and included cities.
East – counties and cities along the Chesapeake Bay and tributary rivers (James, York, Rappahannock), including Hampton Roads, Virginia Beach, Newport News and Norfolk.
Central – Counties and cities that straddle either side of I-95, including Richmond.
West –the area west of a north-south line from Clarke/Fauquier to Mecklenburg counties.
| DEMOGRAPHICS (weighted) |
|
Primary Voting History |
| 49% Republican |
| 37% Democrat |
| 15% Neither |
|
Self-Reported Party ID |
| 30% Republican |
| 43% Independent |
| 28% Democrat |
|
|
| 47% Male |
| 53% Female |
| 11% 18-34 |
| 24% 35-49 |
| 32% 50-64 |
| 32% 65+ |
| 77% White |
| 16% Black |
|
3% Hispanic |
|
4% Asian/Other |
Click on pdf file link below for full methodology and results by key demographic groups.