West Long Branch, NJ – Democrat Jennifer Wexton continues to lead Republican Barbara Comstock in the race for Virginia’s 10th Congressional District, according to the Monmouth University Poll. The GOP incumbent’s favorable ratings have improved since the summer, but the challenger holds the advantage on key issues and is bolstered by the fact that Pres. Donald Trump remains unpopular in the district. The poll also finds that controversy surrounding the current Supreme Court nomination is not having an appreciable impact on this House contest.
Wexton holds a 50% to 44% lead over Comstock among likely voters using Monmouth’s standard midterm turnout model. Wexton extends her advantage to 52%-43% using a model that incorporates a turnout surge in Democratic precincts similar to the pattern seen in last year’s gubernatorial contest. A low turnout model shows Wexton with a smaller 50% to 46% edge. In June, Wexton held a 50% to 41% lead in the standard turnout model, a 51% to 40% lead in the surge model, and a 51% to 42% lead in the low turnout model. In the current poll, only the lead in the Dem surge model is statistically significant; the leads in the standard midterm and low turnout models are within the margin of error.
The Republican has made gains among female voters, but the Democrat has also made some inroads among male voters. Wexton leads among women by a smaller margin now (57%-39%) than she did in June (65%-26%). Similarly, Comstock leads among men by a smaller margin now (50%-43%) than she did in June (56%-36%).
Wexton leads among white voters who hold a college degree by 54% to 43%, which is a slight improvement over the 51%-42% edge she had with this group in June. Comstock has countered this by increasing her advantage among white voters without a college degree from a 55%-38% lead in June to a 60%-39% lead in the current poll. Wexton’s support among non-white voters has dropped slightly, from 67%-22% in June to 61%-27% currently.
“Wexton maintains a lead, but the gap has narrowed slightly since the summer. Favorable opinions of Comstock have increased in that time, while the challenger has been met with a mixed response as voters have gotten to know her better,” said Patrick Murray, director of the independent Monmouth University Polling Institute.
Likely voters are divided on their opinion of Comstock – 42% have a favorable view and 45% have an unfavorable view of her, with 13% expressing no opinion. This is an improvement from the 34% favorable and 43% unfavorable rating the incumbent received in June. VA-10 voters are more positive about the challenger, giving Wexton a 42% favorable and 31% unfavorable rating, with 27% having no opinion. The challenger’s favorable rating has increased by 6 points from 36% in June, but her unfavorable rating has climbed even more – up 19 points from 12% over the summer.
The race between two women candidates is occurring in the shadow of the nation’s capital, but the poll finds that recent news about sexual assault allegations against Supreme Court nominee Brett Kavanaugh is not having much of an impact. Fully 8-in-10 likely VA-10 voters (81%) say that recent developments have not caused them to change their vote. Among the remainder, 5% say the Kavanaugh issue has made them more likely to support Wexton, 5% say it has made them more likely to support Comstock, and 3% say it has made them more undecided. Wexton may be picking up slightly more support than Comstock among the few remaining undecided voters due to the Kavanaugh issue, but these findings are inconclusive because of the small undecided sample in the poll.
When asked to choose their top issue in this House race from a list of six included in the poll, health care (24%) and immigration (22%) emerge as the top picks, followed by gun control (13%), tax policy (13%), job creation (11%), and abortion (8%). When asked who they trust more to handle some of these policies, Wexton has a significant advantage on keeping health care affordable (45% to 32% for Comstock) and abortion (44% to 31%). The Democrat also has a slight edge on handling gun control (43% to 38%). Voters are more evenly divided on who they trust to support policies that will keep their families safe – 41% choose Wexton and 39% choose Comstock.
“The two candidates have really focused their messaging on family concerns. Reaction has been mixed, but Wexton tends to come out ahead on some key issues, such as health care. Just as importantly, though, the Republican is being dragged down by a president who is not all that popular in this district,” said Murray.
Currently, 43% of VA-10 voters approve and 53% disapprove of the job Trump is doing as president. This has not changed much from the 46% approve and 52% disapprove rating he received in June. Just over 4-in-10 (43%) voters say that Comstock has been too supportive of Trump, which is basically unchanged from 45% who said the same in June. Another 16% say she has not been supportive enough (down from 23%) and 28% say she has offered the right amount of support (up from 18%).
Nearly 3-in-4 (73%) voters say it is very important for them to cast a vote in the VA-10 House race that shows their feelings about the president. This includes 82% of Trump opponents and 74% of Trump supporters. In June, 67% said that it was very important to cast a presidential proxy vote in the House contest, with a wider gap between Trump opponents (77%) and supporters (61%) who felt that way.
“These results suggest that the Republican base has been able to narrow the enthusiasm gap Democrats enjoyed over the summer. The problem in this particular contest, though, is that they have not closed it,” said Murray.
Currently, 82% of likely VA-10 voters say that have a lot of interest in the upcoming House election, which is up from 72% in June. This includes a 17 point increase in interest among Republicans (81%, up from 64%), a 10 point increase among Democrats (87%, up from 77%), and a 6 point increase among independents (79%, up from 73%). Despite the increase in GOP interest, voters in VA-10 still narrowly prefer having the Democrats in control of Congress (45%) rather than the Republicans (40%). This sentiment is virtually unchanged from June (43% Democratic control and 38% Republican control).
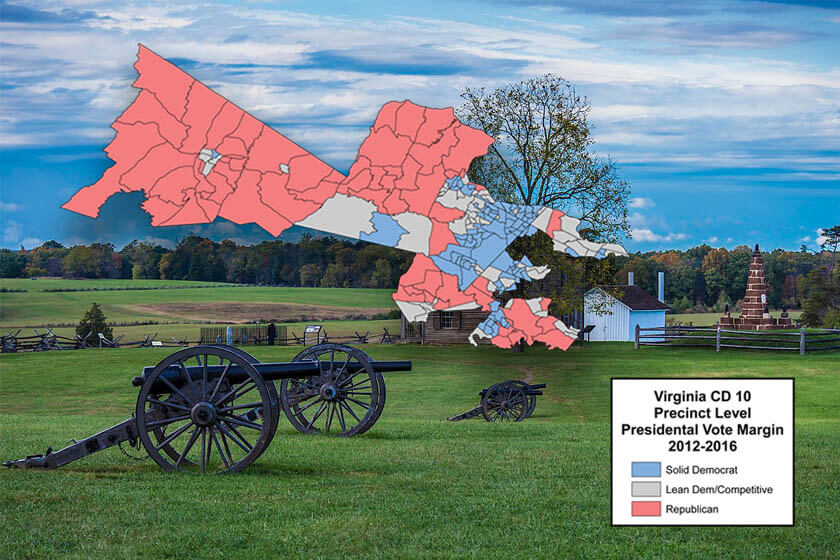
Comstock was first elected to the seat by a 16 point margin in 2014. That was cut to 6 points in 2016 when Hillary Clinton won the district by 10 points – a swing of 11 points toward the Democrat compared with the 2012 presidential margin when Mitt Romney won the district by a single point.
The Monmouth University Poll was conducted by telephone from September 26 to 30, 2018 with 374 likely voters in Virginia’s 10th Congressional District. The question results in this release have a margin of error of +/- 5.1 percentage points. The error of the difference between the two candidates’ vote share (i.e. the “lead”) is +/-7.2 percentage points. The poll was conducted by the Monmouth University Polling Institute in West Long Branch, NJ.
QUESTIONS AND RESULTS
(* Some columns may not add to 100% due to rounding.)
1/2. If the election for U.S. House of Representatives in your district was today, would you vote for Barbara Comstock the Republican or Jennifer Wexton the Democrat? [IF UNDECIDED: If you had to vote for one of the following at this moment, do you lean more toward Barbara Comstock or more toward Jennifer Wexton?] [NAMES WERE ROTATED]
| Likely Voters with leaners | Sept. 2018 | June 2018 | ||||
| Standard | Democratic | Low Turnout | Standard | Democratic | Low | |
| Barbara Comstock | 44% | 43% | 46% | 41% | 40% | 42% |
| Jennifer Wexton | 50% | 52% | 50% | 50% | 51% | 51% |
| Other |
<1% |
<1% |
<1% | 3% | 3% | 3% |
| (VOL) Undecided | 5% | 6% | 4% | 6% | 7% | 4% |
| (n) | (374) | (374) | (374) | (338) | (338) | (338) |
[QUESTIONS 3 & 4 WERE ROTATED]
3. Is your general impression of Barbara Comstock favorable or unfavorable, or do you have no opinion of her?
| Likely Voter Standard | Sept. 2018 | June 2018 |
| Favorable | 42% | 34% |
| Unfavorable | 45% | 43% |
| No opinion | 13% | 23% |
| (n) | (374) | (338) |
4. Is your general impression of Jennifer Wexton favorable or unfavorable, or do you have no opinion of her?
| Likely Voter Standard | Sept. 2018 | June 2018 |
| Favorable | 42% | 36% |
| Unfavorable | 31% | 12% |
| No opinion | 27% | 52% |
| (n) | (374) | (338) |
5. How much interest do you have in the upcoming election for House of Representatives – a lot of interest, a little interest, or not much interest at all?
| Likely Voter Standard | Sept. 2018 | June 2018 |
| A lot | 82% | 72% |
| A little | 16% | 20% |
| Not much at all | 2% | 8% |
| (VOL) Don’t know | 0% | 0% |
| (n) | (374) | (338) |
6. Have you been following the campaign in your congressional district very closely, somewhat closely, or not too closely?
| Likely Voter Standard | Sept. 2018 | June 2018 |
| Very closely | 30% | 22% |
| Somewhat closely | 50% | 46% |
| Not too closely | 20% | 32% |
| (VOL) Don’t know | 0% | 0% |
| (n) | (374) | (338) |
7. Do you approve or disapprove of the job Donald Trump is doing as president? [Do you (approve/disapprove) strongly or somewhat?]
| Likely Voter Standard | Sept. 2018 | June 2018 |
| Strongly approve | 33% | 28% |
| Somewhat approve | 10% | 18% |
| Somewhat disapprove | 6% | 5% |
| Strongly disapprove | 47% | 47% |
| (VOL) Don’t know | 4% | 2% |
| (n) | (374) | (338) |
8. On most issues would you say you support or oppose what President Trump is doing?
| Likely Voter Standard | Sept. 2018 | June 2018 |
| Support | 44% | 44% |
| Oppose | 50% | 52% |
| (VOL) Depends/both | 3% | 3% |
| (VOL) Don’t know | 4% | 1% |
| (n) | (374) | (338) |
9. How important is it for you to cast a vote for Congress that shows your [support of/opposition to] President Trump – very important, somewhat important, not too important, or not at all important?
| Likely Voter Standard | Sept. 2018 | June 2018 |
| Very important | 73% | 67% |
| Somewhat important | 12% | 16% |
| Not too important | 3% | 6% |
| Not at all important | 3% | 6% |
| (VOL) Don’t know | 8% | 4% |
| (n) | (374) | (338) |
10. Would you rather see the Republicans or the Democrats in control of Congress, or doesn’t this matter to you?
| Likely Voter Standard | Sept. 2018 | June 2018 |
| Republicans | 40% | 38% |
| Democrats | 45% | 43% |
| Does not matter | 13% | 17% |
| (VOL) Don’t know | 2% | 1% |
| (n) | (374) | (338) |
11. Has Barbara Comstock been too supportive of Donald Trump, not supportive enough, or has she given the right amount of support to Trump?
| Likely Voter Standard | Sept. 2018 | June 2018 |
| Too supportive | 43% | 45% |
| Not supportive enough | 16% | 23% |
| Right amount of support | 28% | 18% |
| (VOL) Don’t know | 13% | 14% |
| (n) | (374) | (338) |
12. Please tell me which one of the following policy issues is most important to you in your vote choice for Congress? [ITEMS WERE ROTATED]
| Likely Voter Standard | Sept. 2018 |
| Immigration policy | 22% |
| Health care policy | 24% |
| Gun control policy | 13% |
| Abortion policy | 8% |
| Tax policy | 13% |
| Job creation policy | 11% |
| (VOL) Other | 5% |
| (VOL) Don’t know | 3% |
| (n) | (374) |
13. Who do you trust more to support policies that will keep your family safe – Barbara Comstock or Jennifer Wexton, or do you trust both equally? [NAMES WERE ROTATED]
| Likely Voter Standard | Sept. 2018 |
| Barbara Comstock | 39% |
| Jennifer Wexton | 41% |
| Both equally | 13% |
| (VOL) Neither one | 4% |
| (VOL) Don’t know | 4% |
| (n) | (374) |
[QUESTIONS 14, 15 & 16 WERE ROTATED]
14. Who do you trust more to work to keep health care affordable – Barbara Comstock or Jennifer Wexton, or do you trust both equally? [NAMES WERE ROTATED]
| Likely Voter Standard | Sept. 2018 |
| Barbara Comstock | 32% |
| Jennifer Wexton | 45% |
| Both equally | 11% |
| (VOL) Neither one | 6% |
| (VOL) Don’t know | 6% |
| (n) | (374) |
15. Who do you trust more to handle the issue of gun control – Barbara Comstock or Jennifer Wexton, or do you trust both equally? [NAMES WERE ROTATED]
| Likely Voter Standard | Sept. 2018 |
| Barbara Comstock | 38% |
| Jennifer Wexton | 43% |
| Both equally | 10% |
| (VOL) Neither one | 3% |
| (VOL) Don’t know | 6% |
| (n) | (374) |
16. Who do you trust more to handle the issue of abortion – Barbara Comstock or Jennifer Wexton, or do you trust both equally? [NAMES WERE ROTATED]
| Likely Voter Standard | Sept. 2018 |
| Barbara Comstock | 31% |
| Jennifer Wexton | 44% |
| Both equally | 13% |
| (VOL) Neither one | 5% |
| (VOL) Don’t know | 7% |
| (n) | (374) |
[NOTE: QUESTION 17 WAS ASKED 9/27 TO 9/30; n=301, m.o.e=+/-5.7%]
17. There have been recent hearings and other news about sexual assault allegations against Supreme Court nominee Brett Kavanaugh. Has anything you heard in the last week caused you to change your mind about who you will support in the election for House of Representatives, or hasn’t it changed your mind? [If “YES”: Has this made you more likely to support Comstock, more likely to support Wexton or has it made you more undecided?]
| Likely Voter Standard | Sept. 2018 |
| Yes, more likely to support Comstock | 5% |
| Yes, more likely to support Wexton | 5% |
| Yes, more undecided | 3% |
| No, has not changed my mind | 81% |
| (VOL) Not aware of allegations/news | 2% |
| (VOL) Don’t know | 3% |
| (n) | (301) |
METHODOLOGY
The Monmouth University Poll was sponsored and conducted by the Monmouth University Polling Institute from September 26 to 30, 2018 with a random sample of 374 likely voters in Virginia’s 10th Congressional District, drawn from a list of registered voters who voted in at least one of the last four general or primary elections or have registered to vote since January 2016. This includes 203 contacted by a live interviewer on a landline telephone and 171 contacted by a live interviewer on a cell phone in English. Monmouth is responsible for all aspects of the survey design, data weighting and analysis. Final sample is weighted for region, party primary voting history, age, gender, education and race based on state voter registration list and U.S. Census information. Data collection support provided by Braun Research (field) and L2 (voter sample). For results based on this sample, one can say with 95% confidence that the error attributable to sampling has a maximum margin of plus or minus 5.1 percentage points (unadjusted for sample design). Sampling error can be larger for sub-groups (see table below). In addition to sampling error, one should bear in mind that question wording and practical difficulties in conducting surveys can introduce error or bias into the findings of opinion polls.
| DEMOGRAPHICS (weighted) |
|
Party primary history |
| 46% Republican |
| 45% Democrat |
|
9% Neither |
|
Self-Reported Party ID |
| 28% Republican |
| 44% Independent |
| 28% Democrat |
| 48% Male |
| 52% Female |
| 12% 18-34 |
| 27% 35-49 |
| 34% 50-64 |
| 27% 65+ |
| 76% White, non-Hispanic |
| 24% Other |
| 36% No college degree |
| 64% 4-year college degree |
| 17% Clarke/Frederick/Winchester Counties |
| 41% Loudoun County |
| 30% Fairfax County |
| 13% Prince William/Manassas/Manassas Park |
Click on pdf file link below for full methodology and results by key demographic groups.