West Long Branch, NJ – The race for Virginia’s 10th Congressional District starts out with the GOP Republican incumbent trailing by ten points according to the Monmouth University Poll. Pres. Donald Trump and the overall Republican brand hamper Rep. Barbara Comstock’s chances to retain her seat against her lesser-known Democratic challenger, state legislator Jennifer Wexton.
Wexton holds a 49% to 39% lead over Comstock among all potential voters – that is voters who have participated in an election since 2010 or have newly registered to vote (a group that represents about 86% of all registered voters in the district). The race does not look significantly different using two different likely voter models. A historical midterm model gives Wexton a 50% to 41% lead, while a model that includes a turnout surge in areas where Pres. Donald Trump is unpopular gives Wexton a 51% to 40% lead.
Half the voters in this district identify themselves as independents, and Wexton leads among this group by 45% to 36%. She also has stronger support among her fellow Democrats (97% to 1% for Comstock) than Comstock has among her fellow Republicans (85% to 10% for Wexton).
Like most Republican candidates across the country, the incumbent can count on solid support from white voters who have not graduated college – a group she leads by 50% to 38%. The problem for Comstock, though, is that 6-in-10 voters in VA-10 actually hold a college degree – which is higher than the national average. Wexton leads among white college graduates by 50% to 41%. She also leads among black, Hispanic, and Asian voters regardless of education level by 62% to 21%.
“This part of the commonwealth was a critical factor in the blue wave that elected Democrats in last year’s election for governor and state legislature. Not much has changed in the political environment since then, with Pres. Trump creating a significant drag for Comstock,” said Patrick Murray, director of the independent Monmouth University Polling Institute.
The incumbent’s reelection prospects are weighted down by voters’ negative views of Pres. Trump – 53% disapprove of the job he has done compared to 42% who approve. Importantly, those who strongly disapprove (47%) far outnumber those who strongly approve (24%). Also, 70% of those who oppose the president’s actions say it is very important for them to cast a vote in the House race that shows their feelings about the president. A smaller number of those who support the president (58%) say the same about their House vote. More VA-10 voters say Comstock has been too supportive of Trump (34%) than say she has either been not supportive enough (17%) or has offered the right amount of support (23%). Another 26% are not sure.
Voters also express a slight preference to have Democrats (42%) rather than Republicans (34%) in control of Congress, with 22% saying party control does not matter to them. Overall, VA-10 voters are relatively more positive about the Democratic Party (34% favorable and 38% unfavorable) than they are about the Republican Party (26% favorable and 46% unfavorable).
“Comstock may focus on her constituent service record to offset the negative feelings about both Trump and the GOP brand. But this tactic would not appear to give her any advantage against the challenger,” said Murray.
Voters are divided on their opinion of Comstock – 32% have a favorable view and 36% have an unfavorable view of the incumbent, with 32% having no opinion. When they put aside issue stands, nearly half of the electorate (46%) says the two-term congresswoman has generally done a good job serving the needs of her constituents, while 30% say she has done a bad job. The challenger Wexton is not as well known – 30% have a favorable view of her and 10% have an unfavorable view, with 59% offering no opinion – but voters are inclined to think that she can capably serve the 10th district’s residents – 48% say she would do a good job and 17% say a bad job.
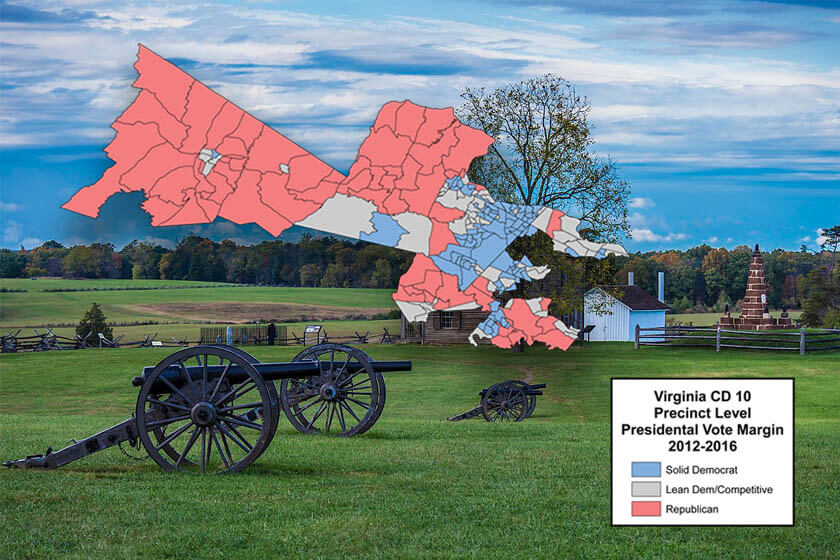
Comstock was first elected to the seat by a 16 point margin in 2014. That was cut to a 6 point margin in 2016 when Hillary Clinton won the district by 10 points – a swing of 11 points toward the Democrat compared with the 2012 presidential margin when Mitt Romney won the district by a single point.
While Trump did worse than Romney across the entire district, he actually over-performed in the western portion comprised of deep-red Frederick and Clarke counties and the more competitive enclave of Winchester City. But even here Comstock does not have a significant lead – only 44% to 42% for Wexton. In the Fairfax County portion of the district – the area that saw the largest swing (20 points) away from the GOP in 2016’s presidential vote – Wexton holds a very sizable 56% to 37% advantage. The largest chunk of the district is in Loudoun County, where Wexton leads by 48% to 39%. The Democrat also has a 46% to 37% edge in the southeastern part of the district which includes GOP-leaning Prince William County and the Democratic strongholds of Manassas and Manassas Park.
The Monmouth University Poll was conducted by telephone from June 21 to 24, 2018 with 400 Virginia voters in Virginia’s 10th Congressional District November general election. The question results in this release have a margin of error of +/- 4.9 percentage points for the full sample and +/- 5.3 percentage points for the likely voter models. The error of the gap between the two candidates’ vote share (i.e. the margin of the “lead”) is +/- 6.9 percentage points for the full sample and +/- 7.5 percentage points for the likely voter models. The poll was conducted by the Monmouth University Polling Institute in West Long Branch, NJ.
QUESTIONS AND RESULTS
(* Some columns may not add to 100% due to rounding.)
1/2. If the election for U.S. House of Representatives in your district was today, would you vote for Barbara Comstock the Republican or Jennifer Wexton the Democrat, or some other candidate? [IF UNDECIDED: If you had to vote for one of the following at this moment, do you lean more toward Barbara Comstock or more toward Jennifer Wexton?] [NAMES WERE ROTATED]
| With leaners | June 2018 | ||
Likely Voter Models | |||
Full voter | Standard | Democratic | |
| Barbara Comstock | 39% | 41% | 40% |
| Jennifer Wexton | 49% | 50% | 51% |
| Other | 2% | 3% | 3% |
| (VOL) Undecided | 10% | 6% | 7% |
| (n) | (400) | (338) | (338) |
[QUESTIONS 3 & 4 WERE ROTATED]
3. Is your general impression of Barbara Comstock favorable or unfavorable, or do you have no opinion of her?
| June 2018 | |
| Favorable | 32% |
| Unfavorable | 36% |
| No opinion | 32% |
| (n) | (400) |
4. Is your general impression of Jennifer Wexton favorable or unfavorable, or do you have no opinion of her?
| June 2018 | |
| Favorable | 30% |
| Unfavorable | 10% |
| No opinion | 59% |
| (n) | (400) |
5. How much interest do you have in the upcoming election for House of Representatives – a lot of interest, a little interest, or not much interest at all?
| June 2018 | |
| A lot | 62% |
| A little | 26% |
| Not much at all | 11% |
| (VOL) Don’t Know | 0% |
| (n) | (400) |
6. Have you been following the campaign in your congressional district very closely, somewhat closely, or not too closely?
| June 2018 | |
| Very closely | 18% |
| Somewhat closely | 40% |
| Not too closely | 42% |
| (VOL) Don’t know | 0% |
| (n) | (400) |
7. Do you approve or disapprove of the job Donald Trump is doing as president? [Do you (approve/disapprove) strongly or somewhat?]
| June 2018 | |
| Strongly approve | 24% |
| Somewhat approve | 18% |
| Somewhat disapprove | 6% |
| Strongly disapprove | 47% |
| (VOL) Don’t know | 4% |
| (n) | (400) |
8. On most issues would you say you support or oppose what President Trump is doing?
| June 2018 | |
| Support | 39% |
| Oppose | 52% |
| (VOL) Depends/both | 5% |
| (VOL) Don’t know | 3% |
| (n) | (400) |
9. How important is it for you to cast a vote for Congress that shows your [support of/opposition to] President Trump – very important, somewhat important, not too important, or not at all important?
| June 2018 | |
| Very important | 60% |
| Somewhat important | 19% |
| Not too important | 6% |
| Not at all important | 6% |
| (VOL) Don’t know | 9% |
| (n) | (400) |
10. Has Barbara Comstock been too supportive of Donald Trump, not supportive enough, or has she given the right amount of support to Trump?
| June 2018 | |
| Too supportive | 34% |
| Not supportive enough | 17% |
| Right amount of support | 23% |
| (VOL) Don’t know | 26% |
| (n) | (400) |
[QUESTIONS 11 & 12 WERE ROTATED]
11. Is your general impression of the Republican Party favorable or unfavorable, or do you have no opinion?
| June 2018 | |
| Favorable | 26% |
| Unfavorable | 46% |
| No opinion | 28% |
| (n) | (400) |
12. Is your general impression of the Democratic Party favorable or unfavorable, or do you have no opinion?
| June 2018 | |
| Favorable | 34% |
| Unfavorable | 38% |
| No opinion | 28% |
| (n) | (400) |
13. Would you rather see the Republicans or the Democrats in control of Congress, or doesn’t this matter to you?
| June 2018 | |
| Republicans | 34% |
| Democrats | 42% |
| Does not matter | 22% |
| (VOL) Don’t know | 3% |
| (n) | (400) |
[QUESTIONS 14 & 15 WERE ROTATED]
14. Even if you don’t agree with her on every issue, do you think Barbara Comstock has generally done a good job or bad job serving the needs of constituents in this congressional district?
| June 2018 | |
| Good job | 46% |
| Bad job | 30% |
| (VOL) Depends | 6% |
| (VOL) Don’t know | 18% |
| (n) | (400) |
15. Even if you don’t agree with her on every issue, do you think Jennifer Wexton would generally do a good job or bad job serving the needs of constituents in this congressional district?
| June 2018 | |
| Good job | 48% |
| Bad job | 17% |
| (VOL) Depends | 2% |
| (VOL) Don’t know | 33% |
| (n) | (400) |
METHODOLOGY
The Monmouth University Poll was sponsored and conducted by the Monmouth University Polling Institute from June 21 to June 24, 2018 with a random sample of 400 potential voters in Virginia’s 10th Congressional District, drawn from a list of registered voters who voted in at least one of the last four general or primary elections or have registered to vote since January 2016. This includes 200 contacted by a live interviewer on a landline telephone and 200 contacted by a live interviewer on a cell phone. Monmouth is responsible for all aspects of the survey design, data weighting and analysis. Final sample is weighted for region, party primary voting history, age, gender, and race based on state voter registration list and U.S. Census information. Data collection support provided by Braun Research (field) and L2 (voter sample). For results based on this sample, one can say with 95% confidence that the error attributable to sampling has a maximum margin of plus or minus 4.9 percentage points (unadjusted for sample design). Sampling error can be larger for sub-groups (see table below). In addition to sampling error, one should bear in mind that question wording and practical difficulties in conducting surveys can introduce error or bias into the findings of opinion polls.
| DEMOGRAPHICS (weighted) |
Party Primary History |
| 42% Republican |
| 45% Democrat |
| 13% Neither |
Self-Reported Party ID |
| 25% Republican |
| 50% Independent |
| 25% Democrat |
| 50% Male |
| 50% Female |
| 15% 18-34 |
| 29% 35-49 |
| 37% 50-64 |
| 19% 65+ |
| 74% White, non-Hispanic |
| 26% Other |
| 40% No college degree |
| 60% 4-year college degree |
| 16% Clarke/ Frederick/ Winchester Counties |
| 28% Fairfax County |
| 43% Loudoun County |
| 13% Prince William/ Manassas/ Manassas Park Counties |
Click on pdf file link below for full methodology and results by key demographic groups.