
West Long Branch, NJ – Most Americans say President Joe Biden’s policies are benefiting the rich, poor, and middle class alike, although few say he is providing a lot of help to any of these groups. The latest Monmouth (“Mon-muth”) University Poll finds that Covid has declined as a top-of-mind worry for American families, with many focusing more on specific financial concerns. The public is somewhat divided on whether the federal government will help or hurt them in the coming years, although clear majorities continue to support the president’s big spending plans.
Monmouth periodically asks poll participants to name the biggest concern facing their own family right now. The pandemic dominated responses to this question in polls taken last year – 57% named coronavirus or Covid as their family’s top concern in March 2020 and 39% said the same in August. However, those naming the pandemic as their most pressing worry has now dropped to 17% of the public. Democrats (29%) are more likely than Republicans (13%) and independents (10%) to name this as their top concern, but the differences among other demographic categories (such as age, race, or income) are not sizable.
Other top family concerns named in the poll span a range of issues, including everyday bills (11%), the economy (11%), health care costs (7%), job security (7%), and inflation (5%). When concerns about financial expenses (such as bills, health care, school, housing, retirement savings, and inflation) are combined, independents (36%) are more likely than either Republicans (25%) or Democrats (22%) to name one of these issues as their top concern. However, Republicans and independents are more likely than Democrats to name everyday bills or inflation as their top concern, while Democrats and independents are more likely than Republicans to name health care or housing expenses as their top concern.
“As of the time the poll was taken, America had been turning its focus away from the pandemic as an overriding factor in American life. Specific bread-and-butter issues are now reemerging as top concerns, which means the public’s attention would be on more individualized policy areas. Of course, this appears to be the point of proposing mega-sized spending plans,” said Patrick Murray, director of the independent Monmouth University Polling Institute.
Among poll participants who name a top concern, 31% say the actions of the federal government over the past six months have helped them with this issue, 34% say the federal government has hurt them, and 31% say it has had no impact on this concern. These numbers are better than a poll taken midway through former President Donald Trump’s term when 18% (April 2019) said the federal government had helped them over the prior year, but they are similar to a January 2017 poll when 27% said they were helped by the federal government in the prior few years (during former President Barack Obama’s administration).
Looking to the future, 40% expect the federal government will act to help them with their top concern, 34% expect they will be hurt by federal actions, and 18% expect to see no impact. Interestingly, these results are similar to expectations four years ago under incoming President Trump – 42% expected that the federal government would help their top concern and 33% said they would be hurt. The similarity in the top-line comparison, though, masks a sizable partisan swing. In 2017, 74% of Republicans expected that the new administration would help with their top concern while 61% of Democrats said they would be hurt. Today, 71% of Democrats expect federal actions will help their top concern and 60% of Republicans expect to be hurt.
“Partisanship remains the driving factor in judging how Washington is doing. Biden continues to bank on large spending plans to try to chip away at that dynamic,” said Murray.
The president’s large spending plans remain broadly popular, including the Covid stimulus plan passed early in his term (62% support), his proposed infrastructure package (70%), and his proposal to expand access to health care, college, paid leave and other services (63%). The current results are nearly identical to prior polls taken this year. Support for the three plans ranges from 94% to 96% among Democrats, from 55% to 64% among independents, and from 31% to 42% among Republicans.

Just over 4 in 10 (42%) Americans say these proposed plans should be passed as is, even if they do not get bipartisan support. This position is held by 71% of Democrats, but by only 35% of independents and 14% of Republicans. Another 27% of Americans say the plans should be significantly cut to get backing from both parties and 23% say they should not be passed at all even with bipartisan support. About 4 in 10 Republicans (39%) and 3 in 10 independents (31%) say the plans should not be passed at all. Just 2% of Democrats agree. These findings are very similar to the results for this question in Monmouth’s June poll.
An attempt to start debate on a smaller bipartisan infrastructure bill failed a procedural vote in the Senate last week. The public is divided on whether the Republicans (26%), the Democrats (18%), or both parties equally (25%) are responsible for this failure. Another 30% are not sure.
In terms of the overall impact of Biden’s first six months in office, about 1 in 5 (21%) Americans say middle-class families have benefited from the president’s policies a lot and another 41% say they have benefited a little, while 33% say the middle class have not benefited at all. The combined result for a lot and a little has increased from 51% in June to 62% now – as the number of people who say they do not know about the impact of Biden’s policies on the middle class has declined (from 14% to 5%).
The current results for this question are not much different than during most of Trump’s term. Midway into the last presidency, 18% said Trump’s policies benefited the middle class a lot, 37% a little, and 36% not at all (April 2019). Trump started out with much less favorable marks on this metric (11% a lot, 25% a little, and 53% not at all in December 2017), but he ended his term with somewhat more positive ratings (32% a lot, 33% a little, and 32% not at all in January 2021).
Biden gets better marks for how much his policies have helped poor families – 31% of the public says this group has benefited a lot, 35% a little, and 29% not at all. These results are significantly better than for his predecessor. In April 2019, 14% said a lot, 26% said a little, and 51% said not at all about poor families benefiting from Trump’s policies.
Turning to wealthy families, 22% say this group has benefited a lot, 30% a little, and 35% not at all from Biden’s policies. Trump scored much better on helping the wealthy – 58% said the rich benefited a lot, 22% a little, and 9% not at all from Trump’s policies in 2019.
“While Biden has not achieved stellar reviews for helping any one economic tier in the American public, his ratings are more evenly dispersed. There doesn’t seem to be a sense he is favoring one group over another,” said Murray.
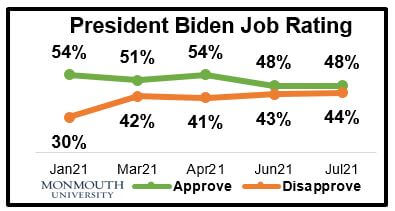
Biden currently holds a job performance rating of 48% approve and 44% disapprove. This is similar to his 48%–43% rating in June and down from his 54%–41% rating in April. The president gets a positive rating from 93% of Democrats, 36% of independents, and 10% of Republicans. Prior approval levels for the incumbent registered 51% in March and 54% in January.
The poll also finds the public’s job rating for Congress stands at 23% approve and 62% disapprove. Congressional approval had been hovering between 30% and 35% at the beginning of the year, but dropped to 21% in June. The current reading is in line with Monmouth polls through most of the Trump years, when approval ranged between 16% and 25% except for two 32% marks in the early months of the pandemic last year. The percentage of Americans who say the country is headed in the right direction (38%) versus the wrong track (56%) is similar to June’s results (37% to 57%). The right track rating declined after hitting an eight-year high in April (46%).
The Monmouth University Poll was conducted by telephone from July 21 to 26, 2021 with 804 adults in the United States. The question results in this release have a margin of error of +/- 3.5 percentage points. The poll was conducted by the Monmouth University Polling Institute in West Long Branch, NJ.
QUESTIONS AND RESULTS
(* Some columns may not add to 100% due to rounding.)
1.Do you approve or disapprove of the job Joe Biden is doing as president?
| TREND: | July 2021 | June 2021 | April 2021 | March 2021 | Jan. 2021 |
| Approve | 48% | 48% | 54% | 51% | 54% |
| Disapprove | 44% | 43% | 41% | 42% | 30% |
| (VOL) No opinion | 8% | 9% | 5% | 8% | 16% |
| (n) | (804) | (810) | (800) | (802) | (809) |
2.Do you approve or disapprove of the job the U.S. Congress is doing?
| TREND: | July 2021 | June 2021 | April 2021 | March 2021 | Jan. 2021 |
| Approve | 23% | 21% | 35% | 30% | 35% |
| Disapprove | 62% | 65% | 56% | 59% | 51% |
| (VOL) No opinion | 15% | 15% | 9% | 11% | 14% |
| (n) | (804) | (810) | (800) | (802) | (809) |
| TREND: Continued | Nov. 2020 | Early June 2020 | May 2020 | April 2020 | Feb. 2020 | Jan. 2020 | Dec. 2019 | Nov. 2019 | Sept. 2019 | Aug. 2019 | June 2019 | May 2019 | April 2019 | March 2019 | Jan. 2019 |
| Approve | 23% | 22% | 32% | 32% | 20% | 24% | 22% | 23% | 21% | 17% | 19% | 20% | 24% | 23% | 18% |
| Disapprove | 64% | 69% | 55% | 55% | 69% | 62% | 65% | 64% | 68% | 71% | 69% | 71% | 62% | 68% | 72% |
| (VOL) No opinion | 13% | 9% | 13% | 13% | 11% | 14% | 13% | 13% | 11% | 13% | 12% | 9% | 14% | 9% | 10% |
| (n) | (810) | (807) | (808) | (857) | (902) | (903) | (903) | (908) | (1,161) | (800) | (751) | (802) | (801) | (802) | (805) |
| TREND: Continued | Nov. 2018 | Aug. 2018 | June 2018 | April 2018 | March 2018 | Jan. 2018 | Dec. 2017 | Sept. 2017 | Aug. 2017 | July 2017 | May 2017 | March 2017 | Jan. 2017 |
| Approve | 23% | 17% | 19% | 17% | 18% | 21% | 16% | 17% | 18% | 19% | 19% | 25% | 23% |
| Disapprove | 63% | 69% | 67% | 71% | 72% | 68% | 65% | 69% | 69% | 70% | 68% | 59% | 66% |
| (VOL) No opinion | 14% | 14% | 14% | 12% | 11% | 11% | 19% | 15% | 13% | 11% | 13% | 16% | 11% |
| (n) | (802) | (805) | (806) | (803) | (803) | (806) | (806) | (1,009) | (805) | (800) | (1,002) | (801) | (801) |
| TREND: Continued | Sept. 2016* | Aug. 2016* | June 2016* | March 2016 | Jan. 2016 | Dec. 2015 | Oct. 2015 | Sept. 2015 | Aug. 2015 | July 2015 | June 2015 | April 2015 | Jan. 2015 | Dec. 2014 | July 2013 |
| Approve | 15% | 14% | 17% | 22% | 17% | 16% | 17% | 19% | 18% | 18% | 19% | 21% | 18% | 17% | 14% |
| Disapprove | 77% | 78% | 76% | 68% | 73% | 73% | 71% | 71% | 72% | 69% | 71% | 67% | 70% | 73% | 76% |
| (VOL) No opinion | 8% | 9% | 7% | 10% | 10% | 10% | 12% | 11% | 11% | 12% | 10% | 12% | 11% | 11% | 10% |
| (n) | (802) | (803) | (803) | (1,008) | (1,003) | (1,006) | (1,012) | (1,009) | (1,203) | (1,001) | (1,002) | (1,005) | (1,003) | (1,008) | (1,012) |
* Registered voters
3.Would you say things in the country are going in the right direction, or have they gotten off on the wrong track?
| TREND: | July 2021 | June 2021 | April 2021 | March 2021 | Jan. 2021 |
| Right direction | 38% | 37% | 46% | 34% | 42% |
| Wrong track | 56% | 57% | 50% | 61% | 51% |
| (VOL) Depends | 3% | 3% | 2% | 4% | 3% |
| (VOL) Don’t know | 4% | 3% | 2% | 2% | 4% |
| (n) | (804) | (810) | (800) | (802) | (809) |
| TREND: Continued | Nov. 2020 | Early Sept. 2020 | Aug. 2020 | Late June 2020 | Early June 2020 | May 2020 | April 2020 | March 2020 | Feb. 2020 | Jan. 2020 |
| Right direction | 26% | 27% | 22% | 18% | 21% | 33% | 30% | 39% | 37% | 37% |
| Wrong track | 68% | 66% | 72% | 74% | 74% | 60% | 61% | 54% | 57% | 56% |
| (VOL) Depends | 4% | 4% | 4% | 5% | 4% | 4% | 5% | 4% | 6% | 6% |
| (VOL) Don’t know | 2% | 3% | 2% | 3% | 1% | 3% | 5% | 3% | 1% | 1% |
| (n) | (810) | (867) | (868) | (867) | (807) | (808) | (857) | (851) | (902) | (903) |
| TREND: Continued | Dec. 2019 | Nov. 2019 | Sept. 2019 | Aug. 2019 | June 2019 | May 2019 | April 2019 | March 2019 | Nov. 2018 | Aug. 2018 | June 2018 | April 2018 | March 2018 | Jan. 2018 |
| Right direction | 32% | 30% | 30% | 28% | 31% | 29% | 28% | 29% | 35% | 35% | 40% | 33% | 31% | 37% |
| Wrong track | 56% | 61% | 61% | 62% | 62% | 63% | 62% | 63% | 55% | 57% | 53% | 58% | 61% | 57% |
| (VOL) Depends | 8% | 7% | 6% | 8% | 6% | 4% | 7% | 6% | 7% | 6% | 3% | 5% | 6% | 3% |
| (VOL) Don’t know | 4% | 2% | 2% | 2% | 2% | 3% | 3% | 2% | 3% | 3% | 3% | 4% | 1% | 3% |
| (n) | (903) | (908) | (1,161) | (800) | (751) | (802) | (801) | (802) | (802) | (805) | (806) | (803) | (803) | (806) |
| TREND: Continued | Dec. 2017 | Aug. 2017 | May 2017 | March 2017 | Jan. 2017 | Aug. 2016* | Oct. 2015 | July 2015 | June 2015 | April 2015 | Dec. 2014 | July 2013 |
| Right direction | 24% | 32% | 31% | 35% | 29% | 30% | 24% | 28% | 23% | 27% | 23% | 28% |
| Wrong track | 66% | 58% | 61% | 56% | 65% | 65% | 66% | 63% | 68% | 66% | 69% | 63% |
| (VOL) Depends | 7% | 4% | 5% | 4% | 4% | 2% | 6% | 5% | 5% | 5% | 5% | 5% |
| (VOL) Don’t know | 3% | 5% | 3% | 5% | 2% | 3% | 4% | 3% | 3% | 2% | 3% | 4% |
| (n) | (806) | (805) | (1,002) | (801) | (801) | (803) | (1,012) | (1,001) | (1,002) | (1,005) | (1,008) | (1,012) |
* Registered voters
4.Turning to issues closer to home, what is the biggest concern facing your family right now? [LIST WAS NOT READ]
| TREND: | July 2021 | Aug. 2020 | March 2020 | April 2019 | April 2018 | Jan. 2017 | Jan. 2015 |
| Coronavirus/COVID-19 | 17% | 39% | 57% | n/a | n/a | n/a | n/a |
| Everyday bills, groceries, etc. | 11% | 8% | 6% | 8% | 12% | 12% | 16% |
| The economy | 11% | 7% | 5% | 6% | 3% | 3% | 2% |
| Health care costs | 7% | 4% | 5% | 19% | 13% | 25% | 15% |
| Job security, unemployment | 7% | 10% | 7% | 7% | 9% | 14% | 16% |
| Inflation | 5% | n/a | n/a | n/a | n/a | n/a | n/a |
| Civil rights | 3% | 1% | 0% | 3% | 1% | 3% | n/a |
| Climate change, environment | 3% | 0% | 1% | 3% | 1% | 1% | n/a |
| Education policy | 3% | 3% | 1% | 2% | 2% | 1% | 2% |
| Family illness, health | 3% | 4% | 3% | 3% | 3% | 3% | 4% |
| Housing, mortgage, rent | 3% | 2% | 1% | 2% | 4% | 3% | 4% |
| Quality of government | 3% | 3% | 0% | 2% | 3% | 1% | 2% |
| Safety, crime | 3% | 3% | 1% | 3% | 3% | 3% | 2% |
| Taxes | 3% | 1% | 1% | 9% | 7% | 4% | 7% |
| College tuition, school costs | 2% | 1% | 0% | 3% | 4% | 4% | 10% |
| Immigration | 2% | 0% | 0% | 5% | 4% | 3% | 1% |
| Social Security, seniors | 1% | 1% | 0% | 3% | 3% | 3% | 2% |
| Terrorism, national security | 1% | 1% | 0% | 1% | 2% | 2% | 1% |
| Guns, gun ownership | 0% | 0% | 0% | 1% | 2% | n/a | n/a |
| Retirement saving | 0% | 1% | 0% | 0% | 1% | 2% | 3% |
| Other | 3% | 4% | 3% | 6% | 6% | 3% | 4% |
| Don’t know/No answer | 9% | 8% | 9% | 16% | 15% | 10% | 8% |
| (n) | (804) | (868) | (851) | (801) | (803) | (801) | (1,003) |
[Question 5 was asked only of those who mentioned a concern in Q4: n=730, moe=+/-3.6%]
5.Thinking about this most important concern, have the actions of the federal government over the past six months helped, hurt, or had no real impact on this concern?
| TREND: | July 2021 | April 2019* | April 2018* | Jan. 2017** | Jan. 2015** |
| Helped | 31% | 14% | 14% | 27% | 14% |
| Hurt | 34% | 42% | 39% | 37% | 47% |
| No real impact | 31% | 42% | 44% | 34% | 38% |
| (VOL) Don’t know | 3% | 2% | 3% | 2% | 2% |
| (n) | (730) | (692) | (680) | (728) | (926) |
** 2017 and 2015 asked about “the past few years”
* 2019 and 2018 asked about “the past year”
[Question 6 was asked only of those who mentioned a concern in Q4: n=730, moe=+/-3.6%]
6.And do you think the actions of the federal government over the next few years will help, hurt, or have no real impact on this concern?
| TREND: | July 2021 | April 2019 | April 2018 | Jan. 2017 |
| Help | 40% | 29% | 26% | 42% |
| Hurt | 34% | 32% | 36% | 33% |
| No real impact | 18% | 26% | 27% | 21% |
| (VOL) Don’t know | 8% | 13% | 11% | 4% |
| (n) | (730) | (692) | (680) | (728) |
7.How much have each of the following groups benefited from President Biden’s policies so far. [READ ITEM] – Have they benefited a lot, a little, or not at all? [ITEMS WERE ROTATED]
Middle class families
| COMPARISON: | Benefited under Trump | Benefited under Obama | ||||||||||
| July 2021 | June 2021 | Jan. 2021 | April 2019 | April 2018 | Dec. 2017 | Jan. 2017 | July 2013 | |||||
| A lot | 21% | 19% | 32% | 18% | 14% | 11% | 24% | 12% | ||||
| A little | 41% | 32% | 33% | 37% | 45% | 25% | 41% | 39% | ||||
| Not at all | 33% | 36% | 32% | 36% | 36% | 53% | 33% | 46% | ||||
| (VOL) Don’t know | 5% | 14% | 3% | 9% | 5% | 11% | 2% | 2% | ||||
| (n) | (804) | (810) | (809) | (801) | (803) | (806) | (801) | (1,012) | ||||
Wealthy families
| COMPARISON: | Benefited under Trump | Benefited under Obama | |||||||
| July 2021 | April 2019 | April 2018 | Jan. 2017 | July 2013 | |||||
| A lot | 22% | 58% | 57% | 29% | 35% | ||||
| A little | 30% | 22% | 26% | 43% | 31% | ||||
| Not at all | 35% | 9% | 7% | 17% | 23% | ||||
| (VOL) Don’t know | 14% | 11% | 10% | 10% | 10% | ||||
| (n) | (804) | (801) | (803) | (801) | (1,012) | ||||
Poor families
| COMPARISON: | Benefited under Trump | Benefited under Obama | |||||||
| July 2021 | April 2019 | April 2018 | Jan. 2017 | July 2013 | |||||
| A lot | 31% | 14% | 12% | 39% | 20% | ||||
| A little | 35% | 26% | 28% | 36% | 39% | ||||
| Not at all | 29% | 51% | 53% | 21% | 37% | ||||
| (VOL) Don’t know | 5% | 9% | 7% | 4% | 4% | ||||
| (n) | (804) | (801) | (803) | (801) | (1,012) | ||||
8.Earlier this year, Congress passed a $1.9 trillion stimulus plan in response to the coronavirus pandemic. In general, do you support or oppose this plan? [Is that strongly or somewhat support/oppose?]
| TREND: | July 2021 | June 2021 | April 2021 | March 2021* |
| Strongly support | 40% | 39% | 43% | 35% |
| Somewhat support | 22% | 21% | 20% | 27% |
| Somewhat oppose | 9% | 11% | 10% | 11% |
| Strongly oppose | 28% | 27% | 24% | 23% |
| (VOL) Don’t know | 2% | 3% | 2% | 4% |
| (n) | (804) | (810) | (800) | (802) |
* March 2021 poll asked about the plan before Congress passed it.
[QUESTIONS 9 & 10 WERE ROTATED]
President Biden proposed other multi-trillion dollar spending plans.
9.[One is/The other is] an infrastructure plan to be spent on roads, bridges and trains, internet access, power grid improvements, and clean energy projects. In general, do you support or oppose this plan? [Is that strongly or somewhat support/oppose?]
| TREND: | July 2021 | June 2021 | July 2021 | June 2021 | April 2021* | |
| Strongly support | 51% | 49% | Support | 70% | 68% | 68% |
| Somewhat support | 19% | 19% | ||||
| Somewhat oppose | 8% | 8% | Oppose | 29% | 29% | 29% |
| Strongly oppose | 21% | 21% | ||||
| (VOL) Don’t know | 2% | 3% | (VOL) Don’t know | 2% | 3% | 3% |
| (n) | (804) | (810) | (n) | (804) | (810) | (800) |
* April 2021 wording was “President Biden recently proposed a $2 trillion infrastructure plan…”
10.[One is/The other is] a plan to expand access to healthcare and childcare, and provide paid leave and college tuition support. In general, do you support or oppose this plan? [Is that strongly or somewhat support/oppose?]
| TREND: | July 2021 | June 2021 | July 2021 | June 2021 | April 2021* | |
| Strongly support | 47% | 41% | Support | 63% | 61% | 64% |
| Somewhat support | 16% | 20% | ||||
| Somewhat oppose | 8% | 10% | Oppose | 35% | 34% | 34% |
| Strongly oppose | 27% | 24% | ||||
| (VOL) Don’t know | 2% | 5% | (VOL) Don’t know | 2% | 5% | 2% |
| (n) | (804) | (810) | (n) | (804) | (810) | (800) |
* April 2021 wording was “Biden is also expected to propose a large spending plan …”
11.What would you like to see happen with these spending plans – pass them as is even if they don’t get bipartisan support, significantly cut them in order to get bipartisan support, or not pass them at all even if they have bipartisan support?
| TREND: | July 2021 | June 2021 |
| Pass them as is | 42% | 46% |
| Significantly cut them | 27% | 22% |
| Not pass them at all | 23% | 24% |
| (VOL) Don’t know | 8% | 9% |
| (n) | (804) | (810) |
11A.An attempt to start debate on a smaller bipartisan infrastructure bill failed in the Senate [this/last] week. Who is more responsible for this failure – the Democrats, the Republicans, both equally, or aren’t you sure? [CHOICES WERE ROTATED]
| July 2021 | |
| The Democrats | 18% |
| The Republicans | 26% |
| Both equally | 25% |
| Not sure | 30% |
| (n) | (804) |
[Q12-19 held for future release.]
[Q20-27 previously released.]
METHODOLOGY
The Monmouth University Poll was sponsored and conducted by the Monmouth University Polling Institute from July 21 to 26, 2021 with a national random sample of 804 adults age 18 and older. This includes 276 contacted by a live interviewer on a landline telephone and 528 contacted by a live interviewer on a cell phone, in English. Telephone numbers were selected through a mix of random digit dialing and list-based sampling. Landline respondents were selected with a modified Troldahl-Carter youngest adult household screen. Monmouth is responsible for all aspects of the survey design, data weighting and analysis. The full sample is weighted for region, age, education, gender and race based on US Census information (ACS 2018 one-year survey). Data collection support provided by Braun Research (field), Dynata (RDD sample), and Aristotle (list sample). For results based on this sample, one can say with 95% confidence that the error attributable to sampling has a maximum margin of plus or minus 3.5 percentage points (unadjusted for sample design). Sampling error can be larger for sub-groups (see table below). In addition to sampling error, one should bear in mind that question wording and practical difficulties in conducting surveys can introduce error or bias into the findings of opinion polls.
| DEMOGRAPHICS (weighted) |
| Self-Reported |
| 26% Republican |
| 41% Independent |
| 33% Democrat |
| 49% Male |
| 51% Female |
| 29% 18-34 |
| 33% 35-54 |
| 38% 55+ |
| 63% White |
| 12% Black |
| 16% Hispanic |
| 8% Asian/Other |
| 69% No degree |
| 31% 4 year degree |
Click on pdf file link below for full methodology and crosstabs by key demographic groups.