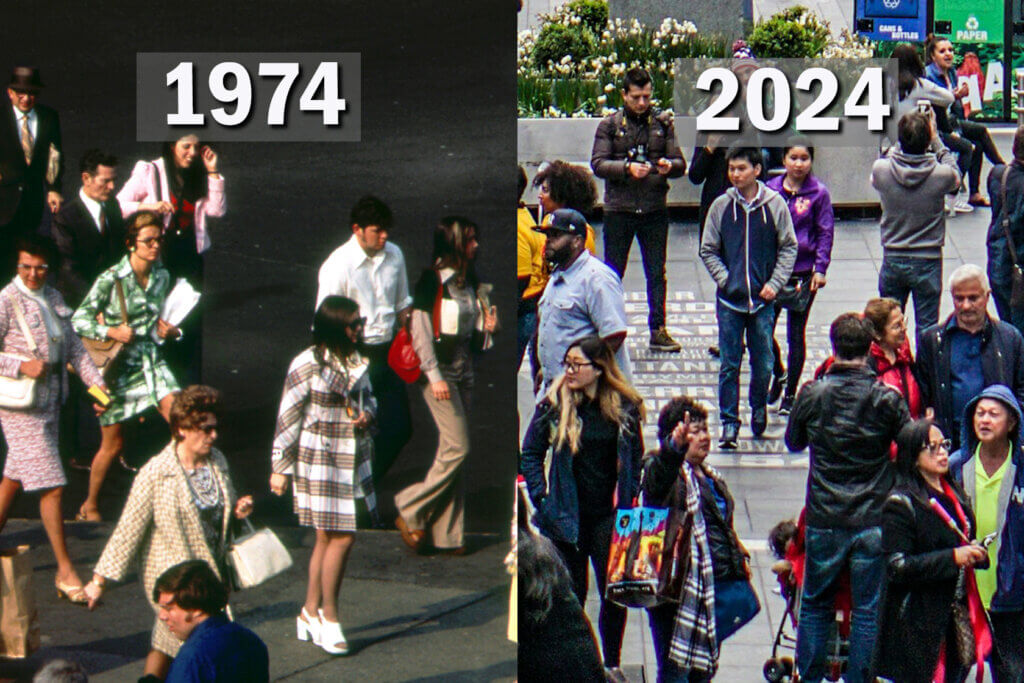
West Long Branch, NJ – Watergate may have defined 1974 much as our current political conflict defines today. Still, then, as now, Americans went about their day-to-day lives. To see how much, if at all, everyday activities and wishes have changed, the Monmouth (“Mon-muth”) University Poll posed some “slice of life” questions that were asked by national pollsters fifty years ago. One of the starkest differences the new poll reveals between then and now is a three-fold increase in the number of people who say they would like to move out of the country. Other less dramatic but still sizable shifts found in this retrospective take on national opinions and behavior are jumps in cooking and travel as hobby activities and some reordering of the countries that top Americans’ tourism wish list.
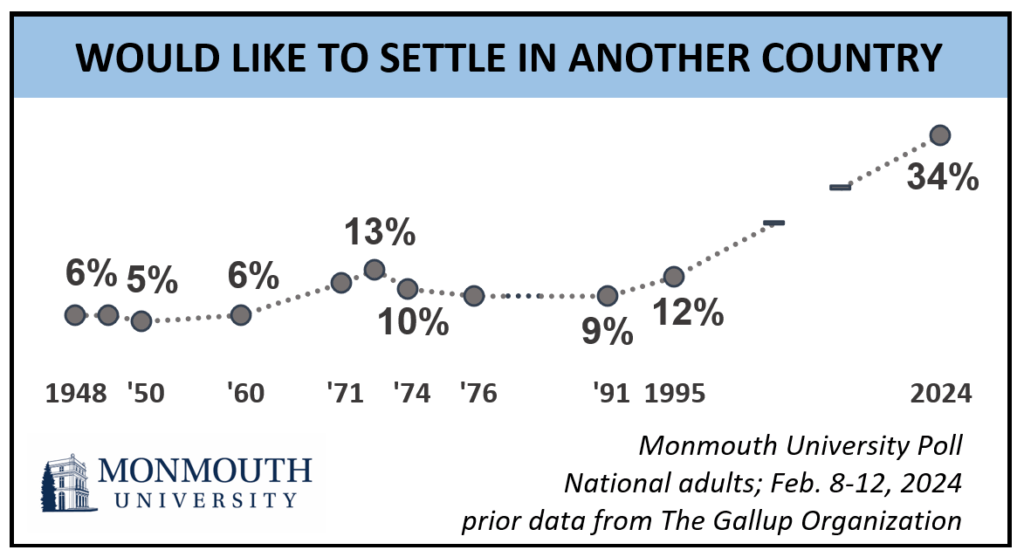
One-third (34%) of Americans would like to go and settle in another country if they were free to do so. Fifty years ago, this number stood at a much lower 10%. The Gallup Organization asked this question in eleven different national polls between 1948 and 1995. During that time, the desire to emigrate never went higher than 13% (1972) and dipped as low as 5% (1950). In fact, the number of people wanting to leave the country averaged 6% in polls taken between 1948 and 1960, hovered between 9% and 13% in the early to mid-1970s, and was a similar 9% to 12% in the 1990s.
Over that time, political independents have been somewhat more likely to want to move out of the U.S. than partisans. That remains true in the current poll, with 41% of independents saying they want to resettle in another country, compared with 35% of Democrats and 22% of Republicans. Fifty years ago, 13% of independents wanted to leave, along with 10% of Democrats and 9% of Republicans. The last time Gallup asked this question – in 1995 – these results stood at 17% of independents, 11% of Democrats, and 6% of Republicans who wanted to settle outside the United States.
There are significant age differences in wanting to move out of the country. Currently, half (51%) of those under the age of 35 want to resettle (up from 19% in 1974) as do 39% of those 35 to 54 years old (up from 6%). However, only 17% of Americans age 55 and older want to leave. This is a much less sizable increase from 1974 (4%) when compared with younger adults. The desire to resettle outside of the U.S. has increased among non-Hispanic whites (27%, up from 9% in 1974) and by an even larger amount among people of color (45%, up from 17%).
“After holding pretty steady over fifty years following World War II, there was a huge jump in the number of Americans who want to leave the country sometime in the last three decades. We are not sure exactly when this shift occurred because of the gap in polling on this question, but I’d be willing to bet that the partisan rancor of the past few years has played a significant role in the heightened desire to emigrate,” said Patrick Murray, director of the independent Monmouth University Polling Institute.
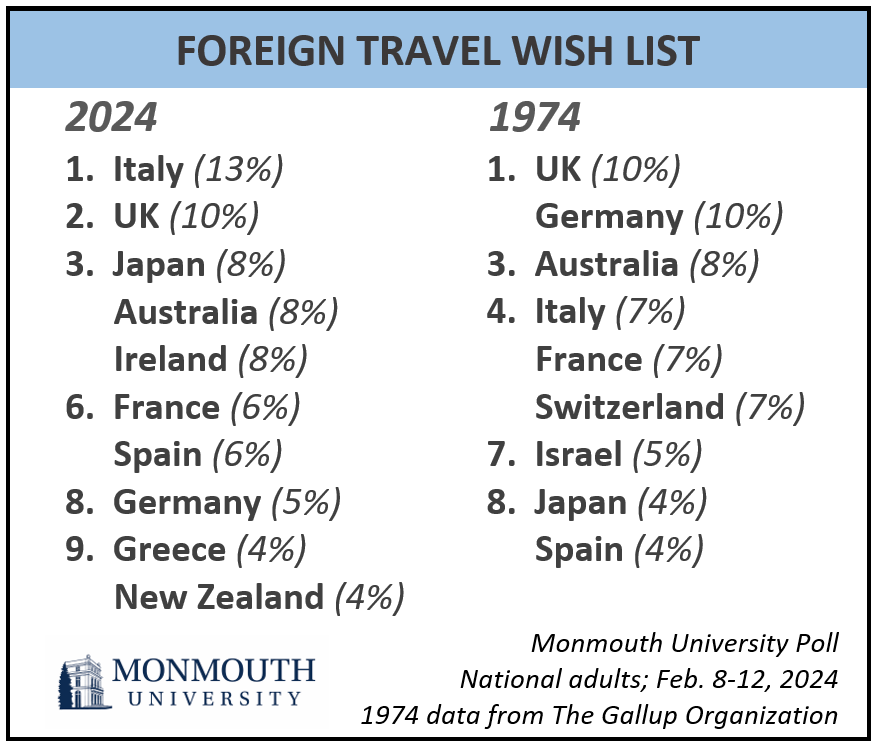
The poll did not specifically ask where people would like to move, but it did ask which countries they would be most interested in visiting. Compared with a Gallup poll taken in 1974 – the only other time this question was asked in a publicly released poll according to the Roper Center archives – interest in visiting Italy, Ireland, and New Zealand has notched up in the past fifty years while the desire to see Germany and Switzerland has dipped slightly. Specifically, 13% of Americans would like to visit Italy, making it the most popular bucket list destination. This is up from 7% who said the same in 1974. The second spot on the public’s travel wish list is the United Kingdom (including Britain, England, and Scotland) at 10%, which is identical to the number who wanted to visit there in 1974. Tied for third place are Australia (8%, identical to 1974), Japan (8%, up from 4%), and Ireland (8%, up from 3% in 1974). Japan is the top overseas wish list destination named by those who are less than 35 years old (17%).
European countries dominate the next tier of desired destinations, including France (6%), Spain (6%), Germany (5%), and Greece (4%). In 1974, Germany shared the top spot on this list with the U.K. (both were 10%). Other individual countries garnering more than a couple of percentage points interest include New Zealand (4%) – which did not register enough interest in the 1974 poll to be individually reported – along with Switzerland (3% down from 7%) and Mexico (3%, 2% in 1974). Americans who are Black, Asian, or Hispanic are somewhat more likely than white Americans to name Spain, Japan and other Asian countries, as well as Sub-Sahara Africa as places they would be most interested in visiting.
Fifty years ago, America’s top hobbies were cooking and gardening. According to the current Monmouth poll, they are now cooking (68%) and travel (61%). Cooking not only retained its top spot, but the number of people who partake in this activity as a hobby has increased since 1974 (up 31 points from 37%). There has been a similarly large jump in the number of Americans who engage in travel as a leisure activity (up 32 points from 29%). While gardening has fallen out of the top spot as an American hobby, the number who participate in this activity has increased over the past fifty years (47%, up 10 points from 37%). Crafting and making things has experienced an even larger increase (46%, up 25 points from 21%).
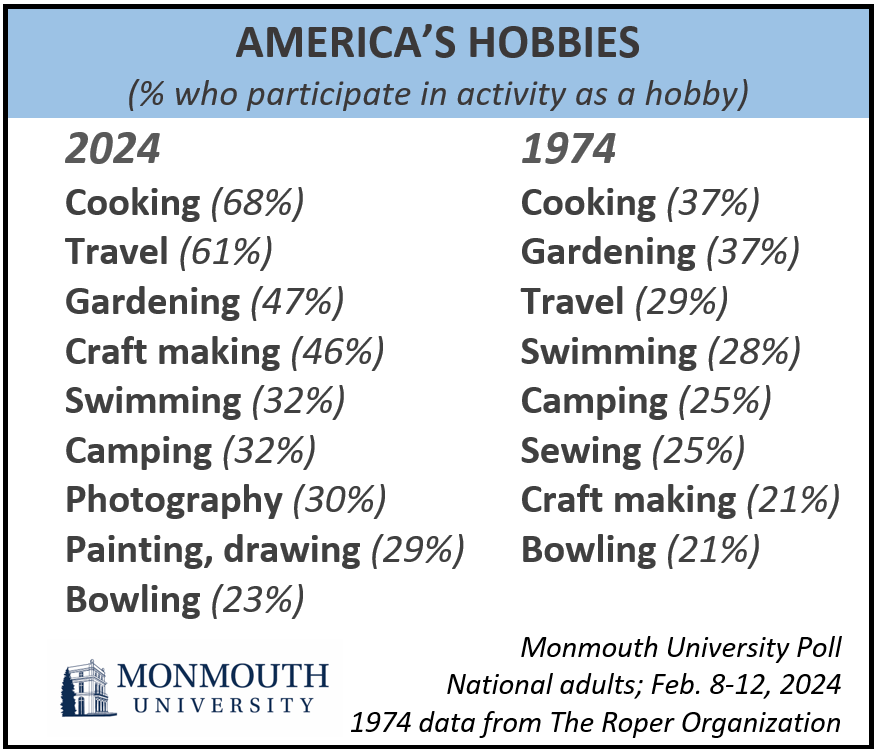
Other hobbies that have seen significant growth in American participation are photography (30%, up 20 points from 10%) and painting, sketching or drawing (29%, up 20 points from 9%). Another group of hobbies included in the poll are only a few points higher than their 1974 participation rates – camping (32%), swimming (32%), bowling, (23%), hunting (19%), golf (13%) – or in the case of sewing (19%), are slightly lower.
“Not only have America’s hobby preferences changed from fifty years ago, but the number of people engaged in leisure activities in general has also increased,” said Murray.
The poll finds some interesting demographic shifts for certain leisure activities. For example, more women (76%) than men (59%) name cooking as one of their hobbies, but this gap is much narrower than fifty years ago when 58% of women and just 14% of men said the same. In fact, the 45 percentage point jump in cooking among men is the largest gender shift in any participation rate among the 12 hobbies included in the poll. There has been a slightly larger increase among women (33%, up from 7%) than men (26%, up from 14%) for photography as hobby. On the other hand, fewer women participate in sewing as a hobby today compared with 1974 (30%, down from 46%), while the number of men who partake in this activity has ticked up a few points (8%, up from 1%), although this number remains much lower than for women. For other hobbies that have shown overall growth in American participation rates, the increase has been similar among both men and women. However, it is worth noting that, as in 1974, women are more likely to claim crafting (54%, to 38% for men), gardening (54%, to 42%) or painting (35%, to 23%) as a hobby, while men continue to be more likely to say hunting (28%, to 9% for women) or golf (19%, to 7%) is one of their hobbies.
There are some interesting racial differences in America’s choice of hobbies. Today, people of color (32%) are more likely than non-Hispanic whites (17%) to go bowling regularly. This gap was flipped fifty years ago (11% people of color and 22% white). Just under half of both people of color (49%) and white Americans (46%) report gardening as a hobby, but there was a big racial disparity in 1974 – just 15% of people of color gardened compared with 39% of whites. Similarly, there is no difference today in the proportion of people of color (33%) and non-Hispanic white Americans (32%) who report camping as one of their hobbies. However, in 1974, just 7% of people of color did this compared with 27% of white Americans. Swimming is another area where racial disparities in participation rates fifty years ago (10% people of color and 31% white Americans in 1974) have largely dissipated (35% people of color and 30% white Americans in 2024). It should be noted, though, that people of color in the population were primarily Black Americans, whereas today there is a broader mix including Black, Hispanic and Asian residents.
The poll also found some age-related differences in hobby participation, both in overall rates and shifts since 1974. Fifty years ago, seniors were much less likely than younger American adults to go swimming on a regular basis. Today there is much less of an age difference in reported rates of swimming as a hobby – 27% of those age 55 and older, 38% of those age 35 to 54 and 33% of those age 18 to 34. Similarly, younger adults are more likely to take up painting and drawing (43% age 18 to 34, compared with 29% age 35 to 54 and 18% age 55 or older), whereas in 1974 no more than 1 in 7 in any age group did this as a hobby.
“The shifts in America’s favorite hobbies over the past fifty years show a breaking down of some barriers. We see higher participation rates among people of color for ‘nature’ activities than we did in 1974. But these demographic shifts in leisure activities don’t tell us everything. For example, having more men tooling around in the kitchen as a hobby doesn’t exactly tell us how often they show up to prepare the family meal,” said Murray. Data from the 1974 Gallup and Roper polls referenced in this report were provided by the Roper Center for Public Opinion Research archives.
The Monmouth University Poll was conducted by telephone from February 8 to 12, 2024 with 902 adults in the United States. The question results in this release have a margin of error of +/- 4.1 percentage points for the full sample. The poll was conducted by the Monmouth University Polling Institute in West Long Branch, NJ.
QUESTIONS AND RESULTS
(* Some columns may not add to 100% due to rounding.)
[Q1-34 previously released.]
35.I’m going to read you a list of hobbies and leisure activities. For each one, please tell me if this is something you spend enough time on or follow closely enough to call a real hobby of yours, or not. [ITEMS WERE ROTATED]
| Trend: | Feb. 2024 | Apr. 1974* |
|---|---|---|
| Gardening | 47% | 37% |
| Cooking | 68% | 37% |
| Camping | 32% | 25% |
| Sewing | 19% | 25% |
| Bowling | 23% | 21% |
| Hunting | 19% | 17% |
| Crafts, making things | 46% | 21% |
| Photography | 30% | 10% |
| Painting, sketching, drawing | 29% | 9% |
| Swimming | 32% | 28% |
| Golf | 13% | 10% |
| Travel | 61% | 29% |
| (n) | (902) | (1,984) |
36.Of all the countries in the world, which would you be most interested in visiting? [LIST NOT READ] [Note: Results add to more than 100% because multiple responses were accepted.]
| Trend: | Feb. 2024 | Mar. 1974* |
|---|---|---|
| Italy | 13% | 7% |
| UK (Britain, England, Scotland) | 10% | 10% |
| Ireland | 8% | 3% |
| France | 6% | 7% |
| Spain | 6% | 4% |
| Germany | 5% | 10% |
| Greece | 4% | 1% |
| Switzerland | 3% | 7% |
| Netherlands, Holland | 1% | 1% |
| Iceland | 2% | n/a |
| Other Scandinavian countries | 1% | 4% |
| Eastern Europe, Balkans | 3% | 3% |
| Other European counties | 1% | n/a |
| “Europe” | 2% | 5% |
| Australia | 8% | 8% |
| New Zealand | 4% | n/a |
| Japan | 8% | 4% |
| Thailand | 2% | n/a |
| China | 1% | 2% |
| Other Asia & South Pacific | 4% | n/a |
| Israel | 2% | 5% |
| Egypt | 2% | n/a |
| North Africa & Middle East | 1% | n/a |
| Sub-Sahara Africa | 3% | 4% |
| Canada | 2% | 3% |
| Mexico | 3% | 2% |
| Central & South America | 3% | n/a |
| Caribbean | 2% | n/a |
| Other | 1% | 13% |
| U.S.A. | 6% | 12% |
| None | 5% | 5% |
| (VOL) Don’t know | 6% | 2% |
| (n) | (902) | (1,582) |
37.If you were free to do so, would you like to go and settle in another country, or not?
| Trend: | Feb. 2024 | Jan. 1974* |
|---|---|---|
| Yes | 34% | 10% |
| No | 64% | 87% |
| (VOL) Don’t know | 2% | 3% |
| (n) | (902) | (1,591) |
METHODOLOGY
The Monmouth University Poll was sponsored and conducted by the Monmouth University Polling Institute from February 8 to 12, 2024 with a probability-based national random sample of 902 adults age 18 and older. Interviews were conducted in English, and included 183 live landline telephone interviews, 362 live cell phone interviews, and 357 online surveys via a cell phone text invitation. Telephone numbers were selected through a mix of random digit dialing and list-based sampling. Landline respondents were selected with a modified Troldahl-Carter youngest adult household screen. Interviewing services were provided by Braun Research, with sample obtained from Dynata (RDD, n= 557), Aristotle (list, n= 152) and a panel of prior Monmouth poll participants (n= 193). Monmouth is responsible for all aspects of the survey design, data weighting and analysis. The full sample is weighted for region, age, education, gender and race based on US Census information (ACS 2021 one-year survey). For results based on this sample, one can say with 95% confidence that the error attributable to sampling has a maximum margin of plus or minus 4.1 percentage points adjusted for sample design effects (1.56). Sampling error can be larger for sub-groups (see table below). In addition to sampling error, one should bear in mind that question wording and practical difficulties in conducting surveys can introduce error or bias into the findings of opinion polls.
Demographics (weighted)
Party (self-reported): 28% Republican, 40% Independent, 32% Democrat
Sex: 48% male, 51% female, 1% other
Age: 29% 18-34, 33% 35-54, 38% 55+
Race: 61% White, 12% Black, 17% Hispanic, 10% Asian/other
Education: 37% high school or less, 29% some college, 19% 4 year degree, 15% graduate degree
Click on pdf file link below for full methodology and crosstabs by key demographic groups.


